A Proposal for an Alternative to MTBF/MTTF
•
25 likes•5,711 views

ASQ Reliability Division Webinar July 10, 2014 James McLeish DfR Solutions

Recommended
Recommended
More Related Content
What's hot
What's hot (20)
Viewers also liked
Viewers also liked (20)
Similar to A Proposal for an Alternative to MTBF/MTTF
Similar to A Proposal for an Alternative to MTBF/MTTF (20)
More from ASQ Reliability Division
More from ASQ Reliability Division (20)
Recently uploaded
Recently uploaded (20)
A Proposal for an Alternative to MTBF/MTTF
- 1. 1 9000 Virginia Manor Rd. Suite 290, Beltsville MD 20705 | 301-474-0607 | www.dfrsolutions.com Does the DoD use the Wrong Reliability Metric? A Proposal for an Alternative to MTBF/MTTF James McLeish ASQ Reliability Division Webinar July 10, 2014 jmcleish@dfrsolutions.com
- 2. 2 9000 Virginia Manor Rd. Suite 290, Beltsville MD 20705 | 301-474-0607 | www.dfrsolutions.com o Accurate measurements are essential for understanding, controlling and improving processes and performance. o For many decades the primary metric for measuring reliability in the defense and aerospace industries has been the Mean Time Between or To Failures (MTBF/MTTF (i.e. MTxF)) metrics. o They are used despite the facts that these metrics are widely misunderstood and misinterpreted, due to the incomplete view they provide of actual system or equipment dependability performance across the entire product lifecycle. o This often results in a misleading, overly optimistic reliability assessment that can hide potential failure and safety issues. o Yet the use of the MTBF/MTTF metrics continues because they have been codified into numerous military standards, specs and handbooks. o This webinar will review the origins of the MTBF/MTTF metrics and discuss what they do and do not represent from a Physics of Failure point of view and provide recommendations for Better Reliability Metrics. o Note: This Webinar evolved an article Post at http://nomtbf.com/ o Replacing MTBF/MTTF with Bx/Lx Reliability Metrics o http://nomtbf.com/2013/09/replacing-mtbf-bx/ Abstract
- 3. 3 9000 Virginia Manor Rd. Suite 290, Beltsville MD 20705 | 301-474-0607 | www.dfrsolutions.com o Mean Time Between Failures (MTBF also known as Theta (Θ)): o The statistical average of the time between failures across a population or fleet of systems or components that are repairable or replaceable, calculated by dividing the total accumulated population operating or field time by the number of failures. o Mean Time To Failure (MTTF): o The statistical average of the time between failures of a population or fleet of systems or components that are not repairable or replaceable, calculated by dividing the total accumulated population operating or field time by the number of failures. o The Inverse of MTxF is known as the Failure Rate (λ) (Note: for Vehicles Mean Miles Between/To Failure is sometime used instead of time) What is MTBF / MTTF MTxF (Θ) = Σ0 x( Unitsx * Each Unitsx Operating or Field Time) Number of Failures Failure Rate (λ) = 1 . MTxF
- 4. 4 9000 Virginia Manor Rd. Suite 290, Beltsville MD 20705 | 301-474-0607 | www.dfrsolutions.com o MTxF is used in various industries (especially defense & aerospace) to represent reliability, but is widely misquoted, misunderstood & sometimes abused o The most common misconception is that MTxF refers to the expected service life or failure free operating period between failures OF A SINGLE DEVICE o In reality MTxF is the inverse of the average failure rate of a fleet of devices o Example: A MTBF of 1,000,000 fleet hours in a fleet of 10,000 units o Results in a time to failure ever 100 fleet hours o If the 10,000 unit fleet operates 24 hrs./day o 240,000 Fleet hrs. are accumulated daily o Then on average a failure can be expected somewhere in the fleet every 4.1667 days o While this metric has value to Logisticians working to provide the needed spare parts to support the deployment of a military division, It does not represent actual reliability or service life. o Many misconceptions could be avoided if the term “Fleet or Population” Hours, Time, or Miles” were used instead of simply Hours, Time or Miles MTBF / MTTF Conceptions vs Reality
- 5. 5 9000 Virginia Manor Rd. Suite 290, Beltsville MD 20705 | 301-474-0607 | www.dfrsolutions.com o “IF” a constant Failure Fate or MTxF applies, the reliability at a point in time can be calculate by the equation: o Example: R@2,400 hrs = e–2,400/1,000,000 = e-.0024 = 0.9976 = 10,000 units x (1-0.9976) = 23.97 Failures (2,400 hrs, Operating at 24 hrs/day = 100 days) R@8,760 hrs = e–8.760/1,000,000 = e-.008760 = 0.9912 10,000 units x (1-0.9912) = 87.2 Failures (8,760 hrs/Operating at 24 hrs/day = 365 days = 1year) o Unfortunately the constant failure (or Random Failure) Portion of the hypothetical bath tub curve is not realistic, and o If a constant failure rate period did exists, it can not last forever, wear-out failures of the device would eventually limit its life much earlier than its MTBF o Therefore, there is no direct correlation between the service life of a device and its failure rate or MTxF MTBF / MTTF & Reliability Rt = e-λt = e-t/MTxF
- 6. 6 9000 Virginia Manor Rd. Suite 290, Beltsville MD 20705 | 301-474-0607 | www.dfrsolutions.com 0 1 2 3 Time - Years 4 5 6 7 Focuses on 3 Separate & Individual Life Cycle Phases, each with Separate Control & Improvement Strategies, Produced the Misguided Belief that Reliability Efforts Should Focus Only On Random Failure Issues The Traditional View of Quality, Reliability & Durability (QRD) - Product Life Cycle Failure Rate “Bath Tub” Curve ProblemorFailureRate End of Useful Life /Typ. Replacement Decision Pt. The Bath Tub Curve (Sum of 3 Independent Phenomena) Durability = Wear Out (End of Useful Life) Reliability = Random or Chance Problems (Constant Unavoidable) But “True” Root Causes Can Be Disguised by Actuarial Assumptions that Make QRD Data Analysis Easy to Perform & Administer This is an Inaccurate & Misleading Point of View Quality = Infant Mortality
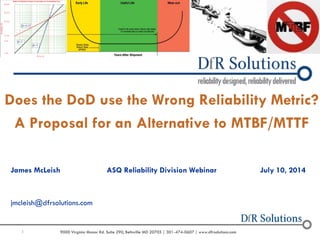
- 7. 7 9000 Virginia Manor Rd. Suite 290, Beltsville MD 20705 | 301-474-0607 | www.dfrsolutions.com Real failure rate curves are irregular, dynamic and full of valuable information, not clean smooth curves to simplify the data plots. A “PoF FAILURE MECHANISM” Based “REALISTIC” View Reveals the True Interactive Relationships Between Q, R & D ProblemorFailureRate Manuf. Variation & Error and Service Errors That Cause Latent Problems Throughout Life “Cause & Effect” Root Causes Can Be Disguised by Actuarial Statistics Once Problems Are Accurately Categorized You Have Realistic Picture of “True Root Causes” Weak Designs That Start to Wear Out Prematurely TRUE Random Problems Are Rare Once Correlated to “ACTS OF GOD & WAR” 0 1 2 3 Years 4 5 6 7
- 8. 8 9000 Virginia Manor Rd. Suite 290, Beltsville MD 20705 | 301-474-0607 | www.dfrsolutions.com A Constant MTxF/Failure Rate is a Statistical Aberration that Doesn’t Occur in Reality o Just because a distribution can be averaged does not mean that the average accurately represents the entire distribution. o The constant Failure Rate/MTxF concept is the result of statistical manipulations by 1960 era actuarial principles used to simplify data crunching and reporting o Physics of Failure Research has produced a Different Point of View & Classifications: Infant Morality Failures are Actually due to: Manuf. Errors. Excessive Manuf. Variation or Design Errors that Produce Defects or Weaknesses Can cause either Initial Failures or Latent Failures Throughout Life (Correlates to the Safety Enrg. Definition of Systematic Failures In Weak Designs Wear Out Failure Mechanisms Can Start Prematurely Also Correlates to the Safety Enrg. Definition of Random “True” Random Failures are Due to Chance Encounters with “Overstress” Conditions that Exceeds the Capabilities/Strength of the Device (Pot Holes, EOS, Vehicle Impacts) - In Well Designed Products Random Failure are Rare Attributable to “Acts of God or War”
- 9. 9 9000 Virginia Manor Rd. Suite 290, Beltsville MD 20705 | 301-474-0607 | www.dfrsolutions.com o MTxF metrics are often used without an understanding of what they represent o Basic and necessary assumptions on what constitutes a failure are not stated. o MTXF does not characterize the expected failure free period or the useful life o A single discrete number does not give any insight into the characteristics of the actual distribution beyond the arithmetic mean. o While MTxF may be one aspect of reliability, it is insufficient to accurately represent all attributes of Reliability. o Which results in uncertainty on what is the actual reliability of a device MTBF is a Non-Intuitive Reliability “Buzz Word”.
- 10. 10 9000 Virginia Manor Rd. Suite 290, Beltsville MD 20705 | 301-474-0607 | www.dfrsolutions.com MTBF/MTTF is Insufficient for Representing the Classical Definition of Reliability: o “The Probability of an item to perform required functions, under stated conditions, for a stated period of time” o MTxF is a coarse metric with limited value for designing reliability into products o An arithmetic mean is a poor metric for representing complex relationships o Insufficient to represent the influenced of outliers spread and distribution of the endurance / reliability of a population. o Time to first failure, failures over time, usage/durability life & total service lifetime failure are more useful reliability metrics. o The misconception of a Constant/Random Failure Period can results in qualification using short reliability demonstration tests instead of Longer Durability Testing 3 Failure Distributions (with the same Mean) But Vastly Different Times to 1st Failure Identifying Equipment Durability and Times to 1st Failure for Various Failure Mechanisms & Operating Conditions is More Vital than a MTxF or Mean Failure Rate
- 11. 11 9000 Virginia Manor Rd. Suite 290, Beltsville MD 20705 | 301-474-0607 | www.dfrsolutions.com o MTxF is cited in numerous military standards, specs & handbooks. o Caused the practice to spread throughout the defense, aerospace & electronic industries as contractors were required to providing MTxF data. o Further documented in numerous reliability text books and college courses o Migrated to other engineering disciplines especially FAA & Safety Engineering o The MTxF metric is desired in some industries o Simplicity of a single number metric o Easy alternative to implementing more comprehensive activities that better address all reliability issues. o Since MTxF DOES NOT represent the actual expected service life of a device or its expected failure free period, this confusion may sometimes be desired as a marketing scheme to produce a perception of High Reliability that avoids addressing real reliability issue If MTxF is so Misleading - Then Why is it So Widely Used
- 12. 12 9000 Virginia Manor Rd. Suite 290, Beltsville MD 20705 | 301-474-0607 | www.dfrsolutions.com The Origins of MTBF/MTTF o 1957 AGREE Commision Report - Task Group 1 Advisory Group on Reliability of Electronic Equipment Developed for use on the Computational Technologies of the 1950’s Mechanical Adding Machines & The Slide Ruler A Reliability Metric Tailored to the Leading Electronic Technology of the 1950’s The Vacuum Tube & Vacuum Tube Assemblies Early Discreet Transistor & Diodes
- 13. 13 9000 Virginia Manor Rd. Suite 290, Beltsville MD 20705 | 301-474-0607 | www.dfrsolutions.com The Need for a Review and updating of Reliability Tools and Paradigms for Effectiveness and Best Practices o The Quality profession is consistently innovating, sharing best practices, developing new tools & methods and being a change agent for Quality, while maintaining & updating standards: o Continuous Improvement o ISO-9000 o 6- Sigma Quality Methods o However, with many organizations & branches of the reliability profession continue to cling to outdated, concepts & standards. o Due to lack of effort to update and maintain standards or spec templates o Due to a lack of cross pollination of best practices from other industries
- 14. 14 9000 Virginia Manor Rd. Suite 290, Beltsville MD 20705 | 301-474-0607 | www.dfrsolutions.com 14 Current Situation as defined by the U.S. Defense Science Board Task Force on Developmental Test and Evaluation (DT&E) o Non optimized Reliability Metrics may be a reason why “In recent years, there has been a dramatic increase in the number (~2/3) of (military) systems not meeting suitability requirements”. o “RAM deficiencies comprise the primary shortfall areas”. o The results have been: o “Costly redesign & schedule delays.” o “High maintenance burden & costs as field personnel must replace or repair unreliable systems and components that were deployed without achieving reliability objectives.”
- 15. 15 9000 Virginia Manor Rd. Suite 290, Beltsville MD 20705 | 301-474-0607 | www.dfrsolutions.com Other Views on - The Need for Updating the Reliability Profession o “Reliability engineering historically has been focused on statistical & probabilistic models which often do not have valid traceability to physical failure mechanisms” o Kirk Gray - Accelerated Reliability Solutions & Hobbs Engineering Instructor “What Why When and How to Apply HALT & HASS”. “What started as a simple observation has developed into a personal mission to stop the widespread misuse, misunderstanding and misinformation circling around MTBF. The acronym, MTBF, stands for Mean Time Between Failure. It is very likely the worst four letter acronym in the reliability engineering profession.” o Fred Schenkelberg at http://nomtbf.com/ Former ASQ Reliability Division Chairman "Unfortunately, the development of reliability engineering has been afflicted with more nonsense than any other branch of Engineering." o Patrick O'Connor Consultant & Author of: “Practical Reliability Engineering” “In Reliability and Quality Engineering, Physics Always Trumps Mathematics” o Dr. Andre Kleyner, Global Reliability Engineering Leader - Delphi Electronics “Notable Quotes” ASQ Quality Progress Nov. 2013
- 16. 16 9000 Virginia Manor Rd. Suite 290, Beltsville MD 20705 | 301-474-0607 | www.dfrsolutions.com Recommendation For An Improved Reliability Metric – Bx/Lx - A Blast from the Past o Bx/Lx - the Life Point (hrs., days, yrs. or cycles) When No More Than x% of Failures Have Occurred. o A single metric that includes a Performance AND Durability element o Max. Allowable % Failures (i.e. 1-R% ) AND the a Durability Life Point. o Life point where no more than 10% (R≥90%) of failures occur in a population. o A Time to “Early Failure” Focus o Failure values other that 10% can be used (i.e. 5%, 2%, 1%, 0.5% 0.1% . . . ) o Predates MTBF/MTTF o Evolved from the B10 Bearing Life metric, (also used in Machinery & Auto Industries) o Promotes Weibull Analysis o A Valid, Widely Used, Comprehensive Metric, that the AGREE Commission failed to adapt to Electrical Equipment, due to the desire for a metric that related more to Logistics than sustainability
- 17. 17 9000 Virginia Manor Rd. Suite 290, Beltsville MD 20705 | 301-474-0607 | www.dfrsolutions.com Benefits of the Bx/Lx Reliability Metric o A More Comprehensive Reliability Metric Requires: o Reliability Values Correlated to a Point in Usage or Field Time o Under Application Appropriate Usage and Environmental Stress Conditions o The Bx/Lx - Life Point can de defined in Hrs., Days, Yrs., Miles, Cycles . . . as appropriate to the durability characteristic of interest in an application o A Time to “Early or First Failure” Focus o Failure values other that 10% can be used (i.e. 5%, 2%, 1%, 0.5% 0.1% . . . ) o Improvement over the Traditional (MTBF/MTTF) Reliability Metric o Mean Time Between Failure / Mean Time To Failure o Represents when 50% of the failures in a diverse population have occurred during only the useful life phase (assumes wearout does not occur) o Arithmetic mean is a poor metric since it is greatly influenced by outliers and the spread/distribution of the population. o Can be used in conjunction with MTxF o Since many organization are familiar/comfortable with MTxF and use it for logistic, there would be resistance to eliminating MTxF o Would be easier to add Bx/Lx metrics along side MTxF
- 18. 18 9000 Virginia Manor Rd. Suite 290, Beltsville MD 20705 | 301-474-0607 | www.dfrsolutions.com Physics of Failure Durability Simulation Modeling - Failure Risk Life Curves for each Failure Mechanism Tallied to Produce a Combined Life Curve o Bx/Lx Over Time o Detailed Design & Application Specific PoF Life Curves are Far More Useful than a simple single point MTxF value. PTH Thermal Cycling Fatigue Wear Out Thermal Cycling Solder Fatigue Wear Out Vibration Fatigue Wear Out Over All Module Combined Risk Cumulative Failures from Generic, Actuarial, Constant Mean Failure Rate Tables in MIL-HDBK-217 Example of a Physics of Failure Failure Risk Over Time Plot from the Sherlock ADA Durability Simulation CAE App. Ref. http://www.dfrsolutions.com/software/ Over All Mean Life
- 19. 19 9000 Virginia Manor Rd. Suite 290, Beltsville MD 20705 | 301-474-0607 | www.dfrsolutions.com o First, stop using MTBF yourself. o Take and use the life data you already have and instead of calculating the MTBF, calculate appropriate reliability function. Fit to Weibull or Lognormal or whatever is appropriate o Second, show others the information produced by directly using Reliability data rather than using MTBF. o Show the real life data to your customers, vendors, suppliers &engineering teams o Show to marketing, finance, sales & especially decisions makes data o Show that using an accurate reflection of reliability data permits better decisions o It will save you time, money, resources, and frustration o Be amazed at how quickly others understand the value of real reliability data o Even managers will get it. o Third, if require translate your work back to MTBF o Provide the MTBF value with the duration over which it is appropriate o Show the impact of assuming a constant failure rate when it isn’t true o Focus on the value of making good decisions and the cost of making poor decisions. What Can You Do If Your Industry Uses MTBF? (From Fred Schenkelberg : http://nomtbf.com/2014/06/industry-mtbf-use/#more-1374)
- 20. 20 9000 Virginia Manor Rd. Suite 290, Beltsville MD 20705 | 301-474-0607 | www.dfrsolutions.com Random Failure Definition Differences Between Safety & Reliability Professionals o Emerging Function Safety Standards o IEC 61508 E/E Equipment o ISO 26262 Automotive E/E Systems o Risk-based safety standard, where the risk of hazardous failure operational situations are qualitatively assessed and safety measures are defined to: o Avoid or control Systematic Failures o Detect, control or mitigate effects of Random Hardware Failures o Requires commonly recognized industry sources be used to determine the hardware part failure rates and the failure mode distributions IEC/TR 62380, IEC 61709, MIL HDBK 217 F notice 2, RIAC HDBK 217 Plus, UTE C80-811, NPRD 95, EN 50129:2003, Annex C, IEC 62061:2005, Annex D, RIAC FMD97 and MIL HDBK 338. o Preparation of Self Driving Robotic Vehicle o Examples: Google Car, Autonomous Drones o Revealing fundamental difference in definition in MTxF /Random Failure Rate between the Safety Engineering & Reliability Engineering Professions
- 21. 21 9000 Virginia Manor Rd. Suite 290, Beltsville MD 20705 | 301-474-0607 | www.dfrsolutions.com Failure Definition Differences Between Safety & Reliability Professionals o In Safety Engineering faults which lead to failures are classified as either Random or Systematic: o Random Faults are due to physical causes (such as corrosion, thermal stressing and wear-out . . . etc.) o To safety professions “Random Failure are not assumed to have a Constant Failure Rate o However they due reference averaged failure probability & risk derived from statistical analysis from testing and historical data. o Systematic Faults are produced by human error during system development & operation. o Can be created in any stage of the system’s life (i.e. specification, design, manufacture, operation, maintenance, decommissioning). o Since it is difficult to predict the occurrence of systematic faults and their effect on safety the implementation of best practices to prevent errors and defects are employed
- 22. 22 9000 Virginia Manor Rd. Suite 290, Beltsville MD 20705 | 301-474-0607 | www.dfrsolutions.com Definition of Random Failure Differences Between Safety & Reliability Professionals The Safety Profession used a “Common Sense Definition” Unfortunately Classical Reliability Professionals & the “Recognized Industry Sources” use a Different Definition Developed by Actuaries & Defined in the 1960’s US DoD AGREE Commission Report (Advisory Group on Reliability of Electrical Equipment) http://safetyengineering.wordpress.com/2008/04/09/systematic-and-random-failure/
- 23. 23 9000 Virginia Manor Rd. Suite 290, Beltsville MD 20705 | 301-474-0607 | www.dfrsolutions.com Failure Definition Differences Between Safety & Reliability Professionals o In Classical Reliability Engineering Random Failures are denoted by the “Flat” (i.e. Constant Failure Rate portion) of the hazard function (bathtub curve) between: o A Presumed Short Infant Mortality Phase (denoted by a “Decreasing” Failure Rate) o A Presumed Distant Wear out Phase (denoted by an “Increasing” Failure Rate) o Therefore the “recognized industry sources” in theory do not account for Infant Mortality or Durability Wearout issue that the safety professional at expecting to be quantified. Random Means Constant i.e. Equally likely to occur, at any time, in the usage life Random Failure Rate λ The Inverse of the Random Constant Failure Rate is Known as the Mean Time Between Failures 1 / λ = MTBF
- 24. 24 9000 Virginia Manor Rd. Suite 290, Beltsville MD 20705 | 301-474-0607 | www.dfrsolutions.com Summary: Mean Time Between or To Failures (MTBF / MTTF) o The MTxF reliability metric is widely cited & often criticized o It is the average usage time between repairable or permanent failures, of a fleet of items o The inverse of the average failure rate (λavg) i.e. MTBF = 1 / λavg o Characterizes a system often for logistic maintenance spare parts purposes o Often misinterpreted as a failure free life period of a single system o A single “number” that attempts to describe a complex life time o By assuming that failures occur at a constant rate because: o Quality related infant mortality failures are insignificant due to screening o End of life wearout failures occur outside of the useful service life o Results in an over simplification that misrepresents reality. o Better Reliability Metrics correlate reliability or failure to a point in operating or in service durability time or are plots across a time line, Examples . o Bx/Lx Reliability Metrics o Physics of Failure Durability Simulation plots
- 25. 25 9000 Virginia Manor Rd. Suite 290, Beltsville MD 20705 | 301-474-0607 | www.dfrsolutions.com In Conclusion: o Reliability Metrics that are Better Than MTxF Exist o Is it Now Time of All Segments of the Reliability Profession to Update from 50-60 Year Old AGREE Commission Principles? o Especially with the introduction of Functional Safety REquirements If Not, Preventable QRD Issues May Continue into the Far Future and Galaxies Far, Far Away!
- 26. 26 9000 Virginia Manor Rd. Suite 290, Beltsville MD 20705 | 301-474-0607 | www.dfrsolutions.com Want to Know More – Suggested Reading
- 27. 27 9000 Virginia Manor Rd. Suite 290, Beltsville MD 20705 | 301-474-0607 | www.dfrsolutions.com Questions & Discussion Thank you for your attention For More Information or a copy of the Presentation Slides Contact: jmcleish@dfrsolutions.com
- 28. Today’s Speaker Bio: James McLeish is a senior technical staff consultant and manager of the Michigan office of DfR (Design for Reliability) Solutions, a Failure Analysis, Laboratory Services and Reliability Physics Engineering Consulting Firm headquartered in Beltsville Maryland. Mr. McLeish is a senior member of the ASQ Reliability Division and a core member of the SAE’s Reliability Standard Committee with over 32 years of automotive and military E/E experience in design, development, validation testing, production quality and field reliability. He has held numerous technical expert and management position in automotive electronics product design, development, vehicle electrical system integration, product assurance, validation testing and warranty problem solving as an E/E Reliability Manager and E/E Quality/Reliability/Durability (QRD) technical specialists at General Motors. James McLeish
- 29. 29 9000 Virginia Manor Rd. Suite 290, Beltsville MD 20705 | 301-474-0607 | www.dfrsolutions.com Who is DfR Solutions? The Industry Leader in Quality-Reliability- Durability of Electronics 0 Fastest Growing Companies in the Electronics Industry - Inc Magazine 2012 Global Technology Award Winner Best Design Verification Tool - Printed Circuit Design