Weekly Projects Update - w/e 17th February 2017
•
0 likes•587 views

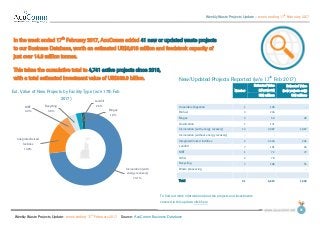
AcuComm's weekly projects update - w/e 17th February 2017. For more information on our latest projects, visit our website: acucomm.net

Recommended
More Related Content
More from AcuComm
More from AcuComm (20)
Recently uploaded
Recently uploaded (20)
Weekly Projects Update - w/e 17th February 2017
- 1. Weekly Waste Projects Update – week ending 17 th February 2017 Weekly Waste Projects Update: week ending 17 th February 2017 Source: AcuComm Business Database 01 2nd September 2016 New/Updated Projects Reported (w/e 17th Feb 2017) Number Estimated Value (all projects) Estimated Value (new projects only) US$ millionsUS$ millions Anaerobic Digestion 1 100 - Biofuel 3 244 - Biogas 3 59 28 Gasification 1 171 - Incineration (with energy recovery) 14 3,087 1,067 Incineration (without energy recovery) - - - Integrated/mixed facilities 2 2,533 202 Landfill 7 101 36 MBT 1 72 72 Other 2 78 - Recycling 7 168 55 Waste processing - - - Total 41 6,613 1,459 In the week ended 17th February 2017, AcuComm added 41 new or updated waste projects to our Business Database, worth an estimated US$6,613 million and feedstock capacity of just over 14.6 million tonnes. This takes the cumulative total to 4,741 active projects since 2013, with a total estimated investment value of US$363.9 billion. To find out more information about the projects and investments covered in this update, click here Incineration (with energy recovery) 73.1% Integrated/mixed facilities 13.9% MBT 4.9% Recycling 3.8% Landfill 2.5% Biogas 1.9% Est. Value of New Projects by Facility Type (w/e 17th Feb 2017)
- 2. Weekly Waste Projects Update – week ending 17 th February 2017 Weekly Waste Projects Update: week ending 17 th February 2017 Source: AcuComm Business Database 02 New/Updated Projects Reported (w/e 17th Feb 2017) Number Capacity (tonnes) MW Anaerobic Digestion 1 303,907 3 Biofuel 3 1,391,782 102 Biogas 3 158,520 12 Gasification 1 150,000 15 Incineration (with energy recovery) 14 6,152,176 535 Incineration (without energy recovery) - - - Integrated/mixed facilities 2 2,647,150 38 Landfill 7 2,469,317 8 MBT 1 201,340 14 Other 2 133,244 - Recycling 7 999,168 - Waste processing - - - Total 41 14,606,604 726 The total estimated feedstock capacity of projects reported on in the past week is just over 14.6 million tonnes. WtE incineration was the largest category, accounting for just under 6.2 million tonnes. The total estimated power generation from these projects was 726 MW. WtE incineration was the largest category, accounting for 535 MW. Incineration (with energy recovery) 42.1% Integrated/mixed facilities 18.1% Landfill 16.9% Others 22.9% Reported Capacity of Projects by Facility Type (w/e 17th Feb 2017) To find out more information about the projects and investments covered in this update, click here
- 3. Weekly Waste Projects Update – week ending 17 th February 2017 Weekly Waste Projects Update: week ending 17 th February 2017 Source: AcuComm Business Database 03 New Projects Reported by Waste Types (w/e 17th Feb 2017) Number Capacity (tonnes) MW Animal 2 205,597 3 Clinical - - - Construction/Demolition - - - e-Waste - - - Food 1 303,907 3 Gas 1 - 8 Glass - - - Hazardous - - - Heat - - - Industrial 1 150,000 15 Metals - - - MSW 24 11,378,305 503 Oil - - - Organic (general/unspecified) - - - Other - - - Paper - - - Plant biomass (non-waste) 1 340,000 15 Plant biomass (waste) 3 1,678,434 145 Plastics 1 34,702 - Radioactive - - - Rubber 1 33,426 - Sewage/wastewater 3 274,619 16 Wood 3 207,614 20 Total 41 14,606,604 726 MSW was the leading feedstock type reported on in the past week, accounting for an estimated 11.4 million tonnes, or 77.9% of the total. This was followed by waste plant biomass with 1.7 million tonnes. MSW 77.9% Plant biomass (waste) 11.5% Plant biomass (non- waste) 2.3% Others 8.3% Reported Capacity of Projects by Waste Type (w/e 17th Feb 2017) To find out more information about the projects and investments covered in this update, click here
- 4. Weekly Waste Projects Update – week ending 17 th February 2017 Weekly Waste Projects Update: week ending 17 th February 2017 Source: AcuComm Business Database 04 New/Updated Projects, Country Coverage, (w/e 17th Feb 2017) Projects USA 7 UK 4 Australia 4 Canada 3 Thailand 2 Sri Lanka 2 Poland 2 Norway 2 Others 15 Total 41 The leading country in the past week was the USA with seven projects. This was followed by the UK and Australia with four each. 7 4 4 3 2 2 2 2 0 0 0 15 0 2 4 6 8 10 12 14 16 USA UK Australia Canada Thailand SriLanka Poland Norway Others Reported Projects by Country (w/e 17th Feb 2017) To find out more information about the projects and investments covered in this update, click here
- 5. Weekly Waste Projects Update – week ending 17 th February 2017 Weekly Waste Projects Update: week ending 17 th February 2017 Source: AcuComm Business Database 05 Average Project Values by Facility Type US$ millions Anaerobic Digestion 25 Biofuel 118 Biogas 26 Gasification 144 Incineration (with energy recovery) 107 Incineration (without energy recovery) 52 Integrated/mixed facilities 195 Landfill 22 MBT 66 Other 81 Recycling 35 Waste processing 85 All Projects 77 Average Project Values by Feedstock Type US$ millions Animal 18 Clinical 30 Construction/Demolition 7 e-Waste 22 Food 20 Gas 76 Glass 14 Hazardous 68 Heat 39 Industrial 120 Metals 48 MSW 90 Oil 43 Organic (general/unspecified) 85 Other 55 Paper 74 Plant biomass (non-waste) 112 Plant biomass (waste) 79 Plastics 22 Radioactive 605 Rubber 38 Sewage/wastewater 44 Wood 88 All Projects 77 The average active waste project is worth US$77 million. There are naturally wide variations in average project value, due to the size, duration and complexity of different types of project. The figures on this page represent our latest estimates, based on data from 2013 to the current week. To find out more information about the projects and investments covered in this update, click here
- 6. Weekly Waste Projects Update – week ending 17 th February 2017 Weekly Waste Projects Update: week ending 17 th February 2017 Source: AcuComm Business Database 06 Top Five Projects, week ending 17th February 2017, by Estimated Value (US$ millions) Click the flag for more information on each project 1 Singapore 2,331 Development of an integrated waste management facility. 2 Australia 611 Development of a >100 MW WtE facility. 3 Denmark 587 New WtE plant to replace existing power plant. 4 Bahamas 400 Development of a 105 MW waste-to-energy plant. 5 Malaysia 242 Construction of a new waste-to-energy incinerator. Top Five Projects, week ending 17th February 2017, by Reported Waste Capacity (tonnes) 1 Singapore 2,646,250 Development of an integrated waste management facility. 2 China 1,752,000 Development of a WtE facility. 3 Australia 1,040,000 Development of a >100 MW WtE facility. 4 Spain 408,000 Proposed development of a biomass plant. 5 Denmark 400,000 New WtE plant to replace existing power plant. Top Five Projects, week ending 17th February 2017, by Reported Power Generation (MW) 1 Australia 140 Development of a >100 MW WtE facility. 2 Bahamas 105 Development of a 105 MW waste-to-energy plant. 3 Spain 50 Proposed development of a biomass plant. 4 Colombia 35 Construction of a bioethanol facility and cogeneration plant. 5 UK 19 Construction of a <19 MW WtE facility.
- 7. Weekly Waste Projects Update – week ending 17 th February 2017 Weekly Waste Projects Update: week ending 17 th February 2017 Source: AcuComm Business Database 07