SlideShare a Scribd company logo
1 of 16
Download to read offline
Copyright ©2012 eMarketer, Inc. All rights reserved.
Worldwide Social Network Ad Spending 	 2
North America 	 6
Western Europe 	 8
Eastern Europe 	 9
Asia-Pacific 	 10
Latin America 	 12
Middle East and Africa 	 13
Conclusions 	 14
Appendix: Worldwide Social Network
Ad Spending Forecast Methodology 	 14
Related eMarketer Reports 	 15
December 2012
Executive Summary: Worldwide social network ad spending is expected to reach nearly $9 billion in 2013, a 33%
increase over 2012. While Facebook will maintain a significant share of the 2013 total ($5.48 billion), that leaves
$3.5 billion to be spent on fast-rising Twitter, Chinese social networks, social games, LinkedIn and other sites.
144536
In our first-ever regional breakdown, North America leads with
a 49.7% share of worldwide social network ad spending in 2012,
followed by Western Europe, at 24.6%. However, Asia-Pacific
will surpass Western Europe in share next year, an indication of
both the strong inroads that Facebook is making in the region
as well the improved monetization strategies of Chinese and
other Asian social networks.
When it comes to Facebook, international revenues are
coming on fast. The US will have a 51% share of Facebook ad
revenues in 2012, but will fall to 49% in 2013. eMarketer expects
Facebook to draw $5.48 billion in ad revenues in 2013 and reach
$6.8 billion in 2014.
Twitter’s worldwide ad revenue will see substantial increases
in 2013, rising 89% to $545 million. As the company rolls out ad
products in international markets and expands its self-serve
ad platform, Twitter will take an increasing share of worldwide
social network ad spending.
This report highlights eMarketer’s forecast for social network ad
spending around the world. The projections, which run through
2014, cover North America, Asia-Pacific, Western Europe,
Eastern Europe, Latin America, and the Middle East and Africa,
including further details and breakouts for the US, Canada, the
UK and China.
billions and % change
Social Network Ad Spending Worldwide, 2010-2014
2010
$3.70
55.2%
2011
$5.12
38.5%
2012
$6.71
31.0%
2013
$8.93
33.1%
2014
$10.93
22.4%
Social network ad spending % change
Note: includes paid advertising appearing within social network sites, social
network games and social network applications; excludes spending by
marketers that goes toward developing or maintaining a social network
presence
Source: eMarketer, Sep 2012; confirmed and republished, Nov 2012
144536 www.eMarketer.com
Alison McCarthy
amccarthy@emarketer.com
Debra Aho Williamson
dwilliamson@emarketer.com
Contributors
Monica Peart, Martín Utreras, Haixia Wang
Worldwide Social Network
Ad Spending Forecast:
Robust Growth Set to Continue
Through 2014
Worldwide Social Network Ad Spending Forecast: Robust Growth Set to Continue Through 2014 Copyright ©2012 eMarketer, Inc. All rights reserved.	2
Worldwide Social Network
Ad Spending
Worldwide social network advertising spending is
expected to reach nearly $9 billion in 2013, up 33%
over 2012’s expected total of $6.71 billion. By 2014, ad
spending on social networks will approach the
$11 billion mark.
billions and % change
Social Network Ad Spending Worldwide, 2010-2014
2010
$3.70
55.2%
2011
$5.12
38.5%
2012
$6.71
31.0%
2013
$8.93
33.1%
2014
$10.93
22.4%
Social network ad spending % change
Note: includes paid advertising appearing within social network sites, social
network games and social network applications; excludes spending by
marketers that goes toward developing or maintaining a social network
presence
Source: eMarketer, Sep 2012; confirmed and republished, Nov 2012
144536 www.eMarketer.com
144536
2012 has been a year of intense scrutiny of the social network
advertising business, primarily because Facebook’s ad
revenues have not grown as rapidly as expected. eMarketer’s
current forecast for social network ad spending in 2012 is
$1 billion lower than our forecast published in February 2012,
mainly due to the Facebook slowdown.
But social networking is an activity that is gaining strength
around the world. eMarketer forecasts that there will be
1.63 billion monthly users in 2013, representing nearly one in
four people across the globe. Marketers will continue to invest
ad dollars to reach these people.
In Asia-Pacific, for example, marketers are making more serious
efforts to reach a growing social network user population.
Chinese social network Sina Weibo is seeing initial signs of
strong monetization as advertisers begin to engage with the
microblogging service’s 300 million-plus registered users.
Meanwhile,Twitter is flourishing in the UK,Japan and Brazil,and
the company is expanding its international advertising sales efforts,
allowing marketers new opportunities to reach its user base.
Among world regions, North America will claim the lion’s
share of social network ad expenditures, at $4.36 billion in
2013. North America’s share will be more than double that
of Asia-Pacific, the region that will have the second-highest
amount spent on social network advertising next year. North
America’s strong position among world regions is reflective of
the hold that social networking has on the populations of the
US and Canada and the fact that US businesses commonly
incorporate social network advertising into their budgets.
millions
Social Network Ad Spending Worldwide, by Region,
2010-2014
North America
Western Europe
Asia-Pacific
Eastern Europe
Latin America
Middle East & Africa
Worldwide
2010
$2,040.8
$1,013.8
$530.6
$61.6
$45.6
$4.3
$3,696.6
2011
$2,593.1
$1,302.6
$994.8
$119.3
$97.5
$11.3
$5,118.6
2012
$3,332.5
$1,648.3
$1,381.6
$167.8
$156.7
$21.0
$6,707.8
2013
$4,356.6
$1,990.9
$2,048.0
$250.0
$244.6
$37.1
$8,927.2
2014
$5,346.0
$2,280.4
$2,586.0
$307.7
$339.7
$68.5
$10,928.3
Note: includes display, search, video and other forms of paid advertising
appearing within social networks, social games and social applications;
excludes spending by marketers that goes toward developing or
maintaining social network profile pages or branded applications; numbers
may not add up to total due to rounding
Source: eMarketer, Nov 2012
147493 www.eMarketer.com
147493
The Middle East and Africa will experience the fastest growth
throughout the forecast period, though investments will remain
extremely low compared to the other regions. Latin America and
Eastern Europe will also see higher-than-average growth.
% change
Social Network Ad Spending Growth Worldwide, by
Region, 2010-2014
2010 2011 2012 2013 2014
Middle East & Africa 287.6% 163.2% 84.9% 76.9% 84.7%
Latin America 179.8% 114.1% 60.7% 56.1% 38.9%
Eastern Europe 92.4% 93.8% 40.6% 49.0% 23.1%
Asia-Pacific 99.3% 87.5% 38.9% 48.2% 26.3%
North America 37.2% 27.1% 28.5% 30.7% 22.7%
Western Europe 75.1% 28.5% 26.5% 20.8% 14.5%
Worldwide 55.2% 38.5% 31.0% 33.1% 22.4%
Note: includes display, search, video and other forms of paid advertising
appearing within social networks, social games and social applications;
excludes spending by marketers that goes toward developing or
maintaining social network profile pages or branded applications
Source: eMarketer, Nov 2012
147557 www.eMarketer.com
147557
Social network ad spending in North America will lose
some share to other regions during the forecast period,
but eMarketer expects that it will continue to account for
almost half of the global total through 2014. Asia-Pacific will
see its share increase from 20.6% in 2012 to 23.7% in 2014,
surpassing that of Western Europe. This will primarily be a
result of Facebook’s increased monetization efforts in the
region, but also a reflection that advertisers in China (where
Facebook does not have a presence) are starting to spend
more on advertising via local social networks.
Worldwide Social Network Ad Spending Forecast: Robust Growth Set to Continue Through 2014 Copyright ©2012 eMarketer, Inc. All rights reserved.	3
% of total
Social Network Ad Spending Share Worldwide, by
Region, 2010-2014
2010 2011 2012 2013 2014
North America 55.2% 50.7% 49.7% 48.8% 48.9%
Western Europe 27.4% 25.4% 24.6% 22.3% 20.9%
Asia-Pacific 14.4% 19.4% 20.6% 22.9% 23.7%
Eastern Europe 1.7% 2.3% 2.5% 2.8% 2.8%
Latin America 1.2% 1.9% 2.3% 2.7% 3.1%
Middle East & Africa 0.1% 0.2% 0.3% 0.4% 0.6%
Note: includes display, search, video and other forms of paid advertising
appearing within social networks, social games and social applications;
excludes spending by marketers that goes toward developing or
maintaining social network profile pages or branded applications; numbers
may not add up to 100% due to rounding
Source: eMarketer, Nov 2012
147561 www.eMarketer.com
147561
eMarketer expects social network ad spending to account for
7.3% of worldwide digital ad spending in 2013. Spending in North
America will remain higher than worldwide average due to the
more mature monetization efforts in the US, while marketers in
the Middle East and Africa, an immature market, will concentrate
very little of their digital ad spending on social network sites—
only 3% expected in 2013.
eMarketer measures digital ad spending based on the location
of the advertiser. Because there is a higher concentration of
advertisers in the US, many of which put greater efforts into social
network advertising, the US (and North America) are more heavily
weighted than other regions, adding to the disparity in revenue.
% of digital ad spending
Social Network Ad Spending Worldwide, by Region,
2010-2014
2010 2011 2012 2013 2014
North America 7.1% 7.5% 8.3% 9.5% 10.4%
Western Europe 4.6% 5.2% 6.0% 6.5% 6.8%
Asia-Pacific 3.0% 4.6% 5.1% 6.3% 6.9%
Eastern Europe 2.9% 4.1% 4.8% 6.1% 6.5%
Latin America 2.5% 4.0% 4.6% 5.9% 6.4%
Middle East & Africa 1.1% 1.9% 2.4% 2.9% 3.9%
Worldwide 5.1% 5.8% 6.4% 7.3% 7.8%
Note: includes display, search, video and other forms of paid advertising
appearing within social networks, social games and social applications;
excludes spending by marketers that goes toward developing or
maintaining social network profile pages or branded applications
Source: eMarketer, Nov 2012
147562 www.eMarketer.com
147562
Facebook will take 63% of the worldwide social network ad
spending pie in 2012, dipping slightly to 61.4% in 2013 as
LinkedIn and Twitter grow their shares. Twitter will see the
biggest jump in worldwide social network ad revenue share,
rising from 4.3% in 2012 to 7.4% in 2014.
Facebook will rebound slightly in 2014 as the combined
share of smaller social networks falls somewhat. But, overall,
Facebook’s share of the market has remained relatively
constant since 2011. If the company were to start operating in
China, its share might rise again—and substantially.
% of total
Social Network Ad Spending Share Worldwide,
by Venue, 2010-2014
2010 2011 2012 2013 2014
Facebook 50.7% 61.6% 63.1% 61.4%
Social games 7.5% 7.6% 8.1% 7.8%
Twitter 1.2% 2.7% 4.3% 6.1%
LinkedIn 2.1% 3.0% 3.9% 4.3%
Myspace* 7.2% 0.9% - -
Other 31.1% 24.1% 20.7% 20.5%
62.3%
7.5%
7.4%
4.7%
-
18.1%
Note: includes display, search, video and other forms of paid advertising
appearing within social networks, social games and social applications;
excludes spending by marketers that goes toward developing or
maintaining social network profile pages or branded applications; numbers
may not add up to 100% due to rounding; *effective in 2012, Myspace will
no longer be included in eMarketer's forecast
Source: eMarketer, Nov 2012
147600 www.eMarketer.com
147600
Facebook Ad Revenues Worldwide
While internet users in the US fueled Facebook’s meteoric rise,
foreign expansion is driving the company’s growth, both in users
and in revenue. eMarketer expects Facebook to draw $5.48 billion
in worldwide ad revenues in 2013 and pull in $6.8 billion in 2014.
billions and % change
Facebook Ad Revenues Worldwide, 2010-2014
2010
$1.88
146.3%
2011
$3.15
68.2%
2012
$4.23
34.1%
2013
$5.48
29.5%
2014
$6.81
24.2%
Facebook ad revenues % change
Note: paid advertising only; excludes spending by marketers that goes
toward developing or maintaining a Facebook presence
Source: eMarketer, Sep 2012
144542 www.eMarketer.com
144542
eMarketer has lowered its expectations for Facebook worldwide
ad revenues in 2012 from its February 2012 estimate after the
company underperformed market expectations in both Q1 and
Q2. eMarketer now expects that ad revenue will grow 34% in
2012, compared with the earlier prediction of 60.5%.
In the first nine months of 2012, Facebook’s ad revenue grew
33%, according to the company’s Q3 2012 earnings report.
The US will represent 51% of Facebook ad revenue in 2012,
but its share is expected to fall to 49% in 2013 and 47% in
2014, eMarketer forecasts. Much of Facebook’s user growth
is happening outside the US; in Q3 2012, the primary sources
Worldwide Social Network Ad Spending
Worldwide Social Network Ad Spending Forecast: Robust Growth Set to Continue Through 2014 Copyright ©2012 eMarketer, Inc. All rights reserved.	4
of new growth were Brazil, India and Japan, Facebook said.
However, Facebook faces challenges in monetizing these
users, particularly those in developing markets who may be of
lower value to marketers.
In the first nine months of 2012, 51% of Facebook’s total revenue,
including both ads and payments, came from companies based
in the US, the company said in its Q3 2012 earnings report.
(Facebook does not break out the percentage of ad revenue that
comes from companies in the US, but eMarketer’s assumption is
that the total revenue split and the ad revenue split are similar.)
Ads will continue to diminish as a portion of Facebook’s total
revenue, but the rate of decline is slowing. Advertising fell
from 95% of revenue in 2010 to 85% in 2011, according to
eMarketer. In 2012, ads will account for an estimated 83.9% of
total revenue. Facebook Payments revenue growth is slowing,
mainly because social gaming company Zynga, the primary
source of Payments revenue, has faced its own challenges. In
Q3 2012, Facebook reported that Zynga accounted for 7% of
Facebook’s total revenue, down from 12% in Q3 2011.
millions and % of total
Facebook Revenues Worldwide, by Source, 2009-2013
Advertising*
Facebook Payments and
other revenue
Total
Advertising % of total
2009
$761
$16
$777
98.0%
2010
$1,875
$99
$1,974
95.0%
2011
$3,154
$557
$3,711
85.0%
2012
$4,232
$811
$5,042
83.9%
2013
$5,478
$1,122
$6,600
83.0%
Note: numbers may not add up to total due to rounding; *paid advertising
only; excludes spending by marketers that goes toward developing or
maintaining a Facebook presence
Source: eMarketer, Sep 2012
144543 www.eMarketer.com
144543
Twitter Ad Revenues Worldwide
Twitter will generate more than $545 million in worldwide ad
revenue in 2013,up 89% from 2012’s expected total of $288 million.
eMarketer predicts that by 2014Twitter ad revenues will surpass
the $800 million mark.
millions and % change
Twitter Ad Revenues Worldwide, 2010-2014
2010
$44.6
2011
$139.5
213.1%
2012
$288.3
106.7%
2013
$545.2
89.1%
2014
$807.5
48.1%
Twitter ad revenues % change
Note: paid advertising only; excludes spending by marketers that goes
toward developing or maintaining a Twitter presence
Source: eMarketer, Sep 2012
144546 www.eMarketer.com
144546
Twitter’s ad revenue for 2012 has grown faster than eMarketer’s
earlier expectations and so our forecast has been revised upward
from the February 2012 estimate of $260 million.
This year, the company has steadily grown its monetization
efforts, adding new features to its ad products and expanding
sales efforts in international markets, which now make up 70%
of Twitter’s reported user base. Key revenue drivers for the
company in 2013 and beyond include:
■■ The rollout of Twitter’s self-serve advertising platform, aimed
at small and midsize businesses
■■ The launch of a Twitter Ads API, expected in late 2012 or
early 2013
■■ Increased focus on selling ads in international markets,
including Japan, the UK and Brazil
■■ Better forms of ad targeting, including messages aimed at
specific mobile devices, user geographies and interests
eMarketer forecasts that 90% of Twitter’s ad revenues will
come from the US in 2012, but that percentage is expected to
fall to 83% in 2013 and 79% in 2014, as Twitter’s international
ad sales pick up steam.
LinkedIn Ad Revenues Worldwide
Advertising is a significant contributor to LinkedIn’s business,
but the company also has strong revenue streams from
recruitment and premium subscription products, which make
it less dependent on ads than Facebook or Twitter.
As a result, LinkedIn has focused less on innovating new
types of advertising and more on building tools for marketers
to reach its business-oriented audience, such as branded
communities, targeted status updates and sponsorships.
Worldwide Social Network Ad Spending
Worldwide Social Network Ad Spending Forecast: Robust Growth Set to Continue Through 2014 Copyright ©2012 eMarketer, Inc. All rights reserved.	5
LinkedIn’s worldwide ad revenue will reach $381 million in 2013,
up 46.2% from 2012.Ad revenues have grown faster in 2012
than earlier predicted, and eMarketer has revised its forecast
upward for the year to $260 million, from the $226 million
forecast in February 2012.
millions and % change
LinkedIn Ad Revenues Worldwide, 2010-2014
2010
$79.2
106.8%
2011
$155.9
96.8%
2012
$260.7
67.2%
2013
$381.1
46.2%
2014
$513.1
34.6%
LinkedIn ad revenues % change
Note: figures represent revenue from LinkedIn's Marketing Solutions
business segment
Source: eMarketer, Sep 2012
144548 www.eMarketer.com
144548
For the year through Q3 2012, LinkedIn had $175.1 million in
ad revenue, representing 26% of total revenues in the period.
eMarketer estimates that 64% of LinkedIn’s ad revenue will
come from the US in 2012, falling to 60% in 2014.
Social Game Ad Spending Worldwide
eMarketer expects that worldwide social gaming ad spending
will rise 28.6% in 2013 to $695 million and reach $824 million
in 2014. Non-US markets will account for 59% of social game
spending next year.
millions
Social Game Ad Spending, US vs. Non-US, 2010-2014
2010
$111.6
$167.4
$278.9
2011
$135.4
$251.5
$387.0
2012
$210.9
$329.9
$540.8
2013
$285.1
$410.2
$695.3
2014
$371.0
$453.4
$824.4
US Non-US
Note: paid advertising only; excludes spending by marketers that goes
toward developing or maintaining branded social games; numbers may not
add up to total due to rounding
Source: eMarketer, Sep 2012
144551 www.eMarketer.com
144551
Zynga, the most widely known social game company, has
struggled in 2012, as its new games have not taken off and users
have started to spend less money buying virtual items within
games. However, advertising revenue is becoming more robust,
propping up the company’s fortunes. Zynga’s ad revenue reached
$100.2 million in the first nine months of 2012, up 113% from
$47.1 million in the first nine months of 2011.
Zynga is just one company in the social game space, however,
and consumer interest in social gaming remains relatively high
in international markets, particularly in Asia-Pacific.
In Japan, for example, mobile social game network Gree has
had steady growth in ad sales and has teamed up with a
French mobile ad company to expand its mobile ad business.
Gree also launched a global platform, expanding the reach
of its games to 169 countries, including the US. Other mobile
game companies in Asia-Pacific are seeking to expand their
games into the US, too, with the intention of earning revenue
from both virtual goods and advertising.
Worldwide Social Network Ad Spending
Worldwide Social Network Ad Spending Forecast: Robust Growth Set to Continue Through 2014 Copyright ©2012 eMarketer, Inc. All rights reserved.	6
North America
Given that Facebook, Twitter and LinkedIn all
started in the US, it is not surprising that North
America accounts for such a large percentage of
the worldwide social network ad market. Spending
in North America is expected to reach $3.3 billion in
2012 and rise 30.7% to $4.4 billion in 2013.
The percentage of digital ad budgets going toward social
networks will reach 9.5% next year, up from 8.3% in 2012, as
advertisers fund campaigns to connect with audiences through
social networks on both desktop and mobile platforms.
billions, % change and % of digital ad spending
Social Network Ad Spending in North America,
2010-2014
2010
$2.04
37.2%
7.1%
2011
$2.59
27.1%
7.5%
2012
$3.33
28.5%
8.3%
2013
$4.36
30.7%
9.5%
2014
$5.35
22.7%
10.4%
Note: includes display, search, video and other forms of paid advertising
appearing within social networks, social games and social applications;
excludes spending by marketers that goes toward developing or
maintaining social network profile pages or branded applications
Source: eMarketer, Nov 2012
147569 www.eMarketer.com
Social network ad spending
% change % of digital ad spending
147569
With nearly 175 million social network users this year, North
America provides advertisers with the third-largest regional
audience after Asia-Pacific and Latin America. Marketers
in North America will spend nearly $24 on social network
advertising per social network user in 2013, an amount much
higher than in other regions.
Social Network Ad Spending per Social Network User
in North America, 2010-2014
2010
$13.63
16.0%
2011
$15.82
16.0%
2012
$19.08
20.6%
2013
$23.95
25.6%
2014
$28.26
18.0%
% change
Note: includes display, search, video and other forms of paid advertising
appearing within social networks, social games and social applications;
excludes spending by marketers that goes toward developing or
maintaining social network profile pages or branded applications
Source: eMarketer, Nov 2012
147570 www.eMarketer.com
Social network ad spending per social network user
147570
US
As the world’s largest advertising market and home base for
Facebook, the US dominates social network ad spending.
Spending will surpass the $4 billion mark by the end of 2013
and climb to more than $5 billion in 2014.
Facebook is the key player, accounting for 68.8% of all social
network revenues in the US in 2012.
Growth in 2013 will be slightly higher than in 2012, as Facebook
and Twitter expand their mobile advertising businesses and as
new products, such as the Facebook Exchange real-time bidding
platform and Twitter’s self-serve ad platform, expand.
eMarketer predicts social networks will account for 9.6% of total
digital ad spending in the US in 2013, rising to 10.5% in 2014.
Social network ad spending per social network user will reach
nearly $20 in 2012 and then grow more than 25% to nearly $25
per user in 2013.
Worldwide Social Network Ad Spending Forecast: Robust Growth Set to Continue Through 2014 Copyright ©2012 eMarketer, Inc. All rights reserved.	7
US Social Network Ad Spending per Social
Network User, 2010-2014
2010
$14.31
2011
$16.55
2012
$19.88
2013
$24.92
2014
$29.50
Note: includes display, search, video and other forms of paid advertising
appearing within social networks, social games and social applications;
excludes spending by marketers that goes toward developing or
maintaining social network profile pages or branded applications
Source: eMarketer, Nov 2012
147582 www.eMarketer.com
% change
Social network ad spending per social network user
14.5% 15.7%
20.1%
25.4%
18.4%
147582
For more on social network ad revenues in the US,
including additional forecasts for Facebook, Twitter,
LinkedIn and social games, see eMarketer’s October 2012
report, “US Ad Spending Forecast: Fall 2012 Update.”
Canada
eMarketer predicts that two-thirds of Canada’s internet users,
or 17.7 million people, will use social networks in 2013. That
year, marketers will spend $264 million on advertising to these
users. Spending has risen steadily since 2011 and percentage
gains are expected to reach 35% in 2013.
At 8.2% in 2013, social network ad spending as a percentage
of total digital ad spending is slightly lower in Canada than
in the US, most likely because consumers in Canada are
somewhat less apt than US consumers to visit social networks.
However, social networks’ share of ad spending is growing
and will reach 8.9% in 2014.
millions, % change and % of digital ad spending
Social Network Ad Spending in Canada, 2010-2014
2010
$115.0
52.4%
5.1%
2011
$146.9
27.8%
5.6%
2012
$195.8
33.2%
6.7%
2013
$264.3
35.0%
8.2%
2014
$310.1
17.3%
8.9%
Note: includes display, search, video and other forms of paid advertising
appearing within social networks, social games and social applications;
excludes spending by marketers that goes toward developing or
maintaining social network profile pages or branded applications
Source: eMarketer, Nov 2012
147595 www.eMarketer.com
Social network ad spending
% change % of digital ad spending
147595
Marketers will spend $14.95 on social network advertising per
social network user in 2013, a gain of 29% over 2012’s figure.
However, growth will taper off in 2014, when social network
ad spending per user is expected to reach $16.80—only
12% higher than 2013’s total. The amount spent per user will
be substantially lower than in the US, where advertisers are
expected to shell out $29.50 per user in 2014.
Social Network Ad Spending per Social Network User
in Canada, 2010-2014
2010
$7.61
37.1%
2011
$9.10
19.7%
2012
$11.58
27.2%
2013
$14.95
29.1%
2014
$16.80
12.4%
Note: includes display, search, video and other forms of paid advertising
appearing within social networks, social games and social applications;
excludes spending by marketers that goes toward developing or
maintaining social network profile pages or branded applications
Source: eMarketer, Nov 2012
147596 www.eMarketer.com
% change
Social network ad spending per social network user
147596
North America
Worldwide Social Network Ad Spending Forecast: Robust Growth Set to Continue Through 2014 Copyright ©2012 eMarketer, Inc. All rights reserved.	8
Western Europe
With a social network user base expected to total
158.8 million in 2013,Western Europe has a
sophisticated audience that marketers have paid a fair
amount of attention to. Facebook is the most popular
social network in the region, visited by nearly 83% of
Western Europe’s social network users in 2012, and
many advertisers have established a presence on the
site to engage with these consumers.
Social network ad expenditures in Western Europe will near the
$2 billion mark next year, according to eMarketer estimates.The
majority of this spending will come from the UK and Germany,
which have the largest social network user populations in
Western Europe. Growth in the region has slowed since 2010,
and will continue to taper throughout the forecast period, but will
remain in the double digits through 2014.
Social networks’ share of total digital ad spending in Western
Europe is expanding, but at a slower pace relative to North
America. eMarketer expects social network ad spending to
account for 6% of Western Europe’s total digital ad spending
this year. By the end of 2014, that share will have risen by only
an eighth of a percentage point. eMarketer believes that there
will be no major shifts from other ad formats to social network
advertising through 2014.
millions, % change and % of digital ad spending
Social Network Ad Spending in Western Europe,
2010-2014
2010
$1,013.8
75.1%
4.6%
2011
$1,302.6
28.5%
5.2%
2012
$1,648.3
26.5%
6.0%
2013
$1,990.9
20.8%
6.5%
2014
$2,280.4
14.5%
6.8%
Note: includes display, search, video and other forms of paid advertising
appearing within social networks, social games and social applications;
excludes spending by marketers that goes toward developing or
maintaining social network profile pages or branded applications
Source: eMarketer, Nov 2012
147566 www.eMarketer.com
Social network ad spending
% change % of digital ad spending
147566
Social network ad spending per social network user in
Western Europe will come in at $12.54 in 2013, according to
eMarketer forecasts, 10% higher than 2012’s spend of $11.39.
Marketers in Germany and the UK will spend more per user
than those in France, Italy and Spain and will help raise the
regional average.
Social Network Ad Spending per Social Network User
in Western Europe, 2010-2014
2010
$9.25
37.7%
2011
$10.07
8.8%
2012
$11.39
13.1%
2013
$12.54
10.1%
2014
$13.41
7.0%
Social network ad spending per social network user
% change
Note: includes display, search, video and other forms of paid advertising
appearing within social networks, social games and social applications;
excludes spending by marketers that goes toward developing or
maintaining social network profile pages or branded applications
Source: eMarketer, Nov 2012
147568 www.eMarketer.com
147568
UK
The UK has the largest population of Facebook users in
Western Europe and the second-largest social network
audience in the region after Germany. UK social network users
are known to be a highly engaged group, yet UK advertisers
have been somewhat slower than those in the US to gravitate
toward social networks.
eMarketer expects marketers in the UK to invest $646 million
in social network advertising in 2013, compared to $4 billion
in the US. In the UK, 6.7% of total digital ad spending will go
toward social networks next year, compared to 9.6% in the US.
Worldwide Social Network Ad Spending Forecast: Robust Growth Set to Continue Through 2014 Copyright ©2012 eMarketer, Inc. All rights reserved.	9
millions, % change and % of digital ad spending
UK Social Network Ad Spending, 2010-2014
2010
$343.6
58.3%
5.2%
2011
$463.0
34.7%
6.0%
2012
$553.1
19.5%
6.3%
2013
$646.4
16.9%
6.7%
2014
$738.6
14.3%
6.9%
Note: includes display, search, video and other forms of paid advertising
appearing within social networks, social games and social applications;
excludes spending by marketers that goes toward developing or
maintaining social network profile pages or branded applications
Source: eMarketer, Nov 2012
147577 www.eMarketer.com
Social network ad spending
% change % of digital ad spending
147577
The UK does parallel the US in social network ad spending per
social network user, as the two countries have similar social
ad cost per thousands (CPMs) and are monetizing at a similar
rate. eMarketer predicts that advertisers will spend $23.30 on
each social network user in the UK in 2013, just $1.60 less than
the average amount spent in the US.
UK Social Network Ad Spending per Social
Network User, 2010-2014
2010
$15.78
37.7%
2011
$19.34
2012
$21.37
2013
$23.34
2014
$25.17
7.8%
Note: figures include display, video, search and other forms of paid
advertising appearing within social networks, social games and social
applications; does not include spending by marketers that goes toward
developing or maintaining social network profile pages or branded
applications
Source: eMarketer, Nov 2012
147578 www.eMarketer.com
% change
Social network ad spending per social network user
22.6%
10.5%9.2%
147578
Eastern Europe
Social network advertising in Eastern Europe is still in a
nascent stage, but is growing at a fast pace. eMarketer
expects spending will nearly double between 2012 and
2014, from $167.8 million to $307.7 million.
As spending grows, social network advertising will become a
bigger piece of the digital ad spending pie, making up 6.5% of
the region’s total in 2014, up from 4.8% this year.
millions, % change and % of digital ad spending
Social Network Ad Spending in Eastern Europe,
2010-2014
2010
$61.6
92.4%
2.9%
2011
$119.3
93.8%
4.1%
2012
$167.8
40.6%
4.8%
2013
$250.0
49.0%
6.1%
2014
$307.7
23.1%
6.5%
Note: includes display, search, video and other forms of paid advertising
appearing within social networks, social games and social applications;
excludes spending by marketers that goes toward developing or
maintaining social network profile pages or branded applications
Source: eMarketer, Nov 2012
147573 www.eMarketer.com
Social network ad spending
% change % of digital ad spending
147573
With more than 40 million users, the social network VKontakte
maintains a stronghold in Eastern Europe and Russia.
VKontakte (also known simply as VK) not only adopts and
adjusts Facebook’s functionalities to appeal to the Eastern
European audience, but offers users a much greater span of
content options within the site, such as the ability to watch
movies or listen to full albums.
But Facebook is expanding rapidly in the region. eMarketer
estimates that more than half of all social network users in
Eastern Europe will be Facebook users by the end of 2012,
a tally that should rise to 62% by 2014. Russia, with 51.8
million social network users in 2012, is the sixth-largest social
networking country in the world this year, though it has much
lower Facebook penetration than Eastern Europe as a whole.
Despite the increasing presence of social networks in Eastern
Europe, ad spending per social network user is very low.
Local social networks in Eastern Europe do not monetize
users on the same level as Facebook or Twitter. Lower wages
Western Europe
Worldwide Social Network Ad Spending Forecast: Robust Growth Set to Continue Through 2014 Copyright ©2012 eMarketer, Inc. All rights reserved.	10
among the general population have affected spending as well,
causing lessening demand for goods and services. eMarketer
expects that in 2012, marketers will spend just $1.15 on
advertising per social network user.
Social Network Ad Spending per Social Network User
in Eastern Europe, 2010-2014
2010
$0.54
57.5%
2011
$0.92
68.6%
2012
$1.15
25.5%
2013
$1.53
32.4%
2014
$1.71
12.4%
Note: includes display, search, video and other forms of paid advertising
appearing within social networks, social games and social applications;
excludes spending by marketers that goes toward developing or
maintaining social network profile pages or branded applications
Source: eMarketer, Nov 2012
147574 www.eMarketer.com
% change
Social network ad spending per social network user
147574
Asia-Pacific
The Asia-Pacific region has a massive social network
user base and a broad landscape of social networks
for marketers to work with. From social sites such
as Tencent Qzone and Sina Weibo in China to the
increasing popularity of Facebook and Twitter in
countries like Japan, India and Indonesia, the options
are extensive.
Social network ad spending in Asia-Pacific is set to increase
48% in 2013 and pass the $2 billion mark, to become the
region with the second-highest total that year. Japan and
China, which have more sophisticated social network
economies than other countries in the region, are helping to
drive Asia-Pacific’s growth. Marketers there want to reach
consumers who have shown a strong propensity to interact
with brands on social media sites. According to a Q2 2012
InSites Consulting study, 66% of social network users in China
and 56% of those in Japan followed a brand on a social media
site—both greater than the US’s 53%.
Social network ad spending will account for just over 6% of
total digital ad spending in Asia-Pacific in 2013.
millions, % change and % of digital ad spending
Social Network Ad Spending in Asia-Pacific, 2010-2014
2010
$530.6
99.3%
3.0%
2011
$994.8
87.5%
4.6%
2012
$1,381.6
38.9%
5.1%
2013
$2,048.0
48.2%
6.3%
2014
$2,586.0
26.3%
6.9%
Social network ad spending
% change % of digital ad spending
Note: includes display, search, video and other forms of paid advertising
appearing within social networks, social games and social applications;
excludes spending by marketers that goes toward developing or
maintaining social network profile pages or branded applications
Source: eMarketer, Nov 2012
147564 www.eMarketer.com
147564
Spending per user is quite low in the region, attributable to
the enormous user base of 616 million, as well as the fact
that some Asia-Pacific countries, such as India and Indonesia,
have immature digital advertising economies. Spending per
user will be much higher in countries with more developed
monetization platforms in place, such as Australia and Japan.
Eastern Europe
Worldwide Social Network Ad Spending Forecast: Robust Growth Set to Continue Through 2014 Copyright ©2012 eMarketer, Inc. All rights reserved.	11
Social Network Ad Spending per Social Network User
in Asia-Pacific, 2010-2014
2010
$1.37
52.5%
2011
$2.02
47.1%
2012
$2.24
11.3%
2013
$2.75
22.4%
2014
$3.03
10.3%
Social network ad spending per social network user
% change
Note: includes display, search, video and other forms of paid advertising
appearing within social networks, social games and social applications;
excludes spending by marketers that goes toward developing or
maintaining social network profile pages or branded applications
Source: eMarketer, Nov 2012
147565 www.eMarketer.com
147565
China
China is the world’s largest social networking market, with
307.5 million users in 2012, nearly double the US user base.
Neither Facebook nor Twitter has an official presence there,
though, leaving marketers’ advertising spend to collect
among homegrown networks such as Sina Weibo, Renren and
Tencent’s various social platforms.
Marketers in China will spend $612.8 million on social network
advertising in 2013, or 6.4% of total digital ad spending in the
country. The market will experience rapid growth throughout
the forecast period, including a 51.3% gain next year.
millions, % change and % of digital ad spending
Social Network Ad Spending in China, 2010-2014
2010
$148.0
128.4%
4.0%
2011
$233.1
57.5%
4.4%
2012
$405.1
73.8%
5.5%
2013
$612.8
51.3%
6.4%
2014
$789.5
28.8%
6.5%
Note: includes display, search, video and other forms of paid advertising
appearing within social networks, social games and social applications;
excludes spending by marketers that goes toward developing or
maintaining social network profile pages or branded applications
Source: eMarketer, Nov 2012
147597 www.eMarketer.com
Social network ad spending
% change % of digital ad spending
147597
Unlike in the US, where Facebook is the dominant player, internet
users in China tend to join multiple social networks, affording
marketers more options to reach consumers.According to InSites
Consulting, 53% of social network users in China use three or
more such sites, compared to 33% in the US.
Social network ad spending per user is quite low in China.
eMarketer predicts that in 2013, marketers in China will only
spend $1.67 on each social network user.Though this is a fraction
of what is spent per user in other markets, China has so many
social network users that it adds up to significant total revenue.
Social Network Ad Spending per Social Network User
in China, 2010-2014
2010
$0.71
71.5%
2011
$0.91
27.1%
2012
$1.32
44.9%
2013
$1.67
27.0%
2014
$1.90
13.8%
Note: includes display, search, video and other forms of paid advertising
appearing within social networks, social games and social applications;
excludes spending by marketers that goes toward developing or
maintaining social network profile pages or branded applications
Source: eMarketer, Nov 2012
147598 www.eMarketer.com
% change
Social network ad spending per social network user
147598
Asia-Pacific
Worldwide Social Network Ad Spending Forecast: Robust Growth Set to Continue Through 2014 Copyright ©2012 eMarketer, Inc. All rights reserved.	12
Latin America
More than two out of three internet users in Latin
America are expected to be social network users in
2012, according to eMarketer estimates. Facebook is
the most popular, but Twitter and Google+ are rising,
especially in Brazil.
Although the region’s social network user population is
growing rapidly, Latin America is uneven in terms of internet
access. Many people access social networks via their
mobile phones, where social network advertising is not yet
ubiquitous. These reasons, combined with marketers’ reliance
on traditional advertising formats, have made marketers
in Latin America slow to engage users through social
network advertising.
With $245 million in social network ad spending in 2013, or
5.9% of the region’s total digital ad spending, Latin America
will remain second to last globally when it comes to social
spending, above only the Middle East and Africa. The market is
expected to grow 39% to reach $340 million in 2014.
millions, % change and % of digital ad spending
Social Network Ad Spending in Latin America,
2010-2014
2010
$45.6
179.8%
2.5%
2011
$97.5
114.1%
4.0%
2012
$156.7
60.7%
4.6%
2013
$244.6
56.1%
5.9%
2014
$339.7
38.9%
6.4%
Note: includes display, search, video and other forms of paid advertising
appearing within social networks, social games and social applications;
excludes spending by marketers that goes toward developing or
maintaining social network profile pages or branded applications
Source: eMarketer, Nov 2012
147571 www.eMarketer.com
Social network ad spending
% change % of digital ad spending
147571
eMarketer estimates that social network ad spending per
social network user will increase from $0.89 in 2012 to $1.51
in 2014, but this is an extremely low investment compared to
other regions.
Social Network Ad Spending per Social Network User
in Latin America, 2010-2014
2010
$0.37
119.9%
2011
$0.66
77.2%
2012
$0.89
35.6%
2013
$1.21
36.3%
2014
$1.51
24.5%
Note: includes display, search, video and other forms of paid advertising
appearing within social networks, social games and social applications;
excludes spending by marketers that goes toward developing or
maintaining social network profile pages or branded applications
Source: eMarketer, Nov 2012
147572 www.eMarketer.com
% change
Social network ad spending per social network user
147572
One market that stands out in Latin America is Brazil. eMarketer
expects that advertisers in Brazil will spend much more on
social network advertising than in countries such as Argentina
and Mexico. Brazil’s social network audience is largely urban
and upwardly mobile, and the country is investing heavily in
tech infrastructure, all of which will contribute to a healthy social
network economy.
Worldwide Social Network Ad Spending Forecast: Robust Growth Set to Continue Through 2014 Copyright ©2012 eMarketer, Inc. All rights reserved.	13
Middle East and Africa
The Middle East andAfrica,combined,have the lowest
social network ad spending among the major world
regions.eMarketer expects just $37 million to be spent in
2013,representing 3% of digital ad spending in the region.
millions, % change and % of digital ad spending
Social Network Ad Spending in the Middle East &
Africa, 2010-2014
2010
$4.3
287.6%
1.1%
2011
$11.3
163.2%
1.9%
2012
$21.0
84.9%
2.4%
2013
$37.1
76.9%
2.9%
2014
$68.5
84.7%
3.9%
Note: includes display, search, video and other forms of paid advertising
appearing within social networks, social games and social applications;
excludes spending by marketers that goes toward developing or
maintaining social network profile pages or branded applications
Source: eMarketer, Nov 2012
147575 www.eMarketer.com
Social network ad spending
% change % of digital ad spending
147575
Social network ad spending per social network user will be
just $0.20 next year.
Social Network Ad Spending per Social Network User
in the Middle East & Africa, 2010-2014
2010
$0.05
179.8%
2011
$0.10
96.7%
2012
$0.14
40.3%
2013
$0.20
43.2%
2014
$0.33
59.5%
Note: includes display, search, video and other forms of paid advertising
appearing within social networks, social games and social applications;
excludes spending by marketers that goes toward developing or
maintaining social network profile pages or branded applications
Source: eMarketer, Nov 2012
147576 www.eMarketer.com
% change
Social network ad spending per social network user
147576
Although the ad dollars are low, social network usage in
the Middle East and Africa is quite high among web users.
eMarketer estimates that 181 million people in the region will
use a social network in 2013, representing three out of four
of its internet users. This strong penetration rate makes social
networks an ideal place for marketers to reach consumers.
Moreover, the Middle East and Africa have illustrated how
social networks can help people unite to create change and
influence offline behavior.
That said, internet access in the region is very limited outside
of urban centers, and many users access social networks
via mobile devices, where the advertising options are more
limited. However, with total digital ad spending forecast to rise
47.4% in 2013, to $1.24 billion, there is a chance that social
networks will siphon off some of that growth.
Worldwide Social Network Ad Spending Forecast: Robust Growth Set to Continue Through 2014 Copyright ©2012 eMarketer, Inc. All rights reserved.	14
Conclusions
Ad spending on social networks will continue to
grow at a rapid pace. Social network users are only going
to increase in number. Marketers will continue to follow
social networkers as users connect with each other around
the world.
The majority of worldwide social network ad spending
will be invested in Facebook. However, Twitter, LinkedIn,
social games and other social networks will make up a large
portion of spending. Revenues will increase as these sites
bolster their international audiences.
Social network ad spending is markedly diverse among
the different regions. While North America leads in spending
and Western Europe and Asia-Pacific follow, marketers in Eastern
Europe, Latin America, and the Middle East and Africa still spend
very little on social network advertising.
North America will continue to account for the bulk of
worldwide social network ad spending through 2014.
Though the US will slowly lose share of Facebook,Twitter and
LinkedIn worldwide ad revenue throughout the forecast period as
international audiences grow, the region’s strong hold on social
network spending illustrates just how common social network
advertising has become for marketers in the US and Canada.
Asia-Pacific is making rapid advances in social
network advertising. Social network ad spending in the
region, driven by efforts in Japan and China, is set to surpass
Western Europe in 2013. China’s microblogging communities
in particular are beginning to make inroads at monetizing
their audiences.
Appendix: Worldwide Social
Network Ad Spending Forecast
Methodology
eMarketer forecasts regional social network ad spending
based on the geographic location of the advertiser.
By examining the reported revenues from major social
network companies, the long-term patterns of revenue
growth or loss, and viewing those figures through the lens of
current ad spending trends and marketers’ future intentions,
eMarketer is able to develop its projections.
Major players. We begin to estimate the size and growth
curve of the social network ad market by tracking the reported
revenues from Facebook and LinkedIn, which are public
companies. We also analyze revenue at Twitter, as well as
revenues at several dozen international social networks, social
game developers and social app companies.
Other research firms. Several researchers project social
network or social media ad revenues and/or revenues for
individual social network companies. eMarketer aggregates
these projections; the details behind how other researchers
come to their numbers help to inform eMarketer’s
forecasting process.
Other available data. We consider data on marketer usage,
consumer usage and incomes by region, ad impressions, and
ad pricing by region and country as part of our model.
Interviews with industry executives. We conduct
interviews with executives at ad agencies, marketers and
social networks to gain perspective on the development of the
social network advertising business as a whole, as well as the
revenues for individual companies.
Worldwide Social Network Ad Spending Forecast: Robust Growth Set to Continue Through 2014 Copyright ©2012 eMarketer, Inc. All rights reserved.	15
Related eMarketer Reports
UK Digital Advertising: Spending and Trends
US Ad Spending Forecast: Fall 2012 Update
The Global Media Intelligence Report
Digital Ad Spending in Mexico: Advertising Giants
Finally Join the Pioneers
China Digital Media: Usage and Marketing Trends
Editorial and
Production Contributors
Nicole Perrin	 Associate Editorial Director
Cliff Annicelli	 Senior Copy Editor
Emily Adler	 Copy Editor
Dana Hill 	 Director of Production
Joanne DiCamillo	 Senior Production Artist
Stephanie Gehrsitz	 Production Artist
Allie Smith 	 Director of Charts
The world’s go-to source for information on
digital marketing, media and commerce.
In the fast-paced digital world, it is neither prudent nor professional to
make business decisions based solely on a single source. eMarketer helps
companies minimize risk and maximize opportunity by providing…
COLLECTIVE WISDOM
COVERAGE
See all aspects of what is happening today in digital marketing, media
and commerce.
COLLECTION 	
Information is gathered from thousands of research sources around the globe
and hundreds of interviews with industry professionals a month.
CURATION 	
eMarketer sifts through the clutter, vets data for accuracy and distills information
to its essential intelligence – to save you time.
COMPARISON 	
Side-by-side source comparison charts display all relevant information on a
topic in one place.
CONTEXT 	
Focused, clear and concise, eMarketer reports provide a quick, complete picture
of fast-changing digital trends to make sense of complex issues.
CONVENIENCE
The information you need is accessible 24/7 from your PC, laptop, tablet or
smartphone—and downloadable in PDF, Excel, JPEG or PowerPoint formats.
CONFIDENCE 	
For 15 years, eMarketer has been recognized as the standard for media coverage
of the digital world—cited more than 4,000 times in the New York Times and
Wall Street Journal alone—and relied on by major brands and advertising
agencies around the globe.
COMPETITIVENESS
No one in business wants to be surprised, so see the trends coming and make
certain your organization always has the latest, most accurate and comprehensive
digital information available—with an eMarketer Corporate Subscription.
To schedule a conversation or customized
demonstration, go to eMarketer.com or call 212-763-6010

More Related Content

What's hot

6 Things You Need to Know About 2016 Media Trends
6 Things You Need to Know About 2016 Media Trends6 Things You Need to Know About 2016 Media Trends
6 Things You Need to Know About 2016 Media TrendsJohn Schaefer
 
What it Takes to Win in the Chinese App Market
What it Takes to Win in the Chinese App MarketWhat it Takes to Win in the Chinese App Market
What it Takes to Win in the Chinese App Marketdigitalinasia
 
Line Plus Marketing Management
Line Plus Marketing ManagementLine Plus Marketing Management
Line Plus Marketing ManagementLena Ou
 
Messaging apps whitepaper_final
Messaging apps whitepaper_finalMessaging apps whitepaper_final
Messaging apps whitepaper_finalThorsten Linz
 
2013 uk digital future in focus
2013 uk digital future in focus 2013 uk digital future in focus
2013 uk digital future in focus Marco Agosti
 
India Social Media Report Edition 2 by Blogworks in assoc with NM Incite (A N...
India Social Media Report Edition 2 by Blogworks in assoc with NM Incite (A N...India Social Media Report Edition 2 by Blogworks in assoc with NM Incite (A N...
India Social Media Report Edition 2 by Blogworks in assoc with NM Incite (A N...India Social
 
Economist - Advertising and Technology - Special Report
Economist - Advertising and Technology - Special ReportEconomist - Advertising and Technology - Special Report
Economist - Advertising and Technology - Special Reportdigitalinasia
 
Marketing fast facts 2014
Marketing fast facts 2014Marketing fast facts 2014
Marketing fast facts 2014Prayukth K V
 
Group M Interaction 2017 Preview
Group M Interaction 2017 PreviewGroup M Interaction 2017 Preview
Group M Interaction 2017 Previewdigitalinasia
 
State of the Social Financial Services Whitepaper - 010515
State of the Social Financial Services Whitepaper - 010515State of the Social Financial Services Whitepaper - 010515
State of the Social Financial Services Whitepaper - 010515Eric Hansen
 
Digital ad spending benchmarks by industry the complete e-marketer series for...
Digital ad spending benchmarks by industry the complete e-marketer series for...Digital ad spending benchmarks by industry the complete e-marketer series for...
Digital ad spending benchmarks by industry the complete e-marketer series for...Victor Kong
 
Telco Content Marketing Top10
Telco Content Marketing Top10Telco Content Marketing Top10
Telco Content Marketing Top10sQills
 
2020 Myanmar Digital Trends
2020 Myanmar Digital Trends2020 Myanmar Digital Trends
2020 Myanmar Digital TrendsSimon Bailey
 
E marketer us_ad_spending-q3_2013_forecast_and_comparative_estimates
E marketer us_ad_spending-q3_2013_forecast_and_comparative_estimatesE marketer us_ad_spending-q3_2013_forecast_and_comparative_estimates
E marketer us_ad_spending-q3_2013_forecast_and_comparative_estimatesAdCMO
 

What's hot (17)

6 Things You Need to Know About 2016 Media Trends
6 Things You Need to Know About 2016 Media Trends6 Things You Need to Know About 2016 Media Trends
6 Things You Need to Know About 2016 Media Trends
 
Vietnam Digital Advertising Report (H1, 2018)
Vietnam Digital Advertising Report (H1, 2018)Vietnam Digital Advertising Report (H1, 2018)
Vietnam Digital Advertising Report (H1, 2018)
 
What it Takes to Win in the Chinese App Market
What it Takes to Win in the Chinese App MarketWhat it Takes to Win in the Chinese App Market
What it Takes to Win in the Chinese App Market
 
Line Plus Marketing Management
Line Plus Marketing ManagementLine Plus Marketing Management
Line Plus Marketing Management
 
Messaging apps whitepaper_final
Messaging apps whitepaper_finalMessaging apps whitepaper_final
Messaging apps whitepaper_final
 
2013 uk digital future in focus
2013 uk digital future in focus 2013 uk digital future in focus
2013 uk digital future in focus
 
India Social Media Report Edition 2 by Blogworks in assoc with NM Incite (A N...
India Social Media Report Edition 2 by Blogworks in assoc with NM Incite (A N...India Social Media Report Edition 2 by Blogworks in assoc with NM Incite (A N...
India Social Media Report Edition 2 by Blogworks in assoc with NM Incite (A N...
 
Economist - Advertising and Technology - Special Report
Economist - Advertising and Technology - Special ReportEconomist - Advertising and Technology - Special Report
Economist - Advertising and Technology - Special Report
 
Estadísticas App Store
Estadísticas App StoreEstadísticas App Store
Estadísticas App Store
 
Marketing fast facts 2014
Marketing fast facts 2014Marketing fast facts 2014
Marketing fast facts 2014
 
Group M Interaction 2017 Preview
Group M Interaction 2017 PreviewGroup M Interaction 2017 Preview
Group M Interaction 2017 Preview
 
Social media and the Romanian business environment 2015
Social media and the Romanian business environment 2015Social media and the Romanian business environment 2015
Social media and the Romanian business environment 2015
 
State of the Social Financial Services Whitepaper - 010515
State of the Social Financial Services Whitepaper - 010515State of the Social Financial Services Whitepaper - 010515
State of the Social Financial Services Whitepaper - 010515
 
Digital ad spending benchmarks by industry the complete e-marketer series for...
Digital ad spending benchmarks by industry the complete e-marketer series for...Digital ad spending benchmarks by industry the complete e-marketer series for...
Digital ad spending benchmarks by industry the complete e-marketer series for...
 
Telco Content Marketing Top10
Telco Content Marketing Top10Telco Content Marketing Top10
Telco Content Marketing Top10
 
2020 Myanmar Digital Trends
2020 Myanmar Digital Trends2020 Myanmar Digital Trends
2020 Myanmar Digital Trends
 
E marketer us_ad_spending-q3_2013_forecast_and_comparative_estimates
E marketer us_ad_spending-q3_2013_forecast_and_comparative_estimatesE marketer us_ad_spending-q3_2013_forecast_and_comparative_estimates
E marketer us_ad_spending-q3_2013_forecast_and_comparative_estimates
 

Similar to E marketer worldwide_social_network_ad_spending_forecast-robust_growth_set_to_continue_through_2014

E marketer worldwide_ad_spending_forecast-emerging_markets_mobile_provide_opp...
E marketer worldwide_ad_spending_forecast-emerging_markets_mobile_provide_opp...E marketer worldwide_ad_spending_forecast-emerging_markets_mobile_provide_opp...
E marketer worldwide_ad_spending_forecast-emerging_markets_mobile_provide_opp...AdCMO
 
E marketer the_global_media_intelligence_report-north_america_2013
E marketer the_global_media_intelligence_report-north_america_2013E marketer the_global_media_intelligence_report-north_america_2013
E marketer the_global_media_intelligence_report-north_america_2013AdCMO
 
Global ad spend by vertical jan 2013
Global ad spend by vertical jan 2013Global ad spend by vertical jan 2013
Global ad spend by vertical jan 2013Dung Tri
 
Global Social Media Advertising Revenues 2012 – Forecast 2016, Strong growth ...
Global Social Media Advertising Revenues 2012 – Forecast 2016, Strong growth ...Global Social Media Advertising Revenues 2012 – Forecast 2016, Strong growth ...
Global Social Media Advertising Revenues 2012 – Forecast 2016, Strong growth ...Rajesh Prabhakar
 
Social Media Market
Social Media MarketSocial Media Market
Social Media Marketresultsig
 
E marketer worldwide_social_network_ad_revenues-a_10_billion_market_by_2013
E marketer worldwide_social_network_ad_revenues-a_10_billion_market_by_2013E marketer worldwide_social_network_ad_revenues-a_10_billion_market_by_2013
E marketer worldwide_social_network_ad_revenues-a_10_billion_market_by_2013AdCMO
 
Cover SheetName of Students in Group1. Yua.docx
Cover SheetName of Students in Group1. Yua.docxCover SheetName of Students in Group1. Yua.docx
Cover SheetName of Students in Group1. Yua.docxfaithxdunce63732
 
Digital Market Share 2014
Digital Market Share 2014Digital Market Share 2014
Digital Market Share 2014Javier Ruiz
 
eMarketer_China_Digital_Ad_Trends-Multiple_Forces_Driving_Growth
eMarketer_China_Digital_Ad_Trends-Multiple_Forces_Driving_GrowtheMarketer_China_Digital_Ad_Trends-Multiple_Forces_Driving_Growth
eMarketer_China_Digital_Ad_Trends-Multiple_Forces_Driving_GrowthGLG (Gerson Lehrman Group)
 
Trends in Social Media; a Focus on Content, Mobile and Geography
Trends in Social Media; a Focus on Content, Mobile and GeographyTrends in Social Media; a Focus on Content, Mobile and Geography
Trends in Social Media; a Focus on Content, Mobile and GeographyGGV Capital
 
E marketer the_global_media_intelligence_report_2012
E marketer the_global_media_intelligence_report_2012E marketer the_global_media_intelligence_report_2012
E marketer the_global_media_intelligence_report_2012AdCMO
 
E marketer report on the Mobile media report on latin-america (4)
E marketer  report on the Mobile media report on latin-america (4)E marketer  report on the Mobile media report on latin-america (4)
E marketer report on the Mobile media report on latin-america (4)Sumit Roy
 
Latin American Mobile Economy snapshot
Latin American Mobile Economy snapshotLatin American Mobile Economy snapshot
Latin American Mobile Economy snapshotSumit Roy
 
E marketer the-global-media-intelligence-report-latin-america (3)
E marketer the-global-media-intelligence-report-latin-america (3)E marketer the-global-media-intelligence-report-latin-america (3)
E marketer the-global-media-intelligence-report-latin-america (3)Sumit Roy
 
Stifel Internet Research - The Long Runway to Solving Consumer Problems
Stifel Internet Research - The Long Runway to Solving Consumer ProblemsStifel Internet Research - The Long Runway to Solving Consumer Problems
Stifel Internet Research - The Long Runway to Solving Consumer ProblemsScott Devitt
 
Fipp world media trends special report digital revenue
Fipp world media trends special report digital revenueFipp world media trends special report digital revenue
Fipp world media trends special report digital revenueTuan Anh Nguyen
 
Shoobedoo_Onlinestrategyplan
Shoobedoo_OnlinestrategyplanShoobedoo_Onlinestrategyplan
Shoobedoo_OnlinestrategyplanNuwan Gamage
 
Uga marketing Social Media and Marketing
Uga marketing Social Media and MarketingUga marketing Social Media and Marketing
Uga marketing Social Media and MarketingJamil "Jim" Elayan
 

Similar to E marketer worldwide_social_network_ad_spending_forecast-robust_growth_set_to_continue_through_2014 (20)

E marketer worldwide_ad_spending_forecast-emerging_markets_mobile_provide_opp...
E marketer worldwide_ad_spending_forecast-emerging_markets_mobile_provide_opp...E marketer worldwide_ad_spending_forecast-emerging_markets_mobile_provide_opp...
E marketer worldwide_ad_spending_forecast-emerging_markets_mobile_provide_opp...
 
E marketer the_global_media_intelligence_report-north_america_2013
E marketer the_global_media_intelligence_report-north_america_2013E marketer the_global_media_intelligence_report-north_america_2013
E marketer the_global_media_intelligence_report-north_america_2013
 
Global ad spend by vertical jan 2013
Global ad spend by vertical jan 2013Global ad spend by vertical jan 2013
Global ad spend by vertical jan 2013
 
Global Social Media Advertising Revenues 2012 – Forecast 2016, Strong growth ...
Global Social Media Advertising Revenues 2012 – Forecast 2016, Strong growth ...Global Social Media Advertising Revenues 2012 – Forecast 2016, Strong growth ...
Global Social Media Advertising Revenues 2012 – Forecast 2016, Strong growth ...
 
Social Media Market
Social Media MarketSocial Media Market
Social Media Market
 
E marketer worldwide_social_network_ad_revenues-a_10_billion_market_by_2013
E marketer worldwide_social_network_ad_revenues-a_10_billion_market_by_2013E marketer worldwide_social_network_ad_revenues-a_10_billion_market_by_2013
E marketer worldwide_social_network_ad_revenues-a_10_billion_market_by_2013
 
Cover SheetName of Students in Group1. Yua.docx
Cover SheetName of Students in Group1. Yua.docxCover SheetName of Students in Group1. Yua.docx
Cover SheetName of Students in Group1. Yua.docx
 
Digital Market Share 2014
Digital Market Share 2014Digital Market Share 2014
Digital Market Share 2014
 
Global Media Report 2013
Global Media Report 2013Global Media Report 2013
Global Media Report 2013
 
eMarketer_China_Digital_Ad_Trends-Multiple_Forces_Driving_Growth
eMarketer_China_Digital_Ad_Trends-Multiple_Forces_Driving_GrowtheMarketer_China_Digital_Ad_Trends-Multiple_Forces_Driving_Growth
eMarketer_China_Digital_Ad_Trends-Multiple_Forces_Driving_Growth
 
Trends in Social Media; a Focus on Content, Mobile and Geography
Trends in Social Media; a Focus on Content, Mobile and GeographyTrends in Social Media; a Focus on Content, Mobile and Geography
Trends in Social Media; a Focus on Content, Mobile and Geography
 
E marketer the_global_media_intelligence_report_2012
E marketer the_global_media_intelligence_report_2012E marketer the_global_media_intelligence_report_2012
E marketer the_global_media_intelligence_report_2012
 
E marketer report on the Mobile media report on latin-america (4)
E marketer  report on the Mobile media report on latin-america (4)E marketer  report on the Mobile media report on latin-america (4)
E marketer report on the Mobile media report on latin-america (4)
 
Latin American Mobile Economy snapshot
Latin American Mobile Economy snapshotLatin American Mobile Economy snapshot
Latin American Mobile Economy snapshot
 
E marketer the-global-media-intelligence-report-latin-america (3)
E marketer the-global-media-intelligence-report-latin-america (3)E marketer the-global-media-intelligence-report-latin-america (3)
E marketer the-global-media-intelligence-report-latin-america (3)
 
Advertising
AdvertisingAdvertising
Advertising
 
Stifel Internet Research - The Long Runway to Solving Consumer Problems
Stifel Internet Research - The Long Runway to Solving Consumer ProblemsStifel Internet Research - The Long Runway to Solving Consumer Problems
Stifel Internet Research - The Long Runway to Solving Consumer Problems
 
Fipp world media trends special report digital revenue
Fipp world media trends special report digital revenueFipp world media trends special report digital revenue
Fipp world media trends special report digital revenue
 
Shoobedoo_Onlinestrategyplan
Shoobedoo_OnlinestrategyplanShoobedoo_Onlinestrategyplan
Shoobedoo_Onlinestrategyplan
 
Uga marketing Social Media and Marketing
Uga marketing Social Media and MarketingUga marketing Social Media and Marketing
Uga marketing Social Media and Marketing
 

More from AdCMO

Nonprofits Guide to the Internet
Nonprofits Guide to the InternetNonprofits Guide to the Internet
Nonprofits Guide to the InternetAdCMO
 
Nonprofit Marketing Blueprint
Nonprofit Marketing BlueprintNonprofit Marketing Blueprint
Nonprofit Marketing BlueprintAdCMO
 
What does a dsp do
What does a dsp doWhat does a dsp do
What does a dsp doAdCMO
 
Video marketing-smart-insights
Video marketing-smart-insightsVideo marketing-smart-insights
Video marketing-smart-insightsAdCMO
 
Google Video Advertising
Google Video Advertising Google Video Advertising
Google Video Advertising AdCMO
 
Video ads-the-programmatic-channel research-studies
Video ads-the-programmatic-channel research-studiesVideo ads-the-programmatic-channel research-studies
Video ads-the-programmatic-channel research-studiesAdCMO
 
Vb marketing andpricing
Vb marketing andpricingVb marketing andpricing
Vb marketing andpricingAdCMO
 
Tourism package examples
Tourism package examplesTourism package examples
Tourism package examplesAdCMO
 
The strategic-marketing-process-e book
The strategic-marketing-process-e bookThe strategic-marketing-process-e book
The strategic-marketing-process-e bookAdCMO
 
The new-multi-screen-world-study research-studies
The new-multi-screen-world-study research-studiesThe new-multi-screen-world-study research-studies
The new-multi-screen-world-study research-studiesAdCMO
 
The display landscape
The display landscapeThe display landscape
The display landscapeAdCMO
 
Social Media Toolkit for Health Communicators
Social Media Toolkit for Health CommunicatorsSocial Media Toolkit for Health Communicators
Social Media Toolkit for Health CommunicatorsAdCMO
 
Section 1
Section 1Section 1
Section 1AdCMO
 
Retargeting 101
Retargeting 101Retargeting 101
Retargeting 101AdCMO
 
Neustar marketing services
Neustar marketing servicesNeustar marketing services
Neustar marketing servicesAdCMO
 
Mobile marketing playbook
Mobile marketing playbookMobile marketing playbook
Mobile marketing playbookAdCMO
 
Media kit
Media kitMedia kit
Media kitAdCMO
 
Linked in marketing guide
Linked in marketing guideLinked in marketing guide
Linked in marketing guideAdCMO
 
Lifecycle marketing
Lifecycle marketingLifecycle marketing
Lifecycle marketingAdCMO
 

More from AdCMO (20)

Nonprofits Guide to the Internet
Nonprofits Guide to the InternetNonprofits Guide to the Internet
Nonprofits Guide to the Internet
 
Nonprofit Marketing Blueprint
Nonprofit Marketing BlueprintNonprofit Marketing Blueprint
Nonprofit Marketing Blueprint
 
What does a dsp do
What does a dsp doWhat does a dsp do
What does a dsp do
 
Video marketing-smart-insights
Video marketing-smart-insightsVideo marketing-smart-insights
Video marketing-smart-insights
 
Google Video Advertising
Google Video Advertising Google Video Advertising
Google Video Advertising
 
Video ads-the-programmatic-channel research-studies
Video ads-the-programmatic-channel research-studiesVideo ads-the-programmatic-channel research-studies
Video ads-the-programmatic-channel research-studies
 
Vb marketing andpricing
Vb marketing andpricingVb marketing andpricing
Vb marketing andpricing
 
Tourism package examples
Tourism package examplesTourism package examples
Tourism package examples
 
The strategic-marketing-process-e book
The strategic-marketing-process-e bookThe strategic-marketing-process-e book
The strategic-marketing-process-e book
 
The new-multi-screen-world-study research-studies
The new-multi-screen-world-study research-studiesThe new-multi-screen-world-study research-studies
The new-multi-screen-world-study research-studies
 
The display landscape
The display landscapeThe display landscape
The display landscape
 
Social Media Toolkit for Health Communicators
Social Media Toolkit for Health CommunicatorsSocial Media Toolkit for Health Communicators
Social Media Toolkit for Health Communicators
 
Section 1
Section 1Section 1
Section 1
 
Rtb
RtbRtb
Rtb
 
Retargeting 101
Retargeting 101Retargeting 101
Retargeting 101
 
Neustar marketing services
Neustar marketing servicesNeustar marketing services
Neustar marketing services
 
Mobile marketing playbook
Mobile marketing playbookMobile marketing playbook
Mobile marketing playbook
 
Media kit
Media kitMedia kit
Media kit
 
Linked in marketing guide
Linked in marketing guideLinked in marketing guide
Linked in marketing guide
 
Lifecycle marketing
Lifecycle marketingLifecycle marketing
Lifecycle marketing
 

E marketer worldwide_social_network_ad_spending_forecast-robust_growth_set_to_continue_through_2014

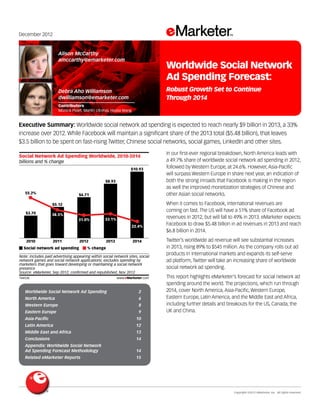
  • 1. Copyright ©2012 eMarketer, Inc. All rights reserved. Worldwide Social Network Ad Spending 2 North America 6 Western Europe 8 Eastern Europe 9 Asia-Pacific 10 Latin America 12 Middle East and Africa 13 Conclusions 14 Appendix: Worldwide Social Network Ad Spending Forecast Methodology 14 Related eMarketer Reports 15 December 2012 Executive Summary: Worldwide social network ad spending is expected to reach nearly $9 billion in 2013, a 33% increase over 2012. While Facebook will maintain a significant share of the 2013 total ($5.48 billion), that leaves $3.5 billion to be spent on fast-rising Twitter, Chinese social networks, social games, LinkedIn and other sites. 144536 In our first-ever regional breakdown, North America leads with a 49.7% share of worldwide social network ad spending in 2012, followed by Western Europe, at 24.6%. However, Asia-Pacific will surpass Western Europe in share next year, an indication of both the strong inroads that Facebook is making in the region as well the improved monetization strategies of Chinese and other Asian social networks. When it comes to Facebook, international revenues are coming on fast. The US will have a 51% share of Facebook ad revenues in 2012, but will fall to 49% in 2013. eMarketer expects Facebook to draw $5.48 billion in ad revenues in 2013 and reach $6.8 billion in 2014. Twitter’s worldwide ad revenue will see substantial increases in 2013, rising 89% to $545 million. As the company rolls out ad products in international markets and expands its self-serve ad platform, Twitter will take an increasing share of worldwide social network ad spending. This report highlights eMarketer’s forecast for social network ad spending around the world. The projections, which run through 2014, cover North America, Asia-Pacific, Western Europe, Eastern Europe, Latin America, and the Middle East and Africa, including further details and breakouts for the US, Canada, the UK and China. billions and % change Social Network Ad Spending Worldwide, 2010-2014 2010 $3.70 55.2% 2011 $5.12 38.5% 2012 $6.71 31.0% 2013 $8.93 33.1% 2014 $10.93 22.4% Social network ad spending % change Note: includes paid advertising appearing within social network sites, social network games and social network applications; excludes spending by marketers that goes toward developing or maintaining a social network presence Source: eMarketer, Sep 2012; confirmed and republished, Nov 2012 144536 www.eMarketer.com Alison McCarthy amccarthy@emarketer.com Debra Aho Williamson dwilliamson@emarketer.com Contributors Monica Peart, Martín Utreras, Haixia Wang Worldwide Social Network Ad Spending Forecast: Robust Growth Set to Continue Through 2014
  • 2. Worldwide Social Network Ad Spending Forecast: Robust Growth Set to Continue Through 2014 Copyright ©2012 eMarketer, Inc. All rights reserved. 2 Worldwide Social Network Ad Spending Worldwide social network advertising spending is expected to reach nearly $9 billion in 2013, up 33% over 2012’s expected total of $6.71 billion. By 2014, ad spending on social networks will approach the $11 billion mark. billions and % change Social Network Ad Spending Worldwide, 2010-2014 2010 $3.70 55.2% 2011 $5.12 38.5% 2012 $6.71 31.0% 2013 $8.93 33.1% 2014 $10.93 22.4% Social network ad spending % change Note: includes paid advertising appearing within social network sites, social network games and social network applications; excludes spending by marketers that goes toward developing or maintaining a social network presence Source: eMarketer, Sep 2012; confirmed and republished, Nov 2012 144536 www.eMarketer.com 144536 2012 has been a year of intense scrutiny of the social network advertising business, primarily because Facebook’s ad revenues have not grown as rapidly as expected. eMarketer’s current forecast for social network ad spending in 2012 is $1 billion lower than our forecast published in February 2012, mainly due to the Facebook slowdown. But social networking is an activity that is gaining strength around the world. eMarketer forecasts that there will be 1.63 billion monthly users in 2013, representing nearly one in four people across the globe. Marketers will continue to invest ad dollars to reach these people. In Asia-Pacific, for example, marketers are making more serious efforts to reach a growing social network user population. Chinese social network Sina Weibo is seeing initial signs of strong monetization as advertisers begin to engage with the microblogging service’s 300 million-plus registered users. Meanwhile,Twitter is flourishing in the UK,Japan and Brazil,and the company is expanding its international advertising sales efforts, allowing marketers new opportunities to reach its user base. Among world regions, North America will claim the lion’s share of social network ad expenditures, at $4.36 billion in 2013. North America’s share will be more than double that of Asia-Pacific, the region that will have the second-highest amount spent on social network advertising next year. North America’s strong position among world regions is reflective of the hold that social networking has on the populations of the US and Canada and the fact that US businesses commonly incorporate social network advertising into their budgets. millions Social Network Ad Spending Worldwide, by Region, 2010-2014 North America Western Europe Asia-Pacific Eastern Europe Latin America Middle East & Africa Worldwide 2010 $2,040.8 $1,013.8 $530.6 $61.6 $45.6 $4.3 $3,696.6 2011 $2,593.1 $1,302.6 $994.8 $119.3 $97.5 $11.3 $5,118.6 2012 $3,332.5 $1,648.3 $1,381.6 $167.8 $156.7 $21.0 $6,707.8 2013 $4,356.6 $1,990.9 $2,048.0 $250.0 $244.6 $37.1 $8,927.2 2014 $5,346.0 $2,280.4 $2,586.0 $307.7 $339.7 $68.5 $10,928.3 Note: includes display, search, video and other forms of paid advertising appearing within social networks, social games and social applications; excludes spending by marketers that goes toward developing or maintaining social network profile pages or branded applications; numbers may not add up to total due to rounding Source: eMarketer, Nov 2012 147493 www.eMarketer.com 147493 The Middle East and Africa will experience the fastest growth throughout the forecast period, though investments will remain extremely low compared to the other regions. Latin America and Eastern Europe will also see higher-than-average growth. % change Social Network Ad Spending Growth Worldwide, by Region, 2010-2014 2010 2011 2012 2013 2014 Middle East & Africa 287.6% 163.2% 84.9% 76.9% 84.7% Latin America 179.8% 114.1% 60.7% 56.1% 38.9% Eastern Europe 92.4% 93.8% 40.6% 49.0% 23.1% Asia-Pacific 99.3% 87.5% 38.9% 48.2% 26.3% North America 37.2% 27.1% 28.5% 30.7% 22.7% Western Europe 75.1% 28.5% 26.5% 20.8% 14.5% Worldwide 55.2% 38.5% 31.0% 33.1% 22.4% Note: includes display, search, video and other forms of paid advertising appearing within social networks, social games and social applications; excludes spending by marketers that goes toward developing or maintaining social network profile pages or branded applications Source: eMarketer, Nov 2012 147557 www.eMarketer.com 147557 Social network ad spending in North America will lose some share to other regions during the forecast period, but eMarketer expects that it will continue to account for almost half of the global total through 2014. Asia-Pacific will see its share increase from 20.6% in 2012 to 23.7% in 2014, surpassing that of Western Europe. This will primarily be a result of Facebook’s increased monetization efforts in the region, but also a reflection that advertisers in China (where Facebook does not have a presence) are starting to spend more on advertising via local social networks.
  • 3. Worldwide Social Network Ad Spending Forecast: Robust Growth Set to Continue Through 2014 Copyright ©2012 eMarketer, Inc. All rights reserved. 3 % of total Social Network Ad Spending Share Worldwide, by Region, 2010-2014 2010 2011 2012 2013 2014 North America 55.2% 50.7% 49.7% 48.8% 48.9% Western Europe 27.4% 25.4% 24.6% 22.3% 20.9% Asia-Pacific 14.4% 19.4% 20.6% 22.9% 23.7% Eastern Europe 1.7% 2.3% 2.5% 2.8% 2.8% Latin America 1.2% 1.9% 2.3% 2.7% 3.1% Middle East & Africa 0.1% 0.2% 0.3% 0.4% 0.6% Note: includes display, search, video and other forms of paid advertising appearing within social networks, social games and social applications; excludes spending by marketers that goes toward developing or maintaining social network profile pages or branded applications; numbers may not add up to 100% due to rounding Source: eMarketer, Nov 2012 147561 www.eMarketer.com 147561 eMarketer expects social network ad spending to account for 7.3% of worldwide digital ad spending in 2013. Spending in North America will remain higher than worldwide average due to the more mature monetization efforts in the US, while marketers in the Middle East and Africa, an immature market, will concentrate very little of their digital ad spending on social network sites— only 3% expected in 2013. eMarketer measures digital ad spending based on the location of the advertiser. Because there is a higher concentration of advertisers in the US, many of which put greater efforts into social network advertising, the US (and North America) are more heavily weighted than other regions, adding to the disparity in revenue. % of digital ad spending Social Network Ad Spending Worldwide, by Region, 2010-2014 2010 2011 2012 2013 2014 North America 7.1% 7.5% 8.3% 9.5% 10.4% Western Europe 4.6% 5.2% 6.0% 6.5% 6.8% Asia-Pacific 3.0% 4.6% 5.1% 6.3% 6.9% Eastern Europe 2.9% 4.1% 4.8% 6.1% 6.5% Latin America 2.5% 4.0% 4.6% 5.9% 6.4% Middle East & Africa 1.1% 1.9% 2.4% 2.9% 3.9% Worldwide 5.1% 5.8% 6.4% 7.3% 7.8% Note: includes display, search, video and other forms of paid advertising appearing within social networks, social games and social applications; excludes spending by marketers that goes toward developing or maintaining social network profile pages or branded applications Source: eMarketer, Nov 2012 147562 www.eMarketer.com 147562 Facebook will take 63% of the worldwide social network ad spending pie in 2012, dipping slightly to 61.4% in 2013 as LinkedIn and Twitter grow their shares. Twitter will see the biggest jump in worldwide social network ad revenue share, rising from 4.3% in 2012 to 7.4% in 2014. Facebook will rebound slightly in 2014 as the combined share of smaller social networks falls somewhat. But, overall, Facebook’s share of the market has remained relatively constant since 2011. If the company were to start operating in China, its share might rise again—and substantially. % of total Social Network Ad Spending Share Worldwide, by Venue, 2010-2014 2010 2011 2012 2013 2014 Facebook 50.7% 61.6% 63.1% 61.4% Social games 7.5% 7.6% 8.1% 7.8% Twitter 1.2% 2.7% 4.3% 6.1% LinkedIn 2.1% 3.0% 3.9% 4.3% Myspace* 7.2% 0.9% - - Other 31.1% 24.1% 20.7% 20.5% 62.3% 7.5% 7.4% 4.7% - 18.1% Note: includes display, search, video and other forms of paid advertising appearing within social networks, social games and social applications; excludes spending by marketers that goes toward developing or maintaining social network profile pages or branded applications; numbers may not add up to 100% due to rounding; *effective in 2012, Myspace will no longer be included in eMarketer's forecast Source: eMarketer, Nov 2012 147600 www.eMarketer.com 147600 Facebook Ad Revenues Worldwide While internet users in the US fueled Facebook’s meteoric rise, foreign expansion is driving the company’s growth, both in users and in revenue. eMarketer expects Facebook to draw $5.48 billion in worldwide ad revenues in 2013 and pull in $6.8 billion in 2014. billions and % change Facebook Ad Revenues Worldwide, 2010-2014 2010 $1.88 146.3% 2011 $3.15 68.2% 2012 $4.23 34.1% 2013 $5.48 29.5% 2014 $6.81 24.2% Facebook ad revenues % change Note: paid advertising only; excludes spending by marketers that goes toward developing or maintaining a Facebook presence Source: eMarketer, Sep 2012 144542 www.eMarketer.com 144542 eMarketer has lowered its expectations for Facebook worldwide ad revenues in 2012 from its February 2012 estimate after the company underperformed market expectations in both Q1 and Q2. eMarketer now expects that ad revenue will grow 34% in 2012, compared with the earlier prediction of 60.5%. In the first nine months of 2012, Facebook’s ad revenue grew 33%, according to the company’s Q3 2012 earnings report. The US will represent 51% of Facebook ad revenue in 2012, but its share is expected to fall to 49% in 2013 and 47% in 2014, eMarketer forecasts. Much of Facebook’s user growth is happening outside the US; in Q3 2012, the primary sources Worldwide Social Network Ad Spending
  • 4. Worldwide Social Network Ad Spending Forecast: Robust Growth Set to Continue Through 2014 Copyright ©2012 eMarketer, Inc. All rights reserved. 4 of new growth were Brazil, India and Japan, Facebook said. However, Facebook faces challenges in monetizing these users, particularly those in developing markets who may be of lower value to marketers. In the first nine months of 2012, 51% of Facebook’s total revenue, including both ads and payments, came from companies based in the US, the company said in its Q3 2012 earnings report. (Facebook does not break out the percentage of ad revenue that comes from companies in the US, but eMarketer’s assumption is that the total revenue split and the ad revenue split are similar.) Ads will continue to diminish as a portion of Facebook’s total revenue, but the rate of decline is slowing. Advertising fell from 95% of revenue in 2010 to 85% in 2011, according to eMarketer. In 2012, ads will account for an estimated 83.9% of total revenue. Facebook Payments revenue growth is slowing, mainly because social gaming company Zynga, the primary source of Payments revenue, has faced its own challenges. In Q3 2012, Facebook reported that Zynga accounted for 7% of Facebook’s total revenue, down from 12% in Q3 2011. millions and % of total Facebook Revenues Worldwide, by Source, 2009-2013 Advertising* Facebook Payments and other revenue Total Advertising % of total 2009 $761 $16 $777 98.0% 2010 $1,875 $99 $1,974 95.0% 2011 $3,154 $557 $3,711 85.0% 2012 $4,232 $811 $5,042 83.9% 2013 $5,478 $1,122 $6,600 83.0% Note: numbers may not add up to total due to rounding; *paid advertising only; excludes spending by marketers that goes toward developing or maintaining a Facebook presence Source: eMarketer, Sep 2012 144543 www.eMarketer.com 144543 Twitter Ad Revenues Worldwide Twitter will generate more than $545 million in worldwide ad revenue in 2013,up 89% from 2012’s expected total of $288 million. eMarketer predicts that by 2014Twitter ad revenues will surpass the $800 million mark. millions and % change Twitter Ad Revenues Worldwide, 2010-2014 2010 $44.6 2011 $139.5 213.1% 2012 $288.3 106.7% 2013 $545.2 89.1% 2014 $807.5 48.1% Twitter ad revenues % change Note: paid advertising only; excludes spending by marketers that goes toward developing or maintaining a Twitter presence Source: eMarketer, Sep 2012 144546 www.eMarketer.com 144546 Twitter’s ad revenue for 2012 has grown faster than eMarketer’s earlier expectations and so our forecast has been revised upward from the February 2012 estimate of $260 million. This year, the company has steadily grown its monetization efforts, adding new features to its ad products and expanding sales efforts in international markets, which now make up 70% of Twitter’s reported user base. Key revenue drivers for the company in 2013 and beyond include: ■■ The rollout of Twitter’s self-serve advertising platform, aimed at small and midsize businesses ■■ The launch of a Twitter Ads API, expected in late 2012 or early 2013 ■■ Increased focus on selling ads in international markets, including Japan, the UK and Brazil ■■ Better forms of ad targeting, including messages aimed at specific mobile devices, user geographies and interests eMarketer forecasts that 90% of Twitter’s ad revenues will come from the US in 2012, but that percentage is expected to fall to 83% in 2013 and 79% in 2014, as Twitter’s international ad sales pick up steam. LinkedIn Ad Revenues Worldwide Advertising is a significant contributor to LinkedIn’s business, but the company also has strong revenue streams from recruitment and premium subscription products, which make it less dependent on ads than Facebook or Twitter. As a result, LinkedIn has focused less on innovating new types of advertising and more on building tools for marketers to reach its business-oriented audience, such as branded communities, targeted status updates and sponsorships. Worldwide Social Network Ad Spending
  • 5. Worldwide Social Network Ad Spending Forecast: Robust Growth Set to Continue Through 2014 Copyright ©2012 eMarketer, Inc. All rights reserved. 5 LinkedIn’s worldwide ad revenue will reach $381 million in 2013, up 46.2% from 2012.Ad revenues have grown faster in 2012 than earlier predicted, and eMarketer has revised its forecast upward for the year to $260 million, from the $226 million forecast in February 2012. millions and % change LinkedIn Ad Revenues Worldwide, 2010-2014 2010 $79.2 106.8% 2011 $155.9 96.8% 2012 $260.7 67.2% 2013 $381.1 46.2% 2014 $513.1 34.6% LinkedIn ad revenues % change Note: figures represent revenue from LinkedIn's Marketing Solutions business segment Source: eMarketer, Sep 2012 144548 www.eMarketer.com 144548 For the year through Q3 2012, LinkedIn had $175.1 million in ad revenue, representing 26% of total revenues in the period. eMarketer estimates that 64% of LinkedIn’s ad revenue will come from the US in 2012, falling to 60% in 2014. Social Game Ad Spending Worldwide eMarketer expects that worldwide social gaming ad spending will rise 28.6% in 2013 to $695 million and reach $824 million in 2014. Non-US markets will account for 59% of social game spending next year. millions Social Game Ad Spending, US vs. Non-US, 2010-2014 2010 $111.6 $167.4 $278.9 2011 $135.4 $251.5 $387.0 2012 $210.9 $329.9 $540.8 2013 $285.1 $410.2 $695.3 2014 $371.0 $453.4 $824.4 US Non-US Note: paid advertising only; excludes spending by marketers that goes toward developing or maintaining branded social games; numbers may not add up to total due to rounding Source: eMarketer, Sep 2012 144551 www.eMarketer.com 144551 Zynga, the most widely known social game company, has struggled in 2012, as its new games have not taken off and users have started to spend less money buying virtual items within games. However, advertising revenue is becoming more robust, propping up the company’s fortunes. Zynga’s ad revenue reached $100.2 million in the first nine months of 2012, up 113% from $47.1 million in the first nine months of 2011. Zynga is just one company in the social game space, however, and consumer interest in social gaming remains relatively high in international markets, particularly in Asia-Pacific. In Japan, for example, mobile social game network Gree has had steady growth in ad sales and has teamed up with a French mobile ad company to expand its mobile ad business. Gree also launched a global platform, expanding the reach of its games to 169 countries, including the US. Other mobile game companies in Asia-Pacific are seeking to expand their games into the US, too, with the intention of earning revenue from both virtual goods and advertising. Worldwide Social Network Ad Spending
  • 6. Worldwide Social Network Ad Spending Forecast: Robust Growth Set to Continue Through 2014 Copyright ©2012 eMarketer, Inc. All rights reserved. 6 North America Given that Facebook, Twitter and LinkedIn all started in the US, it is not surprising that North America accounts for such a large percentage of the worldwide social network ad market. Spending in North America is expected to reach $3.3 billion in 2012 and rise 30.7% to $4.4 billion in 2013. The percentage of digital ad budgets going toward social networks will reach 9.5% next year, up from 8.3% in 2012, as advertisers fund campaigns to connect with audiences through social networks on both desktop and mobile platforms. billions, % change and % of digital ad spending Social Network Ad Spending in North America, 2010-2014 2010 $2.04 37.2% 7.1% 2011 $2.59 27.1% 7.5% 2012 $3.33 28.5% 8.3% 2013 $4.36 30.7% 9.5% 2014 $5.35 22.7% 10.4% Note: includes display, search, video and other forms of paid advertising appearing within social networks, social games and social applications; excludes spending by marketers that goes toward developing or maintaining social network profile pages or branded applications Source: eMarketer, Nov 2012 147569 www.eMarketer.com Social network ad spending % change % of digital ad spending 147569 With nearly 175 million social network users this year, North America provides advertisers with the third-largest regional audience after Asia-Pacific and Latin America. Marketers in North America will spend nearly $24 on social network advertising per social network user in 2013, an amount much higher than in other regions. Social Network Ad Spending per Social Network User in North America, 2010-2014 2010 $13.63 16.0% 2011 $15.82 16.0% 2012 $19.08 20.6% 2013 $23.95 25.6% 2014 $28.26 18.0% % change Note: includes display, search, video and other forms of paid advertising appearing within social networks, social games and social applications; excludes spending by marketers that goes toward developing or maintaining social network profile pages or branded applications Source: eMarketer, Nov 2012 147570 www.eMarketer.com Social network ad spending per social network user 147570 US As the world’s largest advertising market and home base for Facebook, the US dominates social network ad spending. Spending will surpass the $4 billion mark by the end of 2013 and climb to more than $5 billion in 2014. Facebook is the key player, accounting for 68.8% of all social network revenues in the US in 2012. Growth in 2013 will be slightly higher than in 2012, as Facebook and Twitter expand their mobile advertising businesses and as new products, such as the Facebook Exchange real-time bidding platform and Twitter’s self-serve ad platform, expand. eMarketer predicts social networks will account for 9.6% of total digital ad spending in the US in 2013, rising to 10.5% in 2014. Social network ad spending per social network user will reach nearly $20 in 2012 and then grow more than 25% to nearly $25 per user in 2013.
  • 7. Worldwide Social Network Ad Spending Forecast: Robust Growth Set to Continue Through 2014 Copyright ©2012 eMarketer, Inc. All rights reserved. 7 US Social Network Ad Spending per Social Network User, 2010-2014 2010 $14.31 2011 $16.55 2012 $19.88 2013 $24.92 2014 $29.50 Note: includes display, search, video and other forms of paid advertising appearing within social networks, social games and social applications; excludes spending by marketers that goes toward developing or maintaining social network profile pages or branded applications Source: eMarketer, Nov 2012 147582 www.eMarketer.com % change Social network ad spending per social network user 14.5% 15.7% 20.1% 25.4% 18.4% 147582 For more on social network ad revenues in the US, including additional forecasts for Facebook, Twitter, LinkedIn and social games, see eMarketer’s October 2012 report, “US Ad Spending Forecast: Fall 2012 Update.” Canada eMarketer predicts that two-thirds of Canada’s internet users, or 17.7 million people, will use social networks in 2013. That year, marketers will spend $264 million on advertising to these users. Spending has risen steadily since 2011 and percentage gains are expected to reach 35% in 2013. At 8.2% in 2013, social network ad spending as a percentage of total digital ad spending is slightly lower in Canada than in the US, most likely because consumers in Canada are somewhat less apt than US consumers to visit social networks. However, social networks’ share of ad spending is growing and will reach 8.9% in 2014. millions, % change and % of digital ad spending Social Network Ad Spending in Canada, 2010-2014 2010 $115.0 52.4% 5.1% 2011 $146.9 27.8% 5.6% 2012 $195.8 33.2% 6.7% 2013 $264.3 35.0% 8.2% 2014 $310.1 17.3% 8.9% Note: includes display, search, video and other forms of paid advertising appearing within social networks, social games and social applications; excludes spending by marketers that goes toward developing or maintaining social network profile pages or branded applications Source: eMarketer, Nov 2012 147595 www.eMarketer.com Social network ad spending % change % of digital ad spending 147595 Marketers will spend $14.95 on social network advertising per social network user in 2013, a gain of 29% over 2012’s figure. However, growth will taper off in 2014, when social network ad spending per user is expected to reach $16.80—only 12% higher than 2013’s total. The amount spent per user will be substantially lower than in the US, where advertisers are expected to shell out $29.50 per user in 2014. Social Network Ad Spending per Social Network User in Canada, 2010-2014 2010 $7.61 37.1% 2011 $9.10 19.7% 2012 $11.58 27.2% 2013 $14.95 29.1% 2014 $16.80 12.4% Note: includes display, search, video and other forms of paid advertising appearing within social networks, social games and social applications; excludes spending by marketers that goes toward developing or maintaining social network profile pages or branded applications Source: eMarketer, Nov 2012 147596 www.eMarketer.com % change Social network ad spending per social network user 147596 North America
  • 8. Worldwide Social Network Ad Spending Forecast: Robust Growth Set to Continue Through 2014 Copyright ©2012 eMarketer, Inc. All rights reserved. 8 Western Europe With a social network user base expected to total 158.8 million in 2013,Western Europe has a sophisticated audience that marketers have paid a fair amount of attention to. Facebook is the most popular social network in the region, visited by nearly 83% of Western Europe’s social network users in 2012, and many advertisers have established a presence on the site to engage with these consumers. Social network ad expenditures in Western Europe will near the $2 billion mark next year, according to eMarketer estimates.The majority of this spending will come from the UK and Germany, which have the largest social network user populations in Western Europe. Growth in the region has slowed since 2010, and will continue to taper throughout the forecast period, but will remain in the double digits through 2014. Social networks’ share of total digital ad spending in Western Europe is expanding, but at a slower pace relative to North America. eMarketer expects social network ad spending to account for 6% of Western Europe’s total digital ad spending this year. By the end of 2014, that share will have risen by only an eighth of a percentage point. eMarketer believes that there will be no major shifts from other ad formats to social network advertising through 2014. millions, % change and % of digital ad spending Social Network Ad Spending in Western Europe, 2010-2014 2010 $1,013.8 75.1% 4.6% 2011 $1,302.6 28.5% 5.2% 2012 $1,648.3 26.5% 6.0% 2013 $1,990.9 20.8% 6.5% 2014 $2,280.4 14.5% 6.8% Note: includes display, search, video and other forms of paid advertising appearing within social networks, social games and social applications; excludes spending by marketers that goes toward developing or maintaining social network profile pages or branded applications Source: eMarketer, Nov 2012 147566 www.eMarketer.com Social network ad spending % change % of digital ad spending 147566 Social network ad spending per social network user in Western Europe will come in at $12.54 in 2013, according to eMarketer forecasts, 10% higher than 2012’s spend of $11.39. Marketers in Germany and the UK will spend more per user than those in France, Italy and Spain and will help raise the regional average. Social Network Ad Spending per Social Network User in Western Europe, 2010-2014 2010 $9.25 37.7% 2011 $10.07 8.8% 2012 $11.39 13.1% 2013 $12.54 10.1% 2014 $13.41 7.0% Social network ad spending per social network user % change Note: includes display, search, video and other forms of paid advertising appearing within social networks, social games and social applications; excludes spending by marketers that goes toward developing or maintaining social network profile pages or branded applications Source: eMarketer, Nov 2012 147568 www.eMarketer.com 147568 UK The UK has the largest population of Facebook users in Western Europe and the second-largest social network audience in the region after Germany. UK social network users are known to be a highly engaged group, yet UK advertisers have been somewhat slower than those in the US to gravitate toward social networks. eMarketer expects marketers in the UK to invest $646 million in social network advertising in 2013, compared to $4 billion in the US. In the UK, 6.7% of total digital ad spending will go toward social networks next year, compared to 9.6% in the US.
  • 9. Worldwide Social Network Ad Spending Forecast: Robust Growth Set to Continue Through 2014 Copyright ©2012 eMarketer, Inc. All rights reserved. 9 millions, % change and % of digital ad spending UK Social Network Ad Spending, 2010-2014 2010 $343.6 58.3% 5.2% 2011 $463.0 34.7% 6.0% 2012 $553.1 19.5% 6.3% 2013 $646.4 16.9% 6.7% 2014 $738.6 14.3% 6.9% Note: includes display, search, video and other forms of paid advertising appearing within social networks, social games and social applications; excludes spending by marketers that goes toward developing or maintaining social network profile pages or branded applications Source: eMarketer, Nov 2012 147577 www.eMarketer.com Social network ad spending % change % of digital ad spending 147577 The UK does parallel the US in social network ad spending per social network user, as the two countries have similar social ad cost per thousands (CPMs) and are monetizing at a similar rate. eMarketer predicts that advertisers will spend $23.30 on each social network user in the UK in 2013, just $1.60 less than the average amount spent in the US. UK Social Network Ad Spending per Social Network User, 2010-2014 2010 $15.78 37.7% 2011 $19.34 2012 $21.37 2013 $23.34 2014 $25.17 7.8% Note: figures include display, video, search and other forms of paid advertising appearing within social networks, social games and social applications; does not include spending by marketers that goes toward developing or maintaining social network profile pages or branded applications Source: eMarketer, Nov 2012 147578 www.eMarketer.com % change Social network ad spending per social network user 22.6% 10.5%9.2% 147578 Eastern Europe Social network advertising in Eastern Europe is still in a nascent stage, but is growing at a fast pace. eMarketer expects spending will nearly double between 2012 and 2014, from $167.8 million to $307.7 million. As spending grows, social network advertising will become a bigger piece of the digital ad spending pie, making up 6.5% of the region’s total in 2014, up from 4.8% this year. millions, % change and % of digital ad spending Social Network Ad Spending in Eastern Europe, 2010-2014 2010 $61.6 92.4% 2.9% 2011 $119.3 93.8% 4.1% 2012 $167.8 40.6% 4.8% 2013 $250.0 49.0% 6.1% 2014 $307.7 23.1% 6.5% Note: includes display, search, video and other forms of paid advertising appearing within social networks, social games and social applications; excludes spending by marketers that goes toward developing or maintaining social network profile pages or branded applications Source: eMarketer, Nov 2012 147573 www.eMarketer.com Social network ad spending % change % of digital ad spending 147573 With more than 40 million users, the social network VKontakte maintains a stronghold in Eastern Europe and Russia. VKontakte (also known simply as VK) not only adopts and adjusts Facebook’s functionalities to appeal to the Eastern European audience, but offers users a much greater span of content options within the site, such as the ability to watch movies or listen to full albums. But Facebook is expanding rapidly in the region. eMarketer estimates that more than half of all social network users in Eastern Europe will be Facebook users by the end of 2012, a tally that should rise to 62% by 2014. Russia, with 51.8 million social network users in 2012, is the sixth-largest social networking country in the world this year, though it has much lower Facebook penetration than Eastern Europe as a whole. Despite the increasing presence of social networks in Eastern Europe, ad spending per social network user is very low. Local social networks in Eastern Europe do not monetize users on the same level as Facebook or Twitter. Lower wages Western Europe
  • 10. Worldwide Social Network Ad Spending Forecast: Robust Growth Set to Continue Through 2014 Copyright ©2012 eMarketer, Inc. All rights reserved. 10 among the general population have affected spending as well, causing lessening demand for goods and services. eMarketer expects that in 2012, marketers will spend just $1.15 on advertising per social network user. Social Network Ad Spending per Social Network User in Eastern Europe, 2010-2014 2010 $0.54 57.5% 2011 $0.92 68.6% 2012 $1.15 25.5% 2013 $1.53 32.4% 2014 $1.71 12.4% Note: includes display, search, video and other forms of paid advertising appearing within social networks, social games and social applications; excludes spending by marketers that goes toward developing or maintaining social network profile pages or branded applications Source: eMarketer, Nov 2012 147574 www.eMarketer.com % change Social network ad spending per social network user 147574 Asia-Pacific The Asia-Pacific region has a massive social network user base and a broad landscape of social networks for marketers to work with. From social sites such as Tencent Qzone and Sina Weibo in China to the increasing popularity of Facebook and Twitter in countries like Japan, India and Indonesia, the options are extensive. Social network ad spending in Asia-Pacific is set to increase 48% in 2013 and pass the $2 billion mark, to become the region with the second-highest total that year. Japan and China, which have more sophisticated social network economies than other countries in the region, are helping to drive Asia-Pacific’s growth. Marketers there want to reach consumers who have shown a strong propensity to interact with brands on social media sites. According to a Q2 2012 InSites Consulting study, 66% of social network users in China and 56% of those in Japan followed a brand on a social media site—both greater than the US’s 53%. Social network ad spending will account for just over 6% of total digital ad spending in Asia-Pacific in 2013. millions, % change and % of digital ad spending Social Network Ad Spending in Asia-Pacific, 2010-2014 2010 $530.6 99.3% 3.0% 2011 $994.8 87.5% 4.6% 2012 $1,381.6 38.9% 5.1% 2013 $2,048.0 48.2% 6.3% 2014 $2,586.0 26.3% 6.9% Social network ad spending % change % of digital ad spending Note: includes display, search, video and other forms of paid advertising appearing within social networks, social games and social applications; excludes spending by marketers that goes toward developing or maintaining social network profile pages or branded applications Source: eMarketer, Nov 2012 147564 www.eMarketer.com 147564 Spending per user is quite low in the region, attributable to the enormous user base of 616 million, as well as the fact that some Asia-Pacific countries, such as India and Indonesia, have immature digital advertising economies. Spending per user will be much higher in countries with more developed monetization platforms in place, such as Australia and Japan. Eastern Europe
  • 11. Worldwide Social Network Ad Spending Forecast: Robust Growth Set to Continue Through 2014 Copyright ©2012 eMarketer, Inc. All rights reserved. 11 Social Network Ad Spending per Social Network User in Asia-Pacific, 2010-2014 2010 $1.37 52.5% 2011 $2.02 47.1% 2012 $2.24 11.3% 2013 $2.75 22.4% 2014 $3.03 10.3% Social network ad spending per social network user % change Note: includes display, search, video and other forms of paid advertising appearing within social networks, social games and social applications; excludes spending by marketers that goes toward developing or maintaining social network profile pages or branded applications Source: eMarketer, Nov 2012 147565 www.eMarketer.com 147565 China China is the world’s largest social networking market, with 307.5 million users in 2012, nearly double the US user base. Neither Facebook nor Twitter has an official presence there, though, leaving marketers’ advertising spend to collect among homegrown networks such as Sina Weibo, Renren and Tencent’s various social platforms. Marketers in China will spend $612.8 million on social network advertising in 2013, or 6.4% of total digital ad spending in the country. The market will experience rapid growth throughout the forecast period, including a 51.3% gain next year. millions, % change and % of digital ad spending Social Network Ad Spending in China, 2010-2014 2010 $148.0 128.4% 4.0% 2011 $233.1 57.5% 4.4% 2012 $405.1 73.8% 5.5% 2013 $612.8 51.3% 6.4% 2014 $789.5 28.8% 6.5% Note: includes display, search, video and other forms of paid advertising appearing within social networks, social games and social applications; excludes spending by marketers that goes toward developing or maintaining social network profile pages or branded applications Source: eMarketer, Nov 2012 147597 www.eMarketer.com Social network ad spending % change % of digital ad spending 147597 Unlike in the US, where Facebook is the dominant player, internet users in China tend to join multiple social networks, affording marketers more options to reach consumers.According to InSites Consulting, 53% of social network users in China use three or more such sites, compared to 33% in the US. Social network ad spending per user is quite low in China. eMarketer predicts that in 2013, marketers in China will only spend $1.67 on each social network user.Though this is a fraction of what is spent per user in other markets, China has so many social network users that it adds up to significant total revenue. Social Network Ad Spending per Social Network User in China, 2010-2014 2010 $0.71 71.5% 2011 $0.91 27.1% 2012 $1.32 44.9% 2013 $1.67 27.0% 2014 $1.90 13.8% Note: includes display, search, video and other forms of paid advertising appearing within social networks, social games and social applications; excludes spending by marketers that goes toward developing or maintaining social network profile pages or branded applications Source: eMarketer, Nov 2012 147598 www.eMarketer.com % change Social network ad spending per social network user 147598 Asia-Pacific
  • 12. Worldwide Social Network Ad Spending Forecast: Robust Growth Set to Continue Through 2014 Copyright ©2012 eMarketer, Inc. All rights reserved. 12 Latin America More than two out of three internet users in Latin America are expected to be social network users in 2012, according to eMarketer estimates. Facebook is the most popular, but Twitter and Google+ are rising, especially in Brazil. Although the region’s social network user population is growing rapidly, Latin America is uneven in terms of internet access. Many people access social networks via their mobile phones, where social network advertising is not yet ubiquitous. These reasons, combined with marketers’ reliance on traditional advertising formats, have made marketers in Latin America slow to engage users through social network advertising. With $245 million in social network ad spending in 2013, or 5.9% of the region’s total digital ad spending, Latin America will remain second to last globally when it comes to social spending, above only the Middle East and Africa. The market is expected to grow 39% to reach $340 million in 2014. millions, % change and % of digital ad spending Social Network Ad Spending in Latin America, 2010-2014 2010 $45.6 179.8% 2.5% 2011 $97.5 114.1% 4.0% 2012 $156.7 60.7% 4.6% 2013 $244.6 56.1% 5.9% 2014 $339.7 38.9% 6.4% Note: includes display, search, video and other forms of paid advertising appearing within social networks, social games and social applications; excludes spending by marketers that goes toward developing or maintaining social network profile pages or branded applications Source: eMarketer, Nov 2012 147571 www.eMarketer.com Social network ad spending % change % of digital ad spending 147571 eMarketer estimates that social network ad spending per social network user will increase from $0.89 in 2012 to $1.51 in 2014, but this is an extremely low investment compared to other regions. Social Network Ad Spending per Social Network User in Latin America, 2010-2014 2010 $0.37 119.9% 2011 $0.66 77.2% 2012 $0.89 35.6% 2013 $1.21 36.3% 2014 $1.51 24.5% Note: includes display, search, video and other forms of paid advertising appearing within social networks, social games and social applications; excludes spending by marketers that goes toward developing or maintaining social network profile pages or branded applications Source: eMarketer, Nov 2012 147572 www.eMarketer.com % change Social network ad spending per social network user 147572 One market that stands out in Latin America is Brazil. eMarketer expects that advertisers in Brazil will spend much more on social network advertising than in countries such as Argentina and Mexico. Brazil’s social network audience is largely urban and upwardly mobile, and the country is investing heavily in tech infrastructure, all of which will contribute to a healthy social network economy.
  • 13. Worldwide Social Network Ad Spending Forecast: Robust Growth Set to Continue Through 2014 Copyright ©2012 eMarketer, Inc. All rights reserved. 13 Middle East and Africa The Middle East andAfrica,combined,have the lowest social network ad spending among the major world regions.eMarketer expects just $37 million to be spent in 2013,representing 3% of digital ad spending in the region. millions, % change and % of digital ad spending Social Network Ad Spending in the Middle East & Africa, 2010-2014 2010 $4.3 287.6% 1.1% 2011 $11.3 163.2% 1.9% 2012 $21.0 84.9% 2.4% 2013 $37.1 76.9% 2.9% 2014 $68.5 84.7% 3.9% Note: includes display, search, video and other forms of paid advertising appearing within social networks, social games and social applications; excludes spending by marketers that goes toward developing or maintaining social network profile pages or branded applications Source: eMarketer, Nov 2012 147575 www.eMarketer.com Social network ad spending % change % of digital ad spending 147575 Social network ad spending per social network user will be just $0.20 next year. Social Network Ad Spending per Social Network User in the Middle East & Africa, 2010-2014 2010 $0.05 179.8% 2011 $0.10 96.7% 2012 $0.14 40.3% 2013 $0.20 43.2% 2014 $0.33 59.5% Note: includes display, search, video and other forms of paid advertising appearing within social networks, social games and social applications; excludes spending by marketers that goes toward developing or maintaining social network profile pages or branded applications Source: eMarketer, Nov 2012 147576 www.eMarketer.com % change Social network ad spending per social network user 147576 Although the ad dollars are low, social network usage in the Middle East and Africa is quite high among web users. eMarketer estimates that 181 million people in the region will use a social network in 2013, representing three out of four of its internet users. This strong penetration rate makes social networks an ideal place for marketers to reach consumers. Moreover, the Middle East and Africa have illustrated how social networks can help people unite to create change and influence offline behavior. That said, internet access in the region is very limited outside of urban centers, and many users access social networks via mobile devices, where the advertising options are more limited. However, with total digital ad spending forecast to rise 47.4% in 2013, to $1.24 billion, there is a chance that social networks will siphon off some of that growth.
  • 14. Worldwide Social Network Ad Spending Forecast: Robust Growth Set to Continue Through 2014 Copyright ©2012 eMarketer, Inc. All rights reserved. 14 Conclusions Ad spending on social networks will continue to grow at a rapid pace. Social network users are only going to increase in number. Marketers will continue to follow social networkers as users connect with each other around the world. The majority of worldwide social network ad spending will be invested in Facebook. However, Twitter, LinkedIn, social games and other social networks will make up a large portion of spending. Revenues will increase as these sites bolster their international audiences. Social network ad spending is markedly diverse among the different regions. While North America leads in spending and Western Europe and Asia-Pacific follow, marketers in Eastern Europe, Latin America, and the Middle East and Africa still spend very little on social network advertising. North America will continue to account for the bulk of worldwide social network ad spending through 2014. Though the US will slowly lose share of Facebook,Twitter and LinkedIn worldwide ad revenue throughout the forecast period as international audiences grow, the region’s strong hold on social network spending illustrates just how common social network advertising has become for marketers in the US and Canada. Asia-Pacific is making rapid advances in social network advertising. Social network ad spending in the region, driven by efforts in Japan and China, is set to surpass Western Europe in 2013. China’s microblogging communities in particular are beginning to make inroads at monetizing their audiences. Appendix: Worldwide Social Network Ad Spending Forecast Methodology eMarketer forecasts regional social network ad spending based on the geographic location of the advertiser. By examining the reported revenues from major social network companies, the long-term patterns of revenue growth or loss, and viewing those figures through the lens of current ad spending trends and marketers’ future intentions, eMarketer is able to develop its projections. Major players. We begin to estimate the size and growth curve of the social network ad market by tracking the reported revenues from Facebook and LinkedIn, which are public companies. We also analyze revenue at Twitter, as well as revenues at several dozen international social networks, social game developers and social app companies. Other research firms. Several researchers project social network or social media ad revenues and/or revenues for individual social network companies. eMarketer aggregates these projections; the details behind how other researchers come to their numbers help to inform eMarketer’s forecasting process. Other available data. We consider data on marketer usage, consumer usage and incomes by region, ad impressions, and ad pricing by region and country as part of our model. Interviews with industry executives. We conduct interviews with executives at ad agencies, marketers and social networks to gain perspective on the development of the social network advertising business as a whole, as well as the revenues for individual companies.
  • 15. Worldwide Social Network Ad Spending Forecast: Robust Growth Set to Continue Through 2014 Copyright ©2012 eMarketer, Inc. All rights reserved. 15 Related eMarketer Reports UK Digital Advertising: Spending and Trends US Ad Spending Forecast: Fall 2012 Update The Global Media Intelligence Report Digital Ad Spending in Mexico: Advertising Giants Finally Join the Pioneers China Digital Media: Usage and Marketing Trends Editorial and Production Contributors Nicole Perrin Associate Editorial Director Cliff Annicelli Senior Copy Editor Emily Adler Copy Editor Dana Hill Director of Production Joanne DiCamillo Senior Production Artist Stephanie Gehrsitz Production Artist Allie Smith Director of Charts
  • 16. The world’s go-to source for information on digital marketing, media and commerce. In the fast-paced digital world, it is neither prudent nor professional to make business decisions based solely on a single source. eMarketer helps companies minimize risk and maximize opportunity by providing… COLLECTIVE WISDOM COVERAGE See all aspects of what is happening today in digital marketing, media and commerce. COLLECTION Information is gathered from thousands of research sources around the globe and hundreds of interviews with industry professionals a month. CURATION eMarketer sifts through the clutter, vets data for accuracy and distills information to its essential intelligence – to save you time. COMPARISON Side-by-side source comparison charts display all relevant information on a topic in one place. CONTEXT Focused, clear and concise, eMarketer reports provide a quick, complete picture of fast-changing digital trends to make sense of complex issues. CONVENIENCE The information you need is accessible 24/7 from your PC, laptop, tablet or smartphone—and downloadable in PDF, Excel, JPEG or PowerPoint formats. CONFIDENCE For 15 years, eMarketer has been recognized as the standard for media coverage of the digital world—cited more than 4,000 times in the New York Times and Wall Street Journal alone—and relied on by major brands and advertising agencies around the globe. COMPETITIVENESS No one in business wants to be surprised, so see the trends coming and make certain your organization always has the latest, most accurate and comprehensive digital information available—with an eMarketer Corporate Subscription. To schedule a conversation or customized demonstration, go to eMarketer.com or call 212-763-6010