1. For more information on MubasherTrade, please visit our website at www.MubasherTrade.com or contact us at
Research@MubasherTrade.com. Please read the important disclosure and disclaimer at the end of this document.
Page 1
Telecom Egypt (TE)
Egypt
Equities | Telecoms | Initiation of Coverage
Monday, 7 November 2016
Calling for integration —
Initiate with Hold/Moderate Risk
Hold
Moderate Risk
Price Target: EGP10.95
ETR: +17.5%
Source: Company reports, MubasherTrade Research estimates
Despite economic challenges, many factors fuel
sustainable demand for telecom services: Egypt
has the largest population in the Middle East
exceeding 90mn with 75% of inhabitants under 40
years, tending to be tech-savvy. Despite current
economic challenges, the continuously-evolving
services, relatively lower penetration rates in the
MENA region, and new technologies (such as
4G/LTE) would support the sector growth. This will
support demand for telecoms, which are
considered basic services for all income segments.
The Egyptian government plans to implement mega
national projects, and residential expansions
should also nourish demand for telecom and data
services. Moreover, recently-offered 4G
frequencies will enable operators to provide high-
speed communications, which will further support
demand for and usage of data services.
Yet, Telecom Egypt faces challenges from foraying
in the mobile business: Telecom Egypt ‘TE’
(ETEL.EGX) has long been eager to acquire the 4G
license to become an integrated telecom operator
by introducing mobile telecom services. ETEL
agreed on license terms and paid EGP5.2bn, yet we
believe that the company will face significant
challenges in rolling out its 4G services, mainly due
to its huge capex, license fees, and currently-high
mobile penetration exceeding 110%.
Initiate with Hold/Moderate Risk; PT EGP10.95
(ETR +17.5%): We used two valuation models to
value ETEL: (1) Discounted cash flow (DCF),
resulting in EGP8.34/share, of which the mobile
business was valued at negative EGP3.03/share,
and (2) Multiples valuation based on 2016e
EV/EBITDA, resulting in a fair value of
EGP11.02/share (after a 20% discount on multiple).
We assigned 80%/20% weights to both models,
respectively, reaching a fair value of EGP8.87/share,
implying a one-year price target (PT) of
EGP10.95/share (ETR +17.5%). Hence, we initiate
coverage on ETEL with a Hold/Moderate Risk rating.
Valuation of VFE: In view of introducing its 4G
mobile services, ETEL could consider selling its
c.45% stake in VFE to avoid any ‘conflict of interest
and asset duplication’. We valued ETEL’s stake in
VFE based on the average of our estimated
acquisition value and the multiples valuation of
VFE.
1) We estimated the acquisition value of VFE, using
acquisition EV/EBITDA and EV/revenues
multiples of 5.1x and 2.0x, respectively, reaching
an equity value of ETEL’s stake at EGP11.3bn.
2) We based our multiples valuation on 2016e
MENA PER and EV/EBITDA of 12.5x and 4.8x,
respectively, to reach an average equity value of
EGP14.7bn.
Thus, we reached an average valuation of ETEL's
stake in VFE at EGP13.0bn (EGP7.59/ETEL share),
while we expect that the after-tax proceeds from
selling VFE would reach EGP12.5bn.
• Integrating its monopolistic wholesale services in Egypt with its 4G mobile business.
• Leading Egypt’s internet market through its fully-owned largest provider ‘TE Data’.
• Yet, facing challenges from stiff competition, huge capex, and license payments.
• Huge needed funds to pressure profitability, liquidity, and dividend payout.
• A probable sale of its c.45% stake in Vodafone Egypt ‘VFE’ can unlock hidden value that
may ease the liquidity pressure on TE.
• Initiate with Hold; PT EGP10.95 (ETR: +17.5%), including –ve EGP3.03 for mobile business.
Ahmed Ramadan
Equity Analyst
Mubasher International
Ahmed.Ramadan@MubasherFS.com
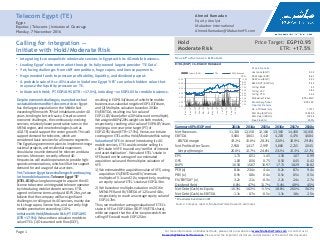
Summary KPIs (EGP mn) 2013a 2014a 2015a 2016e 2017e 2018e
Net Revenues 11,138 12,158 12,184 13,366 14,468 16,168
EBITDA 3,684 3,841 3,442 4,283 4,476 4,684
EBITDA margin 33.1% 31.6% 28.2% 32.0% 30.9% 29.0%
Net Profits After Taxes 2,958 1,417 2,997 3,086 2,215 2,045
Net profit margin 26.6% 11.7% 24.6% 23.1% 15.3% 12.7%
EPS 1.71 0.51 1.45 1.50 1.07 0.99
DPS 1.00 0.56 0.75 0.50 0.45 0.42
BVPS 16.58 15.67 16.97 17.71 18.29 18.82
PER (x) 8.6x 23.4x 4.4x 6.2x 8.7x 9.4x
PBV (x) 0.9x 0.8x 0.4x 0.5x 0.5x 0.5x
EV/EBITDA* (x) 3.2x 2.1x -0.3x 2.2x 2.4x 2.7x
Dividend Yield 6.8% 4.7% 11.7% 5.4% 4.9% 4.5%
Net Debt (Cash)-to-Equity -16.3% -10.2% -5.5% 18.6% 26.5% 36.1%
Net Debt (Cash)-to-EBITDA -1.3x -0.7x -0.5x 1.3x 1.8x 2.5x
*EV excludes investment in VFE
Stock Performance & Details
ETEL (EGP) vs. EGX30 Rebased
Sto ck D etails
Last price (EGP) 9.32
52-W High (EGP) 10.60
52-W Low (EGP) 5.50
6M -ADVT (EGPmn) 17.49
%Chg: M oM 4.3
%Chg: YoY 38.5
%Chg: YTD 45.2
M ubasher Ticker ETEL.EGX
Bloomberg Ticker ETEL EY
C apital D etails
No. of Shares (mn) 1,707.1
M kt Cap (EGPmn) 15,909.9
M kt. Cap (USDmn) 1,034.6
Free Float (%) 20.0%
-
1.00
2.00
3.00
4.00
5.00
6.00
7.00
8.00
9.00
10.00
0.00
2.00
4.00
6.00
8.00
10.00
12.00
Nov-15
Dec-15
Jan-16
Feb-16
Mar-16
Apr-16
May-16
Jun-16
Jul-16
Aug-16
Sep-16
Oct-16
Volume (RHS) ETEL EGX30 Rebased
mn
2. For more information on MubasherTrade, please visit our website at www.MubasherTrade.com or contact us at
Research@MubasherTrade.com. Please read the important disclosure and disclaimer at the end of this document.
Page 2
Telecom Egypt | Egypt | Initiation of Coverage
Monday, 7 November 2016
Telecom Egypt (ETEL) is an 80% state-owned telecom incumbent
in Egypt and the largest provider of fixed-line services in the
Middle East with more than 6.3mn customers by end of Q2 2016.
ETEL offers a full range of fixed-line services in addition to retail
and wholesale telecom services. The company provides retail
services including access, local, long distance and international
voice calls, internet and data, and other services.
Before the acquisition of its 4G license, ETEL has been indirectly
involved in the mobile market in Egypt through its current 44.95%
holding in Vodafone Egypt (VFE), the leading mobile operator in
Egypt, with a subscriber base of 39.8mn by end of June 2016.
In the internet market, ETEL fully owns TE Data, the largest
internet services provider (ISP) in Egypt, with a market share of
77% and 3.2mn subscribers by end of Q2 2016.
ETEL had launched its successful IPO in 2005 by floating 20% of its
issued shares (or 341.4mn shares) locally on the Egyptian
Exchange (EGX) and in GDRs on London Stock Exchange (LSE) with
a total value of EGP5.13bn.
Corporate Profile
Board of directors structure Shareholder structure
TE Data is Egypt's largest internet
and data transfer service provider.
The company was established in
late 2001. TE Data has a 77%
market share with a subs base of
3.2mn at end of June 2016. TE Data
also owns operations in Jordan. TE
Data’s portfolio includes
narrowband and broadband
internet access services, managed
dedicated internet access services,
and IP VPN connectivity services.
TE Data Jordan is a Jordanian
registered ISP. It was established in
April 2004 and is fully owned by TE
Data. Jordan has a growing data
market where internet penetration
reached 76% or 6.2mn internet
users.
Vodafone Egypt (VFE), a subsidiary of
UK-based Vodafone Group, is Egypt’s
leading mobile network operator.
VFE (previously known as Misrfone
Telecom Co./Click GSM) entered the
Egyptian telecom market as the
second operator via a consortium
between Vodafone International,
AirTouch, and local and international
partners. ETEL currently owns a
44.95% stake in VFE which has a
market share of 41% with a subs base
of 39.8mn.
Source: Company reports
Subsidiaries & affiliates
Source: Company reports
Government
of Egypt
80%
Free Float
20%
Telecom
Egypt (TE)
TE France was established in
September 2008. It is a licensed
operator established to land ETEL's
100% owned submarine cable
system (TE North) in Marseille and
provide networks and
telecommunications services in
France.
TE Investment Holding was
established in 2009 to identify and
promote suitable investment
opportunities in both local and
international markets. The
company is also responsible for
investing in companies involved in
businesses related to ETEL and its
subsidiaries.
100% 100% 45% 100% 100%
3. For more information on MubasherTrade, please visit our website at www.MubasherTrade.com or contact us at
Research@MubasherTrade.com. Please read the important disclosure and disclaimer at the end of this document.
Page 3
Telecom Egypt | Egypt | Initiation of Coverage
Monday, 7 November 2016
Corporate Profile (Cont.’d)
Operations key milestones
Source: Company reports
Xceed was established in 2001 to serve as the IT arm of ETEL with a client base of more than 11mn
subs. Xceed is a global provider of quality, multi-lingual business process outsourcing (BPO) services.
Xceed offers integrated customer care, technical support and associated back-office processing to
commercial and governmental clients worldwide. Headquartered in Cairo’s technology park, The
Smart Village, Xceed currently has four sites within Egypt. Xceed has an additional contact center
geographically and culturally proximate to Europe at Morocco's technology park, CasaNearshore Park.
Centra Technologies was established in 2002. Its core business is to provide complete IT solutions and
produce different models of a local brand platform of PCs, servers and notebooks of international
quality, supported by after-sale services through a network of authorized and certified service
centers.
Middle East Radio Communication (MERC) was established in 2001 as a joint stock company. MERC is
a leading company in the field of building, operating, and managing wireless communications
stations. MERC has obtained a license from National Telecom Regulatory Authority (NTRA). MERC
produces designs and operates various types of programs and computer systems, in addition to
developing software, operating systems and integrated systems, data entry on computers using
electronic methods, establishing database and electronic information system, and producing
electronic contents in different forms, such as voice, image, and data.
1918
•The Egyptian government nationalized Eastern Telephone Company and turned it
into Telephones & Telegraph Authority, a forerunner of TE.
1985
•Operating the first fiber-optic cable connecting Cairo’s telephone systems.
1992
•Launching internet services in Egypt.
2001
•ETEL established TE Data with a ‘Class A’ license.
2003
•ETEL acquired an 8.6% stake in VFE.
2004
•TE Data established TE Data Jordan to extend its services in the neighboring country.
2005-2008
•ETEL's stake in VFE rose to 25.5%.
•ETEL accumulated 44.95% ownership stake in VFE.
2011
•TE North Cable was launched.
•TE Data surpassed one million subs.
2014-2016
•MCIT awarded the integrated license to ETEL for EGP2.5bn without new frequencies,
then ETEL was awarded 4G frequencies with mobile license at EGP7bn.
100%
51%
100%
Subsidiaries & affiliates (Cont.’d)
4. For more information on MubasherTrade, please visit our website at www.MubasherTrade.com or contact us at
Research@MubasherTrade.com. Please read the important disclosure and disclaimer at the end of this document.
Page 4
Telecom Egypt | Egypt | Initiation of Coverage
Monday, 7 November 2016
Valuation
Source: MubasherTrade Research estimates
Sum-of-the-parts valuation (EGP/Share)
Investment Rationale
Growth drivers of the telecom industry
• Vast population tends to be tech-savvy.
• Sustainable demand for telecom services despite
economic challenges.
• 4G rollout and introducing LTE technology will
support sector growth.
• Ongoing demand for data, specifically high-speed
fixed broadband.
• Residential and business expansions support
fixed-line and ADSL growth.
Company’s strengths
• Solely providing telecom wholesale services in
Egypt, such as transmission and international
interconnection services.
• Owning the leading ISP in Egypt, TE Data, with
3.2mn subs, implying a market share of 77%.
• Holding a significant c.45% stake in VFE, the
largest MNO in Egypt in terms of subs and
revenues.
• Providing international gateway services, which is
required for passing international calls. MNOs
prefer to lease ETEL's infrastructure as a
commercial option than owning their own
international license.
• Fiber optic network rollout allows more
operational capabilities and higher speeds for
data transmission.
• Government support, given a major stake of 80%
in ETEL.
• A low debt burden and a high cash position would
support ETEL in its investments in mobile
business.
Key Risks
• Introducing mobile services in a very competitive
and almost saturated market with a high
penetration rate of 110%.
• Facing competition from MNOs in providing fixed-
line services.
• High frequencies and mobile license cost exceed
EGP7bn. The massive funds needed for its mobile
business will be reflected on a high debt leverage.
• ETEL might be obliged to sell its stake in VFE, the
leading MNO in terms of subs and revenues, to
avoid any conflicts of interest.
• Fixed-mobile substitution (FMS) phenomenon
results in ARPU erosion and decreasing fixed-line
subs.
• Facing disputes with MNOs, regarding
interconnection and termination rates. ETEL’s
dispute with Orange Egypt reached c.EGP652mn.
• OTT* applications threaten the viability of ETEL’s
international gateway.
* Over-the-top (OTT) applications are apps or services that
provide products over the internet and bypass traditional
distribution, such as Viber, WhatsApp and Facebook calls.
Initiate with Hold/Moderate Risk; PT
EGP10.95 (ETR +17.5%): Using our two
valuation models (DCF and multiples) and
assigning 80%/20% weights to both models,
respectively, we reached a weighted-average
one-year PT of EGP10.95/share. This implies
an ETR of only +17.5%, within our Hold rating
range. Thus, we initiate coverage on ETEL
with Hold/Moderate Risk rating.
DCF – EGP8.34/share: Our projection
assumptions include the mobile services,
which we expect to be launched in 2017, in
addition to payments for the 4G license and
frequencies. Although we believe the mobile
data market still has room for growth, we
valued ETE’s mobile business at negative
EGP3.03 per ETEL share.
We discounted ETEL's free cash flow to the
firm (FCFF) using a weighted average cost of
capital (WACC) of 17.3% on average. We
calculate COE as 23.4% based on the
following assumptions:
• US 10-year Treasury yield of 1.8%.
• Inflation differential (between Egypt and
USA) of 10.8%.
• Adjusted 5-year monthly beta of 0.8.
• US equity risk premium (ERP) of 6.4%,
Egypt country risk premium (CRP) of 5.7%
as implied by its credit default spread
(CDS) of 4.4%, levered up by 30% to
account for inherent volatility in equity
returns.
• Terminal WACC and terminal growth rate
of 15.4% and 2.5%, respectively.
Multiples – EGP11.02/share: We applied a
20% discount to MENA 2016e EV/EBITDA
median of 4.8x, reaching a fair value of
EGP11.02/share. We note that ETEL’s 2016e
EBITDA includes only non-mobile businesses.
9.32
3.78
8.34
11.02
8.87
10.95
7.59
(3.03)
Market price
FV of fixed-line business
FV of investment in VFE
FV of mobile business
Fair value - DCF
FV @ EV/EBITDA
Weighted average FV
12M price target
5. For more information on MubasherTrade, please visit our website at www.MubasherTrade.com or contact us at
Research@MubasherTrade.com. Please read the important disclosure and disclaimer at the end of this document.
Page 5
Telecom Egypt | Egypt | Initiation of Coverage
Monday, 7 November 2016
Valuation (Cont.’d)
Source: MubasherTrade Research estimates
Unit 2014a 2015a 2016e 2017e 2018e 2019e 2020e 2021e 2022e
7-Year CAGR
(2015-2022)
Retail Revenues (Excl. Mobile) EGP mn 5,029 5,474 6,435 7,195 7,786 8,386 8,996 9,632 10,262 9.4%
Wholesale Revenues EGP mn 7,129 6,710 6,932 7,105 7,271 7,424 7,569 7,715 7,858 2.3%
Mobile Revenues EGP mn - - - 168 1,111 1,920 2,599 3,185 3,709
Revenues EGP mn 12,158 12,184 13,366 14,468 16,168 17,731 19,163 20,531 21,830 8.7%
YoY Growth % 9.2% 0.2% 9.7% 8.2% 11.7% 9.7% 8.1% 7.1% 6.3%
EBITDA EGP mn 3,841 3,442 4,283 4,476 4,684 5,385 5,950 6,437 6,854 10.3%
EBITDA margin % 31.6% 28.2% 32.0% 30.9% 29.0% 30.4% 31.1% 31.4% 31.4%
EBIT EGP mn 2,248 1,853 2,384 2,029 2,164 2,726 3,280 3,584 3,842 11.0%
EBIT Margin % 18.5% 15.2% 17.8% 14.0% 13.4% 15.4% 17.1% 17.5% 17.6%
Net Profits After Taxes EGP mn 1,417 2,997 3,086 2,215 2,045 2,120 2,251 2,247 2,263 -3.9%
2014a 2015a 2016e 2017e 2018e 2019e 2020e 2021e 2022e
EBIT 2,248 1,853 2,384 2,029 2,164 2,726 3,280 3,584 3,842
Taxes on EBIT (506) (417) (536) (457) (487) (613) (738) (806) (864)
Depreciation & Amortization 1,592 1,589 1,899 2,447 2,520 2,660 2,670 2,854 3,013
Capex on retail & wholesale business (2,151) (3,142) (3,074) (3,180) (3,233) (3,274) (3,303) (3,326) (3,336)
Capex on mobile business - - (269) (721) (1,101) (964) (840) (725) (625)
4G License payments - - (5,200) (470) (470) (470) (470) - -
Change in Working Capital 305 (189) (452) (190) (354) (304) (258) (232) (215)
FCFF 1,488 (307) (5,249) (541) (961) (240) 340 1,347 1,813
PV of FCFF (5,106) (439) (656) (138) 167 560 642
Terminal value (end of 2032) - based on TGR 17,536
2016e 2017e 2018e 2019e 2020e 2021e 2022e
Adjusted Beta 0.81 Equity weight 73.2% 65.2% 57.3% 51.7% 47.4% 44.5% 42.2%
US ERP 6.4% Debt weight 26.8% 34.8% 42.7% 48.3% 52.6% 55.5% 57.8%
Country Risk Premium 5.7% Total 100.0% 100.0% 100.0% 100.0% 100.0% 100.0% 100.0%
Cost of Equity (CoE) 23.4%
Aftr Tax Cost of Debt (AT CoD) 13.0% AT CoD 13.0% 13.0% 13.0% 13.0% 13.0% 13.0% 13.0%
Terminal Growth Rate 2.5% WACC 20.6% 19.8% 19.0% 18.4% 17.9% 17.6% 17.4%
Terminal ROIC 8.4% ROIC 11.0% 6.6% 6.4% 7.4% 8.2% 8.4% 8.6%
Terminal WACC 15.4%
All figures in EGP mn except per share numbers
DCF Valuation Multiples Valuation
Sum of PV of FCFF (2016-2032) (490) MENA 2016e EV/EBITDA median 4.8x
Discount 20% 8.0% 9.0% 10.0% 11.0% 12.0%
PV of Terminal Value 1,372 2016e EBITDA 4,283 12.0% 9.82 9.26 8.61 7.86 6.99
Enterprise Value 882 Enterprise Value 16,580 12.5% 9.67 9.11 8.47 7.74 6.89
Total Debt (2015) (389) Total Debt (2016) (5,821) 13.0% 9.52 8.97 8.34 7.62 6.79
Excess Cash (2015) 1,978 Excess Cash (2016) 187 13.5% 9.37 8.83 8.21 7.50 6.69
Other investments 99 Other Investments 99 14.0% 9.23 8.70 8.09 7.40 6.60
FV of Investment in VFE 12,955 FV of Investment in VFE 12,955
Minority Interest (2015) (10) Minority Interest (2016) (10)
Dividends distributed in 2016 (1,280) FV of mobile business (5,171) 18.7% 21.1% 23.4% 25.7% 28.1%
Equity value 14,233 Target equity value 18,818 1.5% 9.36 8.85 8.40 8.00 7.66
No. of shares 1,707 Implied Fair Value - EV/EBITDA 11.02 2.0% 9.32 8.81 8.37 7.98 7.64
Fair value - DCF 8.34 Weight of DCF Valuation 80.0% 2.5% 9.28 8.78 8.34 7.95 7.61
Weight of Multiples Valuation 20.0% 3.0% 9.24 8.74 8.30 7.92 7.59
12-month price target (PT) 10.95 Weighted Average Fair Value 8.87 3.5% 9.19 8.69 8.26 7.89 7.56
Cost of equity
Growth
KPIsPVofFCFFCalculation
Valuation
Assumptions
After-tax
costofdebt
Estimated Annual EGP Devaluation
FairValue
6. For more information on MubasherTrade, please visit our website at www.MubasherTrade.com or contact us at
Research@MubasherTrade.com. Please read the important disclosure and disclaimer at the end of this document.
Page 6
Telecom Egypt | Egypt | Initiation of Coverage
Monday, 7 November 2016
Valuation (Cont.’d)
Source: MubasherTrade Research estimates
Valuation of mobile business
Unit 2016e 2017e 2018e 2019e 2020e 2021e 2022e 2023e 2024e
7-Year CAGR
(2017-2024)
Total Mobile Subs mn 99.0 109.3 118.0 125.3 131.4 137.0 142.2 145.1 148.0 4.4%
Mobile Penetration % 110% 119% 126% 131% 135% 138% 140% 140% 140%
ETEL Mobile Subs mn - 2.1 4.7 6.9 8.7 10.4 11.9 12.8 13.7 31.0%
ETEL Mobile Market share % 1.9% 4.0% 5.5% 6.6% 7.6% 8.4% 8.8% 9.2%
Blended ARPU EGP - 29.1 29.5 29.8 29.9 29.9 29.8 29.6 29.5 0.2%
YoY Growth % 1.5% 1.0% 0.5% 0.0% -0.5% -0.5% -0.5%
Revenues EGP mn - 180 1,195 2,065 2,794 3,424 3,989 4,398 4,681 59.3%
Annual fees from mobile revenues EGP mn (13) (84) (145) (196) (240) (279) (308) (328)
Net Revenues EGP mn - 168 1,111 1,920 2,599 3,185 3,709 4,090 4,353 59.3%
YoY Growth % 562.9% 72.9% 35.3% 22.6% 16.5% 10.3% 6.4%
EBITDA EGP mn - (67) (56) 480 909 1,274 1,595 1,798 1,898
EBITDA margin % -40.0% -5.0% 25.0% 35.0% 40.0% 43.0% 44.0% 43.6%
Depreciation EGP mn (40) (76) (158) (223) (272) (308) (334) (350)
Amortization EGP mn (118) (472) (472) (472) (472) (472) (472) (472) (472)
EBIT EGP mn (118) (579) (604) (150) 215 530 815 993 1,076
EBIT Margin % -345.3% -54.3% -7.8% 8.3% 16.6% 22.0% 24.3% 24.7%
2016e 2017e 2018e 2019e 2020e 2021e 2022e 2023e 2024e
EBIT (118) (579) (604) (150) 215 530 815 993 1,076
Taxes on EBIT - - - - (48) (119) (183) (223) (242)
Depreciation & Amortization 118 512 548 630 695 744 780 806 822
Capex on mobile business (269) (721) (1,101) (964) (840) (725) (625) (536) (458)
4G License payments (5,200) (470) (470) (470) (470) - - - -
Change in Working Capital (5) (33) (58) (78) (96) (111) (123) (131)
FCFF (5,469) (1,263) (1,660) (1,011) (527) 334 675 916 1,067
PV of FCFF (5,469) (1,077) (1,207) (627) (279) 151 260 300 298
Terminal value (end of 2032) - based on TGR 10,559
Debt weight 59%
Equity weight 41%
Total 100%
AT CoD 13.0%
CoE 23.4%
WACC 17.3%
IRR 8.1%
All figures in EGP mn except per share numbers (3.03) 15.3% 16.3% 17.3% 18.3% 19.3%
Sum of PV of FCFF (2016-2032) (5,996) 0.5% (2.66) (2.90) (3.10) (3.26) (3.40)
PV of Terminal Value 825 1.5% (2.61) (2.86) (3.06) (3.24) (3.39)
Net present value (5,171) 2.5% (2.55) (2.81) (3.03) (3.21) (3.36)
No. of shares 1,707 3.5% (2.48) (2.76) (2.99) (3.18) (3.34)
Fair value - DCF (3.03) 4.5% (2.40) (2.70) (2.94) (3.15) (3.31)
ProjectionAssumptionsPVofFCFFCalculationValuationAssumptions
WACC
Terminal
GrowthRate
7. For more information on MubasherTrade, please visit our website at www.MubasherTrade.com or contact us at
Research@MubasherTrade.com. Please read the important disclosure and disclaimer at the end of this document.
Page 7
Telecom Egypt | Egypt | Initiation of Coverage
Monday, 7 November 2016
Valuation (Cont.’d)
Source: Bloomberg, Companies’ data, and MubasherTrade Research estimates
Valuation of investment in VFE
Valuation of VFE based on recent transaction multiples
(EGP mn) TV/Revenues TV/EBITDA
VIVA / STC 2.0x 4.1x
OTMT / Orange Egypt 2.0x 6.2x
Average multiples 2.0x 5.1x
VFE 2016 Revenues 16,017
VFE 2016 EBITDA 6,959
EV based on average TV/Revenues 31,554
EV based on average TV/EBITDA 35,737
Average EV 33,645
2016 MENA Net Debt/EBITDA 1.2x
Estimated VFE net debt (8,610)
VFE Equity Value 25,035
ETEL's stake in VFE 44.95%
ETEL's Estimated Equity Value in VFE 11,253
Valuation of VFE based on MENA Peers multiples
(EGP mn)
2016e MENA PER 12.5x
VFE's 2016 Estimated Earnings After Tax 3,203
Estimated Equity Value (Based on PER) 40,143
2016e MENA EV/EBITDA 4.8x
VFE's 2016 Estimated EBITDA 6,959
Estimated Enterprise Value 33,678
Estimated net debt for VFE (8,610)
Estimated Equity Value (Based on EV/EBITDA) 25,067
Average Estimated Equity Value 32,605
ETEL's stake in VFE 44.95%
ETEL's Estimated Equity Value in VFE 14,656
Average valuation of ETEL's stake in VFE 12,955
Cost of ETEL's Investment in VFE 10,583
Expected capital gain 2,372
Tax rate on capital gain 20.0%
Taxes on capital gain 474
Estimated after-tax proceeds from selling VFE 12,480
9. For more information on MubasherTrade, please visit our website at www.MubasherTrade.com or contact us at
Research@MubasherTrade.com. Please read the important disclosure and disclaimer at the end of this document.
Page 9
Telecom Egypt | Egypt | Initiation of Coverage
Monday, 7 November 2016
Financial Summary
Balance Sheet (EGP mn) Per-Share Data
FY End: December 2013a 2014a 2015a 2016e 2017e 2018e FY End: December 2013a 2014a 2015a 2016e 2017e 2018e
Total cash & short-term investments 5,762 3,810 2,587 855 940 1,051 Price 14.68 11.92 6.42 9.32 9.32 9.32
Accounts receivable, net 3,451 3,749 4,612 4,277 4,630 5,174 # Shares (mn) 1,707.1 1,707.1 1,707.1 1,707.1 1,707.1 1,707.1
Inventories 459 438 557 606 657 728 EPS 1.71 0.51 1.45 1.50 1.07 0.99
Other Current Assets 1,396 1,497 1,412 1,738 1,881 2,102 DPS 1.00 0.56 0.75 0.50 0.45 0.42
Total current assets 11,067 9,494 9,167 7,476 8,108 9,054 BVPS 16.58 15.67 16.97 17.71 18.29 18.82
Net property, plant and equipment 11,637 12,280 13,917 15,554 17,549 19,898
Goodwill & Other intangible assets 954 1,046 933 7,820 7,280 6,745 Valuation Indicators
Equity and other investments 8,693 9,474 10,561 11,960 13,467 15,073 FY End: December 2013a 2014a 2015a 2016e 2017e 2018e
Total assets 32,350 32,293 34,578 42,810 46,403 50,770 PER (x) 8.6x 23.4x 4.4x 6.2x 8.7x 9.4x
Short-term debt 107 84 62 5,556 8,294 11,710 PBV (x) 0.9x 0.8x 0.4x 0.5x 0.5x 0.5x
Accounts Payable 176 214 330 312 338 375 EV/Sales* (x) 1.1x 0.7x -0.1x 0.7x 0.7x 0.8x
Other Current Liabilities 3,588 4,284 4,877 4,542 4,928 5,459 EV/EBITDA* (x) 3.2x 2.1x -0.3x 2.2x 2.4x 2.7x
4G License Payable - - - 1,880 1,410 940 Dividend Payout Ratio 58.5% 109.7% 51.6% 33.4% 42.3% 42.3%
Total current liabilities 3,871 4,582 5,269 12,290 14,970 18,483 Dividend Yield 6.8% 4.7% 11.7% 5.4% 4.9% 4.5%
Long-term debt 475 383 327 264 202 139
Other non-current liabilities 29 572 17 17 13 12 Profitability & Growth Ratios
Total long term liabilities 504 954 344 282 215 152 FY End: December 2013a 2014a 2015a 2016e 2017e 2018e
Net Paid in capital 17,071 17,071 17,071 17,071 17,071 17,071 Revenue Growth 11.0% 9.2% 0.2% 9.7% 8.2% 11.7%
Total Reserves & Retained Earnings 11,229 9,687 11,893 13,167 14,147 15,065 EBITDA Growth -1.3% 4.3% -10.4% 24.4% 4.5% 4.6%
Shareholders' equity 28,299 26,758 28,964 30,238 31,218 32,135 EPS Growth 15.1% -70.3% 185.5% 3.0% -28.2% -7.7%
Total equity and liabilities 32,675 32,293 34,578 42,810 46,403 50,770 EBITDA Margin 33.1% 31.6% 28.2% 32.0% 30.9% 29.0%
Net Profit Margin 26.3% 7.1% 20.4% 19.1% 12.7% 10.5%
Income Statement (EGP mn) ROAE 10.4% 3.2% 8.9% 8.6% 6.0% 5.3%
FY End: December 2013a 2014a 2015a 2016e 2017e 2018e ROAA 9.0% 2.7% 7.4% 6.6% 4.1% 3.5%
Net Revenues 11,138 12,158 12,184 13,366 14,468 16,168
Cost of revenues (2,903) (2,991) (3,206) (3,028) (3,286) (3,639) Liquidity & Solvency Multiples
EBITDA 3,684 3,841 3,442 4,283 4,476 4,684 FY End: December 2013a 2014a 2015a 2016e 2017e 2018e
Depreciation & Amortization (1,695) (1,592) (1,589) (1,899) (2,447) (2,520) Net Debt/(Cash) (4,622) (2,736) (1,588) 5,634 8,279 11,607
EBIT 1,989 2,248 1,853 2,384 2,029 2,164 Net Debt (Cash)-to-Equity -16.3% -10.2% -5.5% 18.6% 26.5% 36.1%
Non-operating income/(expenses) 1,442 763 977 1,184 381 (2) Net Debt (Cash)-to-EBITDA -1.3x -0.7x -0.5x 1.3x 1.8x 2.5x
Net Profits Before Taxes 3,431 3,011 2,830 3,568 2,411 2,162 Debt-to-Capital 2.0% 1.7% 1.3% 16.1% 21.4% 26.9%
Extraordinary items & minority interest 320 69 123 (3) (2) (2) Current Ratio 2.9x 2.1x 1.7x 0.6x 0.5x 0.5x
Net Profits After Taxes 2,958 1,417 2,997 3,086 2,215 2,045
Consensus Estimates
Cash Flow Statement (EGP mn) FY End: December 2016e 2017e 2018e
FY End: December 2013a 2014a 2015a 2016e 2017e 2018e Revenues 12,916 13,328 14,291
Net Cash From Operating Activities 1,925 3,355 2,743 5,229 3,616 3,743 MubasherTrade Research vs. Consensus 3.5% 8.6% 13.1%
Net Cash used in Investing Activities (629) (3,274) (2,161) (10,396) (3,886) (4,312) Net Income 3,199 2,893 3,230
Net Cash used in Financing Activities (2,031) (3,078) (886) (2,131) (2,468) (2,846) MubasherTrade Research vs. Consensus -3.5% -23.4% -36.7%
Net Change in Excess Cash (735) (2,997) (304) (7,298) (2,738) (3,416) PER (x), MTR Price Target 7.3x 10.2x 11.0x
PBV (x), MTR Price Target 0.6x 0.6x 0.6x
Capex (593) (2,151) (3,142) (3,343) (3,901) (4,334) EV/EBITDA (x), MTR Price Target 2.9x 3.0x 3.3x
* EV excludes investment in VFE a = Actual; e = Estimate
Source: Company data, MubasherTrade Research estimates
10. For more information on MubasherTrade, please visit our website at www.MubasherTrade.com or contact us at
Research@MubasherTrade.com. Please read the important disclosure and disclaimer at the end of this document.
Page 10
Telecom Egypt | Egypt | Initiation of Coverage
Monday, 7 November 2016
Industry Overview
Telecom is a defensive sector by nature with stable demand:
Although Egypt is currently facing monetary and fiscal challenges,
the telecom sector is defensive in nature with sustainable demand
for data and voice services. The Egyptian government is also
implementing mega national projects and expansions, which will
create further demand for telecom services. Telecom sector is
comprised of three segments: fixed line, internet, and mobile
segments.
1. Fixed Line Segment
Fixed telephone lines retreat due to Fixed Mobile Substitution
phenomena: As a result of fixed-mobile substitution (FMS)
phenomenon, Egypt’s fixed-line penetration rate declined from
12.2% (9.6mn subs) in 2010 to 7.0% (6.3mn subs) in June 2016.
Similarly, fixed-line ARPU eroded from EGP26 in 2012 to EGP22 in
June 2016. The change in customer usage from fixed line to
mobile services was helped by the continuous decline of per-
minute prices.
ETEL is no longer the sole fixed-line operator in Egypt: ETEL used
to have an exclusive fixed-line license, serving the largest subs
base in the Middle East. Recently, the Egyptian government
offered fixed-line licenses to the incumbent three MNOs at a cost
of USD11.3mn each. However, MNOs will face a challenge in
introducing such services due to FMS and market saturation. As of
June 2016, the home segment accounted for 82% of total fixed-
line subs (5.2mn subs), with the enterprise segment making up the
remaining 18% (1.1mn subs).
Expected modest growth in fixed lines: We believe that fixe-line
penetration will not reverse its downtrend as we expect that new
subs will only come from new residential and business
expansions. In our forecasts, we expect that the penetration rate
will reach 7.5% in 2022 with a 2.2% 7-year (2015-2022) CAGR in
the number of telephone lines.
2. Internet Segment
Rising demand for data enriches the internet market: Ongoing
demand for data services fuels growth for ISPs. We expect
internet penetration to reach 41.6% in 2016, reflecting a number
of users of 37.5mn. We expect considerable growth in data
business to be supported by Egypt’s tech-savvy youth segment,
the widespread of smartphones and tablets at favorable prices, in
addition to the prospective 4G rollout. Thus, we expect a 9.1% 7-
year CAGR for the internet subs, reaching a penetration of 60% in
2022.
ETEL fully owns the leading ISP in Egypt: ETEL fully owns TE Data,
the leading ISP in Egypt in terms of market share of 77% with subs
base of 3.2mn, whereas the remaining market share is held by
VFE, Link DSL, Etisalat Misr and Noor DSL. The main challenge in
this segment is illegal connections and line sharing phenomena,
which resulted in lower registered numbers of subs. The Egyptian
government is facing this by requesting that ISPs apply discounts
on internet rates. On the other hand, ISPs requested lower rates
of data transmission services provided by ETEL to increase the
number of ADSL subs and maintain margins.
3. Mobile Segment
Competition is to intensify further by the entrance of ETEL as a
4G player: The mobile market is comprised of three operators,
namely Vodafone Egypt (a 42% market share), Orange Egypt
(OREG.EGX) (a 35% market share), and Etisalat Misr (EM) (a 24%
market share). Mobile penetration rate reached its highest level of
118% in 2013 then declined to 110% in 2016 due to cancelling
unregistered SIMs. Total mobile subs grew by a 7-year CAGR
(2008-2015) of 12.5%, recording 94mn in 2015. In 2016, we expect
a 5.3% YoY growth in mobile subs, while we expect a 6% YoY
growth in average mobile ARPU to reach EGP33.5 in 2016. Going
forward, we expect mobile ARPU to grow at a 6-year CAGR (2016-
2022) of 0.11% to be supported by 4G services despite increasing
competition, especially with the introduction of mobile services by
ETEL as a 4G MNO.
ETEL is awarded 4G frequencies and mobile license: ETEL has
been awarded the mobile license and 4G spectrum for EGP7bn in
September 2016. ETEL is supposed to provide 4G services over 6
months from receiving spectrum while the company will provide
3G services virtually through local roaming agreements with other
MNOs. VFE and Orange Egypt also obtained 4G frequencies at
USD335mn and USD484mn, respectively, while EM was offered
the same at USD535.5mn. According to their payment terms, the
four operators will pay 50% of the value in US dollars. Additionally
each mobile operator was offered providing fixed line services
virtually at USD11.3mn.
Source: MCIT and Company reports.
Telecom Evolution
96.8 99.7 95.3 94.0 99.0
109.3
118.0
125.3
131.4 137.0 142.2
26.4
28.1 29.2
31.6
33.5 32.9 33.4 33.7 33.9 33.9 33.7
5
10
15
20
25
30
35
40
0
20
40
60
80
100
120
140
160
2012 2013 2014 2015 2016 2017 2018 2019 2020 2021 2022
mn subs EGPMobile Subs (LHS) and ARPU (RHS)
Mobile Subs Mobile ARPU
8.9% 8.0% 7.3% 7.4% 7.4% 7.4% 7.5% 7.5% 7.5% 7.5% 7.5%
117% 118%
110% 106% 110%
119%
126% 131% 135% 138% 140%
0%
20%
40%
60%
80%
100%
120%
140%
160%
2012 2013 2014 2015 2016 2017 2018 2019 2020 2021 2022
0%
5%
10%
15%
20%
25%
30%
Mobile and Fixed Penetration
Fixed penetration Mobile penetration
6.2 5.7 5.3 5.5 5.5 5.7 5.8 6.0 6.1 6.2 6.3
25.7 25.9 25.4
23.7
21.3 20.1 18.9 17.7 16.4 15.2 14.0
0
5
10
15
20
25
30
35
40
0
2
4
6
8
10
12
14
16
18
20
2012 2013 2014 2015 2016 2017 2018 2019 2020 2021 2022
mn subs EGPHome Fixed Subs (LHS) and Home ARPU (RHS)
Home Fixed Subs Home ARPU
11. For more information on MubasherTrade, please visit our website at www.MubasherTrade.com or contact us at
Research@MubasherTrade.com. Please read the important disclosure and disclaimer at the end of this document.
Page 11
Telecom Egypt | Egypt | Initiation of Coverage
Monday, 7 November 2016
1.1 1.1 1.1 1.1 1.1 1.1 1.2 1.2 1.2 1.2 1.3
76
85
104
97
107 111 115 120 125 130 134
5
25
45
65
85
105
125
145
0.00
0.20
0.40
0.60
0.80
1.00
1.20
1.40
1.60
1.80
2.00
2012 2013 2014 2015 2016 2017 2018 2019 2020 2021 2022
mn subs Enterprise subs (LHS) & Enterprise ARPU (RHS)
Enterprise Fixed Subs Enterprise ARPU
EGP
21.8
25.0 27.5
33.0
37.5
42.2
46.5
50.7
54.4
57.8
60.9
26%
30% 32%
37%
42%
46%
50%
53%
56% 58% 60%
0%
10%
20%
30%
40%
50%
60%
70%
0
10
20
30
40
50
60
70
2012 2013 2014 2015 2016 2017 2018 2019 2020 2021 2022
mn users Internet Users and Penetration
Internet Users Internet Pentration
2.2
2.6
3.0
3.8
4.5
4.8
5.2
5.6
6.0
6.4
6.9
1.4 1.7 2.0
2.8
3.5
3.9
4.3
4.7
5.1
5.5 5.8
61% 63% 65%
74%
79% 81% 83% 84% 85% 85% 85%
0%
20%
40%
60%
80%
100%
0
1
2
3
4
5
6
7
8
9
10
2012 2013 2014 2015 2016 2017 2018 2019 2020 2021 2022
mn subs FBB Subs, TE Data Subs and Market Share
FBB subs TE Data subs TE Data Market Share
ETEL’s business model is comprised of two main business
segments:
Retail segment (45% of total revenues):
• Fixed telephone services to home units and enterprises.
• Fixed broadband services.
• Mobile services.
Wholesale segment (55% of total revenues):
• Transmission services.
• International carrier services.
• International network.
1. Retail segment
Significant erosion of fixed-line business: ETEL was the only
telecom operator that has had a fixed-line license in Egypt since
1881 until offering fixed line licenses to MNOs in October 2016 to
provide such service virtually. ETEL provides fixed-line services to
both home units and enterprises. In Q2 2016, telephone lines to
home units represented 82% of total fixed-line subs, whereas
enterprises hold the remaining 18%. Total fixed-line subs reached
6.3mn, which is considered the largest subs base in the Middle
East. Meanwhile, enterprise ARPU reached EGP110, while home
ARPU reached EGP22. Over the last seven years, fixed-line
penetration rate dropped dramatically from 12% to c.7% due to
the dynamic evolution in the telecom market, which started by
introducing mobile services in Egypt in the late nineties.
Meanwhile, fixed-line ARPU experienced significant erosion from
EGP26 in 2012 to EGP22 in 2016.
ADSL is the main driver for the retail segment: ETEL fully owns TE
Data, the leading ISP in Egypt with a market share of 77% and a
subs base of 3.2mn. TE Data was established in 2001, capitalizing
on ETEL’s infrastructure and data transmission capabilities. TE
Data showed an impressive performance and significant growth in
subs base from 880,000 in 2010 to 3.2mn in June 2016, supported
by ongoing demand for internet services and the vast population
tending to be tech-savvy. The growth was also helped by the
spread out of digital services and on-line applications, taking into
account also the government investment in transforming its
services into online services (e-Government) with digital
platforms. Internet penetration in Egypt reached 39% in June
2016, which is considered lower than the median penetration in
the MENA. Additionally, total market ADSL subs reached 4.1mn in
June 2016 lower than ETEL’s fixed-line subs of 6.3mn which
implies potential ADSL new adds.
Potential new subs from residential expansions: Despite the
stagnant growth of fixed-line penetration, ETEL still has room for
growth from expected new subs from new residential expansions.
We believe the need for fixed-line access is required for at least
having ADSL connection. We also believe an expected recovery in
business activities should reflect positively on subs and ARPU
growth.
Line sharing and illegal connections phenomena negatively affect
ISPs: The main challenge in the ADSL market in Egypt is the line
sharing and illegal connections phenomena. However, the
government is facing this by cutting internet prices. To do so, the
Ministry of Communications obligated ISPs to decrease their
rates, but they asked for discounts on transmission services from
ETEL to maintain their profitability margins. Hence, TE Data took
the initiative by reducing internet prices by 50% for the first six
months of subscription.
Fiber optic cables upgrade TE Data capabilities: The speed of
internet connection is expected to increase by introducing Fiber-
To-The-Home (FTTH). ETEL is currently replacing its copper cables
with fiber optic cables with a target to reach 6mn home units by
end of 2017 (vs. 4mn today). Home units are the bulk of TE Data’s
subs of 3mn compared to 181,000 enterprises. Data revenues
generated from providing internet services to both homes and
enterprises (EGP2.6bn in 2015) contributed considerably to ETEL’s
revenues: 48% of retail revenues and 22% of total revenues.
ETEL expanded regionally by establishing TE Data Jordan: ETEL
had managed to replicate its successful story of TE Data in Egypt
by establishing a regional IP node. In 2004, ETEL established TE
Data Jordan to provide services to neighboring countries and to
grasp opportunities resulting from market liberalization. Internet
penetration reached 76% in Jordan, with 6.2mn internet users,
relatively lower than the comparable markets in MENA region.
Business Model
Source: MCIT, Company reports, and MTRe.
12. For more information on MubasherTrade, please visit our website at www.MubasherTrade.com or contact us at
Research@MubasherTrade.com. Please read the important disclosure and disclaimer at the end of this document.
Page 12
Telecom Egypt | Egypt | Initiation of Coverage
Monday, 7 November 2016
Business Model (Cont.’d)
2. Wholesale segment
ETEL still enjoys a monopoly in wholesale services in Egypt:
ETEL has huge infrastructure capabilities, most importantly an
extended 40,000 km in-land network, which is operationally
required for providing data transmission services to both MNOs
and ISPs. ETEL has the international gateway required to manage
international traffic. Capitalizing on the strategic geographic
position of Egypt, ETEL is involved in strategic international
cables business agreements. The wholesale segment is
comprised of domestic wholesale services, international carrier
affairs and international customers and networks.
In-land telecom infrastructure is the backbone of domestic
wholesale services: Domestic wholesale business depends on
the demand for the national transmission services across ETEL's
extensive network by MNOs and ISPs. Demand growth is driven
by the growth in the transmitted volume in both domestic and
international outgoing mobile traffic and data usage. Domestic
wholesale revenues represented 44% of total wholesale
revenues in 2015 compared to 40% in 2011, rising at a 5-year
CAGR of 5.4%. As a sole provider of transmission services, ETEL
will be positively impacted in case of economic and business
recovery, a nourishing tourism sector, and a booming in data
market. Data services rose rapidly in the last five years, which
was supported by growing domination of smartphones in the
local market.
Exclusive international gateway supports international carrier
affairs business line: The key driver for international carrier
affair (ICA) revenues is ETEL's exclusive international gateway,
which allows the company to manage the international incoming
traffic and mobile interconnection activities. ETEL has more than
70 long-term bilateral commercial agreements with
international operators across all international wholesale voice
activities. The company is also working on exploring new
markets, capitalizing on its global footprint and variety of
international customers.
The commercial agreements with VFE and Orange Egypt secure
EGP15bn revenues from domestic wholesale business: In
January 2015, ETEL had signed long-term commercial
agreements with VFE and Orange Egypt with a total value of
c.EGP15bn to provide international communication and
domestic transmission services. Both agreements are valid for
four years, while infrastructure services will be provided to
Orange Egypt and VFE for five years and three years,
respectively. These agreements indicate that MNOs prefer to
lease ETEL's infrastructure as a commercial option than owning
their own international license.
OTT is a major threat to international gateway’s viability: ETEL
is facing growing threats of illegal bypass combined with the
widespread of over-the-top (OTT) applications. The illegal traffic
phenomenon is considered the main factor that put pressure on
international carrier affairs (ICA) revenues, which represent 44%
of total wholesale revenues. The ICA revenues grew at a 5-year
CAGR of 6%. In an attempt to encounter this, ETEL provides
commercial incentives to local MNOs and exert efforts to stop
the leakage or by deploying detection systems to act as the gate-
keeper and mitigate the leakage. The ICA revenues are also
affected by the pricing pressure by other operators, mainly EM,
which has an international gateway license. Nonetheless, EM
has certain regulations and provisions, managing only inbound
traffic from its related telecom operators, most importantly
Etisalat (ETISALAT.ADX) in the UAE and Mobily (7020.TDWL) in
Saudi Arabia, which are operating in high competitive markets.
Those operators are offering discounts on international calls to
millions of expatriate subs.
ICN business is supported by exponential growth in IP traffic
and unique Egypt’s geographic position: International
customers & networks (ICN) business (12% of wholesale
revenues) depends mainly on intentional cables services. ETEL
participates in seven submarine cables through ‘rights of way’
and ‘rights of use’ in addition to the 100% ownership of TE North
cable, out of 14 cables crossing Egypt. TE North is a submarine
telecommunication cable, which was launched in 2010
linking France to Egypt with a length of 3,100 km and a capacity
of up to 1.28 Tbit/second over eight fiber pairs. The cable is
expanding the international services footprint of ETEL transit
corridor by offering additional transit services in the
Mediterranean. The cable was upgraded in 2011 to utilize a
technology of 40G channels to become the first cable in the
Mediterranean to utilize this technology. TE North has landing
points in Marseille France and Abu Talat, Alexandria, Egypt. The
cable projects revenues are generated from crossing services
and indefeasible right of use (IRUs), which are considered non-
recurring revenues stream. However, ancillary services and
international capacity sales revenues are considered recurring
revenues. ETEL is providing ancillary services including
(operation and maintenance) to the cables having landing points
in Egypt. IP wholesale capacity sales is mainly driven by the
internet traffic, which is growing exponentially due to the
increased demand by broadband and mobile data subs for
internet services, online applications, and media contents. The
Asia-Pacific region is a leading driver of internet traffic growth,
creating a major advantage for the cables linking said region
with Europe and America, mostly through crossing Egypt’s land.
Business outlook & future strategy
ETEL is to finally provide mobile services: Given a stagnant
growth in fixed-line business, ETEL has an ambition to enter the
mobile market, capitalizing on the promising growth opportunity
in mobile data. Currently, ETEL indirectly participate in mobile
market through its 45% ownership stake in VFE; however the
company wanted to directly provide mobile services as an MNO.
In June 2016, MCIT announced a tender to provide mobile
license and 4G frequencies to ETEL at EGP7bn, VFE at
USD335mn, Orange Egypt at USD484mn and EM at
USD535.5mn. MCIT also offered virtually fixed-line licenses to
MNOs at USD11.3mn each. ETEL is supposed to offer its 4G
services after six months from receiving the spectrum, while the
3G services will be provided once ETEL reaches final agreements
with MNOs on local roaming services.
Is the mobile business still viable? ETEL plans to introduce
mobile services raise a questions about the viability of adding
this business in a highly competitive mobile market, which is
approaching saturation with a penetration of 110%. As per the
corporate governance, ETEL should not compete with its
associate (VFE) due to the conflict of interest and assets
duplication. ETEL technically has to own a GSM spectrum based
on 4G technology and install mobile infrastructure, including
mobile towers, landing stations and operation platforms to be
able to provide wireless voice and data services. The rollout of
4G network needs an estimated capex of c.EGP4bn (2016-2020).
We expect that the huge needed fund would negatively impact
ETEL’s dividend payout and would raise its leverage.
13. For more information on MubasherTrade, please visit our website at www.MubasherTrade.com or contact us at
Research@MubasherTrade.com. Please read the important disclosure and disclaimer at the end of this document.
Page 13
Telecom Egypt | Egypt | Initiation of Coverage
Monday, 7 November 2016
Business Model (Cont.’d)
ETEL's Mobile Business SWOT Analysis:
Strengths
• Ownership of the telecom infrastructure backbone in Egypt.
• Solid client base in both landline and data services (6.3mn),
which is considered potential mobile subs.
Weaknesses
• ETEL does not own a mobile network.
• Huge funds needed for mobile license and infrastructure
might affect ETEL's fundamentals, taking into account that
EGP4bn is already invested in fiber optic cables.
• The huge cash outflow might also pressure dividend payout.
Opportunities
• A large population exceeding 90mn positions Egypt as an
attractive market for telecom players.
• Vast population tends to be tech-savvy.
• Egyptian market is permanently evolving in providing value-
added services.
• Expected economic recovery with a political stability would
positively impact the telecom sector.
• Introducing 4G/LTE technology would result in higher demand
particularly for mobile broadband.
Threats
• High mobile penetration rate recorded 110%, approaching
saturation phase.
• Strong competition between the existing operators would be
intensified by introducing ETEL’s mobile services.
• Increasing the pricing war between the participants would
pressure the operators’ margins.
Expected divestiture of ETEL's stake in VFE once mobile
business is operational: Given that ETEL would operate its own
mobile business, we expect a divestiture of ETEL's 45%
ownership stake in VFE to avoid asset duplication and any
conflicts of interest in addition to the need to generate cash to
finance the capex of its mobile network and 4G spectrum.
We rule out the distribution of special dividends: We expect
that ETEL will use the bulk of selling its stake in VFE to finance
the expected capex on mobile infrastructure in addition to the
cash needed for the license. Accordingly, we rule out the
distribution of special dividend. ETEL has already borrowed
EGP2.5bn to partially finance the EGP5.2bn down payment of
the tender, while the remaining EGP2bn will be paid over 4
years.
Financial Highlights
1. 2015
More-than-doubled 2015 earnings on tax amendments: ETEL's
net profit skyrocketed 112% YoY to record EGP2,997mn in 2015
due to the amendments to the corporate income tax law from
30% to 22.5% retroactively as of 1 January 2015 in addition of
changing the basis of taxes on dividends. These changes resulted
in recognizing a lower corporate income tax for the period and
reversing deferred tax liability to report a tax income of
EGP44mn compared to a tax expense of EGP1,664mn in 2014.
However, net profits before taxes (NPBT) declined by 6.0% YoY
to EGP2,830mn.
Top line remained unchanged as lower wholesale revenues
offset retail revenues growth: The consolidated revenues
inched up by only 0.2% to reach EGP12.15bn in 2015 due to the
42% drop in international customers and networks revenues to
EGP807mn, which were offset by the increase in home units and
domestic wholesale revenues by 14% and 8%, respectively.
Source: MCIT, Company reports, and MTRe.
117% 118%
110% 106% 110%
119%
126% 131% 135% 138% 140%
0%
20%
40%
60%
80%
100%
120%
140%
160%
0
20
40
60
80
100
120
140
160
2012 2013 2014 2015 2016 2017 2018 2019 2020 2021 2022
mn subs Mobile Subs by Operator
Vodafone Egypt Orange Egypt Etisalat Misr
Telecom Egypt Mobile penetration
42% 41% 41% 42% 42% 41% 40% 40% 39% 39%
35% 35% 35% 35% 34% 33% 33% 32% 32% 32%
23% 23% 24% 24% 23% 22% 22% 22% 21% 21%
1.9%
4.0% 5.5% 6.6% 7.6% 8.4%
0%
5%
10%
15%
20%
25%
30%
35%
40%
45%
2013 2014 2015 2016 2017 2018 2019 2020 2021 2022
Market Share by Operator
Vodafone Egypt Orange Egypt Etisalat Misr Telecom Egypt
0
5,000
10,000
15,000
20,000
25,000
2012 2013 2014 2015 2016 2017 2018 2019 2020 2021 2022
EGP mn Mobile Revenues by Operator
Vodafone Egypt Orange Egypt Etisalat Misr Telecom Egypt
14. For more information on MubasherTrade, please visit our website at www.MubasherTrade.com or contact us at
Research@MubasherTrade.com. Please read the important disclosure and disclaimer at the end of this document.
Page 14
Telecom Egypt | Egypt | Initiation of Coverage
Monday, 7 November 2016
Business Model (Cont.’d)
Retail revenues grew on strong data performance: Retail
segment revenues increased 9% YoY to EGP5.5bn in 2015 (45%
of total revenues), supported by 14% increase in home units
revenues amounting EGP3.6bn (29% of total revenues) with a
40% jump in home data revenues to EGP2.0bn. Meanwhile,
home voice revenues declined 9% to EGP1.5bn due to a 7%
decline in home voice ARPU to EGP23.5 in spite of 4% increase in
home fixed-line subs to reach 5.5mn by end of 2015. Home ADSL
subs increased 42% to 2.64mn, driven by the growth in installing
MSAN* in new regions. Also, new decentralized sales strategy
with the regional sales team contributes significantly to sales
growth. Meanwhile, data ARPU increased 8.5% to EGP74.1.
Enterprise solution revenues increased 1% YoY to EGP1.9bn in
2015 (16% of total revenues), driven by 21% increase in
enterprise data revenues to EGP588mn and 17% rise in other
enterprise revenues to EGP89mn. This growth was mainly driven
by delivering major projects with high quality and competitive
prices to banking and governmental sectors. Though enterprise
voice revenues declined 7% to EGP1.2bn, enterprise fixed-line
subs and ADSL subs increased by 2% and 51% to 1.07mn and
165,000, respectively, thanks to the attractive offers provided by
ETEL. TE Data managed to acquire market share of 74% with a
number of subs of 2.8mn by end of 2015.
Wholesale revenues declined on drop in int’l customer
networks and int’l carrier affairs revenues: Wholesale revenues
declined 6% to EGP6.7bn in 2015 (55% of total revenues)
resulted by the abovementioned 42% drop in international
customers and networks revenues to EGP807mn (7% of total
revenues) as ETEL reported two irregular transactions with
SMW-5 cable system and AAE1 cable systems at EGP881mn in
Q2 2014. The international carriers affairs revenues decreased
3% to EGP3.0bn (24% of total revenues) due to ongoing negative
impact of OTT applications on the international voice business
and traffic being terminated in key markets as well as the
continued decline in tourism and the return of most Egyptians
working in troubled neighboring countries. On the other hand,
domestic wholesale revenues rose 8% to EGP2.9bn in 2015 (24%
of total revenues), driven by the continuing and increasing
demand from the telecom companies for ETEL’s infrastructure
and backhauling services. We note that ETEL managed to secure
longer term revenues by signing an agreement with Orange
Egypt and VFE for the provision of international communications
and infrastructure services.
Higher operating costs stressed margins: Cost of revenues rose
7% to EGP3.2bn in 2015 (26.3% of total revenues vs. 24.6% in
2014) due to higher interconnection costs and higher salaries
and wages in addition to 55.4% increase in fuel and power costs.
Moreover, general, selling grew 5% to EGP3.2bn resulted from
the increase in wages & salaries in addition to the company’s
contribution to social insurance, thus EBITDA declined 10% to
EGP3.4bn implying a lower EBITDA margin of 28.2%, which came
in line with management expectations, compared to 32% in
2014.
Higher investment income from VFE in 2015: Investment
income generated mainly from ETEL's ownership stake in VFE
jumped 35% to reach EGP1.1bn compared to EGP829mn in 2014.
Investment income contributed significantly to ETEL's NPBT by
39.5% in 2015 compared to 27.5% in 2014. Meanwhile, VFE
market share inched down to 41.2% (38.7mn subs) in 2015
compared to 41.5% (39.5mn subs) in 2014, mostly due the
disconnection of unregistered subs.
2. H1 2016
Earnings surge on higher revenues, margins, and investment
income: ETEL reported 148% YoY growth in H1 2016
consolidated earnings to reach EGP2.3bn compared to
EGP933mn in H1 2015. The upsurge in earnings was a result of
higher investment income by 68%, mostly generated from ETEL’s
investment in VFE, amounting to EGP716mn, in addition to
lower other expenses. Moreover, consolidated revenues rose
10% to EGP6.4bn in H1 2016 compared to EGP5.8bn in H1 2015.
The top-line growth was mainly driven by a 17% increase in
home services revenues, 15% rise in domestic wholesale
revenues, and 26% higher enterprise revenues. Meanwhile,
consolidated EBITDA increased 30% YoY to EGP2.05bn, implying
higher margin of 32.3% compared to 27.2% supported by the
company’s cost optimization strategy.
Source: Company reports and MTRe.
* A multi-service access node (MSAN) cabins which connect telephone lines to the core network.
3.0 3.0 3.0 2.8 2.8 2.9 2.9 3.0 3.0 3.0
1.3 1.6 2.0 2.6 3.5 4.2 4.8 5.3 5.9 6.5
0.2
1.1
1.9
2.6
3.2
0.24 0.24 0.08 0.09
0.09
0.10
0.10
0.10
0.11
0.11
0
2
4
6
8
10
12
14
EGP bn Retail Business Lines Revenues
Fixed line FBB Mobile Other enterprise
2.3 2.3 2.7 2.9 3.4 3.7 4.0 4.3 4.6 4.9
2.5
3.1 3.1 3.0 2.7 2.5 2.3 2.1 2.0 1.8
0.7
1.0
1.4 0.8 0.8 0.9 0.9 0.9 1.0 1.0
0
1
2
3
4
5
6
7
8
9
EGP bn Wholesale Business Lines Revenues
Domestic wholesale ICA ICN
4.5
4.8
5.0
5.5
6.4
7.4
8.9
10.3
11.6
12.8
5.4
6.4
7.1
6.7
6.9
7.1
7.3
7.4
7.6
7.7
0
2
4
6
8
10
12
14
EGP bn Retail vs. Wholesale Revenues
Retail Revenues Wholesale Revenues
15. For more information on MubasherTrade, please visit our website at www.MubasherTrade.com or contact us at
Research@MubasherTrade.com. Please read the important disclosure and disclaimer at the end of this document.
Page 15
Telecom Egypt | Egypt | Initiation of Coverage
Monday, 7 November 2016
Forecasts Assumptions
Fixed-line business line: We believe that the fixed-line market
almost reached saturation in Egypt, and we expect the
penetration will stabilize at 7.5% starting 2022. We expect that
the fixed-line subs growth will be supported by new residential
expansions. We conservatively assume that the enterprise units
will grew at a 7-year CAGR of 2.5% to reach 1.27mn in 2022.
Meanwhile, we project a 7-year CAGR of 2.1% for home units to
reach 6.35mn in 2022. We also assumed that home fixed-line
ARPU will reach to the minimum subscription fees of EGP11 in
2025, while we assumed that the enterprise ARPU growth and
the other enterprise services revenues growth will be matching
the estimated GDP growth (c.4% annually).
Fixed broadband (FBB): We believe that the growing demand for
data services will support the ADSL business of ETEL, and we
expect that the internet penetration will reach 60% (from 39% in
June 2016) with FFB subs to record 6.9mn in 2022. Meanwhile,
we anticipate that TE Data will remain dominating the ADSL
market with a market share reaching 85% (5.8mn subs) from
77% in June 2016. We assume that TE Data ARPU will increase by
2% annually.
Mobile business line: We expect that ETEL will start introducing
its mobile services at the end of H1 2017 to reach a market share
of 8.4%, representing mobile subs of 11.9mn in 2022.
Meanwhile, we expect mobile ARPU will increase from EGP29.1
in 2017 to reach EGP29.9 in 2019. Starting 2020, we expect a
competitive pressure on ARPUs.
Domestic wholesale: We assume that the domestic revenues
growth will match the growth of mobile and fixed broadband
markets growth. However, we expect a 7-year CAGR of -3% in
international revenues as the international outgoing minutes are
negatively affected by the weak performance of tourism and
business activity.
ICA and ICN: We expect ICA revenues, which are mostly
generated from international gateway, to decline by a 7-year
CAGR of -8% as a result of OTT application and illegal bypass.
Meanwhile, we project a 7-year CAGR of 4% in ICN revenues.
Business Model (Cont.’d)
Source: Company reports and MTRe.
Unit 2014a 2015a 2016e 2017e 2018e 2019e 2020e 2021e 2022e
7-Year CAGR
(2015-2022)
Comments
Population mn 86.70 88.43 90.20 92.01 93.85 95.72 97.64 99.59 101.58 2.0% According to IMF estimates.
Growth % 2.4% 2.0% 2.0% 2.0% 2.0% 2.0% 2.0% 2.0% 2.0%
1. Revenues Assumptions by Lines of Business
a. Fixed line Revenues
Fixed-line penetration % 7.3% 7.4% 7.4% 7.4% 7.5% 7.5% 7.5% 7.5% 7.5% The lower ADSL subscription fees will drive the growth of …
Home subs mn 5.28 5.48 5.55 5.69 5.82 5.95 6.08 6.22 6.35 2.1% … fixed-line connections. However, the FMS will curb the growth.
Enterprise subs mn 1.05 1.07 1.13 1.15 1.17 1.20 1.22 1.25 1.27 2.5% Enterprise subs growth is correlated to expected economic growth.
Total fixed-line Subs (EoP) mn 6.33 6.55 6.68 6.84 6.99 7.15 7.31 7.46 7.62 2.2%
Growth % -6.6% 3.5% 1.9% 2.4% 2.3% 2.2% 2.2% 2.1% 2.1%
Home ARPU EGP 25.4 23.7 21.3 20.1 18.9 17.7 16.4 15.2 14.0 -7.2% The ARPU will gradually decline to approach the monthly fees of EGP12.
Growth % -2.1% -6.6% -10.0% -5.7% -6.1% -6.5% -6.9% -7.4% -8.0%
Enterprise ARPU EGP 103.9 96.6 106.7 110.9 115.4 120.1 124.9 130.0 133.9 4.8% We based our estimated ARPU growth on IMF estimated GDP growth.
Growth % 22.1% -7.1% 10.4% 4.0% 4.0% 4.0% 4.1% 4.1% 3.0%
Fixed-line revenues EGP mn 2,991 2,759 2,817 2,870 2,911 2,954 2,999 3,046 3,076 1.6%
Growth % 1.3% -7.8% 2.1% 1.9% 1.4% 1.5% 1.5% 1.6% 1.0%
Contribution to retail segment revenues % 59.5% 50.4% 43.8% 39.0% 32.7% 28.7% 25.9% 23.8% 22.0%
Contribution to total revenues % 24.6% 22.6% 21.1% 19.8% 18.0% 16.7% 15.6% 14.8% 14.1%
b. ETEL Mobile Revenues*
Mobile Penteration % 109.9% 106.3% 109.7% 118.8% 125.8% 130.9% 134.6% 137.6% 140.0% We assumed continued growth in penetration but at a slower pace …
ETEL Mobile Subs mn - - - 2.07 4.68 6.87 8.68 10.38 11.94 … due to approaching the market saturation phase.
ETEL Market Share % - - - 1.9% 4.0% 5.5% 6.6% 7.6% 8.4%
Total Mobile Subs (EoP) mn 95.3 94.0 99.0 109.3 118.0 125.3 131.4 137.0 142.2 6.1%
Growth % -4.4% -1.4% 5.3% 10.4% 8.0% 6.2% 4.8% 4.3% 3.8% We expect that TE's 4G mobile services will be launched by end of Q2 2017.
ETEL Net Adds mn - - - 2.07 2.62 2.19 1.82 1.69 1.56 Assuming similar net adds of VFE, to be followed by Orange Egypt and EM.
ETEL Share of Net Adds % - - - 20.0% 30.0% 30.0% 30.0% 30.0% 30.0%
Total Mobile Net Adds mn (4.4) (1.3) 5.0 10.3 8.7 7.3 6.1 5.6 5.2
Estimated ARPU growth: ARPU growth is to be fueled by data revenues growth ...
ETEL Mobile ARPU EGP 29.1 29.5 29.8 29.9 29.9 29.8 0.2% … yet this growth will be muted by the expected discounts …
Growth % 1.5% 1.0% 0.5% 0.0% -0.5% … due to the expected fierce competition.
ETEL Mobile Revenues EGP mn - - - 180 1,195 2,065 2,794 3,424 3,989 35.2%
Annual fees on mobile revenues EGP mn - - - (13) (84) (145) (196) (240) (279) As per mobile license terms, TE will pay 6% of mobile revenues to NTRA ...
ETEL Net Mobile Revenues EGP mn - - - 168 1,111 1,920 2,599 3,185 3,709 35.2% … in addition to 1% to finance scientific research in telecom sector.
Growth % - - - - 562.9% 72.9% 35.3% 22.6% 16.5%
Contribution to Retail Revenues % 2.3% 12.5% 18.6% 22.4% 24.8% 26.5%
Contribution to Total Revenues % 1.2% 6.9% 10.8% 13.6% 15.5% 17.0%
ProjectionAssumptions
16. For more information on MubasherTrade, please visit our website at www.MubasherTrade.com or contact us at
Research@MubasherTrade.com. Please read the important disclosure and disclaimer at the end of this document.
Page 16
Telecom Egypt | Egypt | Initiation of Coverage
Monday, 7 November 2016
Business Model (Cont.’d)
Source: Company reports and MTRe.
Unit 2014a 2015a 2016e 2017e 2018e 2019e 2020e 2021e 2022e
7-Year CAGR
(2015-2022)
Comments
c. Fixed Broadband (FBB)
Internet penetration (%) % 31.7% 37.4% 41.6% 45.9% 49.5% 52.9% 55.8% 58.0% 60.0% Internet market growth will be driven by rising demand for data services …
Internet Users mn 27.5 33.0 37.5 42.2 46.5 50.7 54.4 57.8 60.9 9.1% … yet, we expect the growth will slowdown due to …
Growth % 10.0% 20.2% 13.6% 12.4% 10.2% 9.0% 7.5% 6.1% 5.5% … the expected low penetration in low-income segment and aged people
FBB Sub of Total Fixed-line Subs 47.8% 57.9% 67.0% 70.8% 74.7% 78.5% 82.3% 86.2% 90.0%
Total FBB Subs (EoP) mn 3.0 3.8 4.5 4.8 5.2 5.6 6.0 6.4 6.9 8.8%
Growth % 15.1% 25.2% 18.0% 8.3% 7.9% 7.5% 7.2% 6.9% 6.7%
TE Data market Share % 65.3% 74.1% 79.0% 81.1% 82.9% 83.8% 84.5% 85.0% 85.0%
TE Data Subs (EoP) mn 2.0 2.8 3.5 3.9 4.3 4.7 5.1 5.5 5.8 11.0%
Growth % 18.5% 42.1% 25.8% 11.2% 10.2% 8.6% 8.1% 7.5% 6.7%
TE Data blinded ARPU EGP 89.7 91.4 92.6 94.5 96.4 98.3 100.3 102.3 104.3 1.9% Given the low penetration of internet services …
Growth % 4.0% 1.9% 1.3% 2.0% 2.0% 2.0% 2.0% 2.0% 2.0% … ARPU will be supported by rising demand for internet services.
TE Data revenues EGP mn 1,962 2,626 3,525 4,229 4,774 5,328 5,888 6,473 7,068 15.2%
Growth % 25.1% 33.8% 34.2% 20.0% 12.9% 11.6% 10.5% 9.9% 9.2%
Contribution to retail segment revenues % 39.0% 48.0% 54.8% 57.4% 53.7% 51.7% 50.8% 50.5% 50.6%
Contribution to total revenues % 16.1% 21.6% 26.4% 29.2% 29.5% 30.0% 30.7% 31.5% 32.4%
d. Other Enterprise Revenues
Other Enterprise Revenues EGP mn 76 89 93 96 100 104 108 113 117 4.0%
Growth % -68.9% 17.1% 4.1% 4.0% 4.0% 4.0% 4.1% 4.1% 4.1% Based IMF estimated GDP growth.
Contribution to retail segment revenues % 1.5% 1.6% 1.4% 1.3% 1.1% 1.0% 0.9% 0.9% 0.8%
Contribution to total revenues % 0.6% 0.7% 0.7% 0.7% 0.6% 0.6% 0.6% 0.5% 0.5%
e. Domestic Wholesale Revenues
Domestic revenues EGP mn 1,820 2,142 2,593 2,975 3,329 3,652 3,950 4,233 4,500 11.2% Based on mobile and FBB markets growth.
Growth % 32.7% 17.7% 21.0% 14.7% 11.9% 9.7% 8.2% 7.2% 6.3%
International outgoing revenues EGP mn 862 784 760 738 716 694 673 653 633 -3.0% We expect a negative impact from weak performance in tourism …
Growth % -2.7% -9.0% -3.0% -3.0% -3.0% -3.0% -3.0% -3.0% -3.0% … and business activities.
Total Domestic Wholesale Revenues EGP mn 2,682 2,926 3,353 3,712 4,045 4,346 4,624 4,886 5,133 8.4%
Growth % 18.8% 9.1% 14.6% 10.7% 8.9% 7.5% 6.4% 5.7% 5.0%
Contribution to wholesale segment revenues % 37.6% 43.6% 48.4% 52.2% 55.6% 58.5% 61.1% 63.3% 65.3%
Contribution to total revenues % 22.1% 24.0% 25.1% 25.7% 25.0% 24.5% 24.1% 23.8% 23.5%
f. International Carriers Affairs (ICA) Revenues
ICA revenues EGP mn 3,067 2,977 2,739 2,520 2,318 2,133 1,962 1,805 1,661 -8.0%
Growth % -2.4% -2.9% -8.0% -8.0% -8.0% -8.0% -8.0% -8.0% -8.0% We anticipate a downtrend in revenues due to competition from …
Contribution to wholesale segment revenues % 43.0% 44.4% 39.5% 35.5% 31.9% 28.7% 25.9% 23.4% 21.1% … OTT applications and illegal bypass.
Contribution to total revenues % 25.2% 24.4% 20.5% 17.4% 14.3% 12.0% 10.2% 8.8% 7.6%
g. International Customers & Networks (ICN)
ICN revenues EGP mn 1,380 807 840 873 908 945 983 1,023 1,065 4.0%
Growth % 42.1% -41.5% 4.1% 4.0% 4.0% 4.0% 4.1% 4.1% 4.1%
Contribution to wholesale segment revenues % 19.4% 12.0% 12.1% 12.3% 12.5% 12.7% 13.0% 13.3% 13.5%
Contribution to total revenues % 11.4% 6.6% 6.3% 6.0% 5.6% 5.3% 5.1% 5.0% 4.9%
Total revenues EGP mn 12,158 12,184 13,366 14,468 16,168 17,731 19,163 20,531 21,830 8.7%
Total revenues growth rate % 9.2% 0.2% 9.7% 8.2% 11.7% 9.7% 8.1% 7.1% 6.3%
ProjectionAssumptions
17. Important Disclosures
METHODOLOGY: We strive to search for the best businesses that trade at the lowest valuation levels as measured by an issuer’s intrinsic value on a per-share basis. In doing so, we follow both top-
down and bottom-up approaches. Under the top-down approach, we attempt to study the most important quantitative and qualitative factors that we believe can affect a security's value, including
macroeconomic, sector-specific, and company-specific factors. Under the bottom-up approach, we focus on the analysis of individual stocks by running our proprietary scoring model, including
valuation, financial performance, sentiment, trading, risk, and value creation.
COUNTRY MACRO RATINGS: We analyze the four main sectors of a country’s macroeconomics, then we assign , , and star for low risk, Low Risk, and high risk, respectively. We use
different weights for each economic sector: (a) Real Sector (30% weight), (b) Monetary Sector (10% weight), (c) Fiscal Sector (25% weight), (d) External Sector (15% weight), and (e) Credit Rating and
Outlook (20%).
STOCK MARKET RATINGS: We compare our year-end price targets for the subject market index on a total-return basis versus our calculated required rate of return (RRR). Taking into account our
Country Macro Rating, we set the “Neutral” borderline (below which is “Underweight”) as 20% of RRR for Country Macro Rating, 40% of RRR for Country Macro Rating, and 60% of RRR for
Country Macro Rating. That said, our index price targets are based on the average of two models. Model (1): Estimated index levels based on consensus price targets of all index constituents. Stocks
with no price targets are valued at market price. Model (2): Estimated index levels based on our expected re-pricing (whether re-rating, de-rating, or unchanged rating) of the forward price-earnings
ratio (PER) of each index in addition to consensus earnings growth for the forward year.
SECTOR RATINGS: On the sectors level, we focus on six major sectors, namely (1) Consumer and Health Care, (2) Financials, (3) Industrials, Energy, & Utilities, (4) Materials, (5) Real Estate, and (6)
Telecom Services & IT. To assess each sector, we use the SWOT analysis to list the strengths, weaknesses, opportunities, and threats in each country. We then translate our qualitative SWOT analysis
into a quantitative model to evaluate all six sectors across countries. Each of the measures we used, although mostly subjective, is assigned a score as either +1 (high impact), 0 (medium impact), or -1
(low impact). At a later stage, when assigning the final rating – Overweight, Neutral, or Underweight – for each sector in each country, we realize that sometimes it is unfair to assign equal weights for
the sub-sectors in each major sector assessed. Hence, some of the sub-sectors are given different weights for their significant profile in each country. Additionally, the final rating for each sector in each
specific country is assigned based on a relative calculation comparing this sector to all other sectors in this country.
Disclosure Appendix
SECURITY INVESTMENT RATINGS: We combine intrinsic value, relative valuation, and market sentiment into a single
rating. Our three-pronged methodology involves (1) discounted cash flows “DCF” valuation model(s), (2) relative
valuation metrics, and (3) overall sentiment. Whenever possible we attempt to apply all three aspects on the issuers or
securities under review. In certain cases where we do not have our own financial and valuation models, we attempt to
scan the market for other analysts’ value estimates and ratings (i.e. consensus view) on average. We compliment this
with relative valuation and sentiment drivers, such as positive/neutral/negative news flows. For all issuers/securities
covered, we have three investment ratings (Buy, Hold, or Sell), comparing the security’s expected total return (including
both price performance and expected cash dividend) over a 12-month period versus its Required Rate of Return “RRR”
as calculated using the Capital Asset Pricing Model “CAPM” and adjusted for the Risk Rating we attach to each security.
Our price targets are subjective and are estimates of the analysts where the securities covered will trade within the
next 12 months. Price targets can be derived from earnings-based valuation models (e.g. Discounted Cash Flow “DCF”),
asset-based valuation models (e.g. Net Asset Value “NAV”), relative valuation multiples (e.g. PER, PBV, EV/EBITDA, etc.),
or a combination of them. In case we do not have our own valuation model, we use a weighted average of market
consensus price targets and ratings. We review the investment ratings periodically or as the situation necessitates.
SECURITY RISK RATINGS: We assess the risk profile of each issuer/security covered and assign one of three risk ratings
(High, Moderate, or Low). The risk rating is weighted to reflect different aspects specific to (1) the sector, (2) the issuer,
(3) the security under review, and (4) volatility versus the market (as measure by beta) and versus the security’s average
annualized standard deviation. We review the risk ratings at least annually or as the situation necessitates.
Other Disclosures
MFS does not have any proprietary holding in any securities. Only as a nominee, MFS holds shares on behalf of its
clients through Omnibus accounts. MFS is not currently a market maker for any listed securities.
Low
(1)
Moderate
(2)
High
(3)
Buy
(B)
Higher than RRR Higher than RRR Higher than RRR
Hold
(H)
Between RRR
and 20% of RRR
Between RRR
and 40% of RRR
Between RRR
and 60% of RRR
Sell
(S)
Lower than 20%
of RRR
Lower than 40%
of RRR
Lower than 60%
of RRR
Not Rated
(NR)
Not Covered
(NC)
We do not currently cover this stock or we are
restricted from coverage for regulatory reasons.
InvestmentRating
Risk Rating
We have decided not to publish a rating on the
stock due to certain circumstances related to the
company (i.e. special situations).
If
Total Return
is …