Alt R - ACPL - Initiating Coverage - 15th Sept 2016
•
1 like•170 views

We initiate the coverage of Attock Cement Pakistan Limited (ACPL) with the “BUY” recommendation and the target price for Jun’17 of PKR 322/share providing total upside of 32.29%, including capital gain accounting for 28.29% at the current price of 251 and dividend yield of 4% on target price.

Recommended
Recommended
More Related Content
What's hot
What's hot (20)
Similar to Alt R - ACPL - Initiating Coverage - 15th Sept 2016
Similar to Alt R - ACPL - Initiating Coverage - 15th Sept 2016 (20)
Recently uploaded
Recently uploaded (20)
Alt R - ACPL - Initiating Coverage - 15th Sept 2016
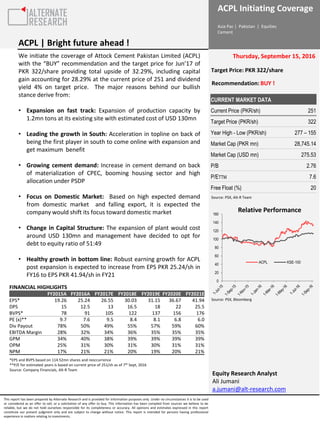
- 1. ACPL Initiating Coverage We initiate the coverage of Attock Cement Pakistan Limited (ACPL) with the “BUY” recommendation and the target price for Jun’17 of PKR 322/share providing total upside of 32.29%, including capital gain accounting for 28.29% at the current price of 251 and dividend yield 4% on target price. The major reasons behind our bullish stance derive from: • Expansion on fast track: Expansion of production capacity by 1.2mn tons at its existing site with estimated cost of USD 130mn • Leading the growth in South: Acceleration in topline on back of being the first player in south to come online with expansion and get maximum benefit • Growing cement demand: Increase in cement demand on back of materialization of CPEC, booming housing sector and high allocation under PSDP • Focus on Domestic Market: Based on high expected demand from domestic market and falling export, it is expected the company would shift its focus toward domestic market • Change in Capital Structure: The expansion of plant would cost around USD 130mn and management have decided to opt for debt to equity ratio of 51:49 • Healthy growth in bottom line: Robust earning growth for ACPL post expansion is expected to increase from EPS PKR 25.24/sh in FY16 to EPS PKR 41.94/sh in FY21 Asia Pac | Pakistan | Equities Cement Thursday, September 15, 2016 This report has been prepared by Alternate Research and is provided for information purposes only. Under no circumstances it is to be used or considered as an offer to sell, or a solicitation of any offer to buy. This information has been compiled from sources we believe to be reliable, but we do not hold ourselves responsible for its completeness or accuracy. All opinions and estimates expressed in this report constitute our present judgment only and are subject to change without notice. This report is intended for persons having professional experience in matters relating to investments. ACPL | Bright future ahead ! Source: PSX, Alt-R Team CURRENT MARKET DATA Current Price (PKR/sh) 251 Target Price (PKR/sh) 322 Year High - Low (PKR/sh) 277 – 155 Market Cap (PKR mn) 28,745.14 Market Cap (USD mn) 275.53 P/B 2.76 P/ETTM 7.6 Free Float (%) 20 Relative Performance Source: PSX, Bloomberg Target Price: PKR 322/share Recommendation: BUY ! 0 20 40 60 80 100 120 140 160 ACPL KSE-100 *EPS and BVPS based on 114.52mn shares and reoccurrence **P/E for estimated years is based on current price of 251/sh as of 7th Sept, 2016 Source: Company Financials, Alt-R Team FINANCIAL HIGHLIGHTS FY2015A FY2016A FY2017E FY2018E FY2019E FY2020E FY2021E EPS* 19.26 25.24 26.55 30.03 31.15 36.67 41.94 DPS 15 12.5 13 16.5 18 22 25.5 BVPS* 78 91 105 122 137 156 176 PE (x)** 9.7 7.6 9.5 8.4 8.1 6.8 6.0 Div Payout 78% 50% 49% 55% 57% 59% 60% EBITDA Margin 28% 32% 34% 36% 35% 35% 35% GPM 34% 40% 38% 39% 39% 39% 39% OPM 25% 31% 30% 31% 30% 31% 31% NPM 17% 21% 21% 20% 19% 20% 21% Equity Research Analyst Ali Jumani a.jumani@alt-research.com
- 2. ACPL Initiating Coverage EXPANSION ON FAST TRACK In view of high expected demand on back of CPEC materialization, high PSDP spending and booming construction sector, In August 2015, ACPL management put forward their intention to expand the cement production capacity by 1.2mn tons from 1.83mn tons to 3.09mn tons per annum at the existing plant site. The company is already operating at capacity of 105% thus this expansion is desperately required to capture the flourishing market. The estimated capital outlay would be around USD 130mn. Moreover, ACPL has signed an agreement with a Chinese company for supply of 4,000tpd cement manufacturing plant which is expected to come online by December 2017 as necessary work on civil, mechanical and electrical infrastructure/installation is now being carried out.. Besides production line expansion, Attock cement was also planning to install 40 MW Coal Fired Power Plant costing USD 50 million, however according to management due to acute shortage of water in Hub Dam, which is the only source of water for the plant operations; work on project has stopped. The company in 2014 started venture capital with Iranian party under the name of “Saqr Al-Keetan” to establish a cement grinding facility at Basra, Iraq. The plant has a capacity of 900,000 tons costing USD 40mn representing 60% share of ACPL. We believe with outlay of USD 130mn due to expansion Attock Cement will keep this project on hold for now. LEADING THE GROWTH IN SOUTH As cement despatches are expected to skyrocket in upcoming years, many players in cement sector have revealed their intention to expand their production capacity. Out of the total cement production capacity of 45.62MT, South Zone processes 17% of it which translates into 7.65MT as of FY16. With expansion of ACPL, LUCK, DGKC and POWER in South Zone the cement production capacity is expected to reach 13.70MT from 7.65MT, an increase of 79%. As Attock Cement is expected to come online by the end of 2017, almost a year before DGKC is expected to start production is South, this will surely provide them advantage in South. Attock Cement is currently operating at capacity utilization of 105% and selling all what its producing as Falcon, Attock’s cement brand name, is very well known brand in market. Further, we expect that once Attock plant comes online it will operate at 70% utilization and increase gradually over the years. Hence, the increased production from expansion will dissolve to some extend until LUCK and DGKC comes online. Asia Pac | Pakistan | Equities Cement This report has been prepared by Alternate Research and is provided for information purposes only. Under no circumstances it is to be used or considered as an offer to sell, or a solicitation of any offer to buy. This information has been compiled from sources we believe to be reliable, but we do not hold ourselves responsible for its completeness or accuracy. All opinions and estimates expressed in this report constitute our present judgment only and are subject to change without notice. This report is intended for persons having professional experience in matters relating to investments. Source: Alt-R Team, APCMA Industry Capacity Expansion 0 10 20 30 40 50 60 70 FY2016 FY2017E FY2018E FY2019E FY2020E Capacity (MT) Total Capacity North South Source: Company Accounts, Alt-R Team Attock’s Production Capacity & Utilization 0% 20% 40% 60% 80% 100% 120% 0 0.5 1 1.5 2 2.5 3 3.5 MT Clinker Capacity (LHS) Cement Capacity (LHS) Capacity Utilization (RHS)
- 3. ACPL Initiating Coverage Asia Pac | Pakistan | Equities Cement This report has been prepared by Alternate Research and is provided for information purposes only. Under no circumstances it is to be used or considered as an offer to sell, or a solicitation of any offer to buy. This information has been compiled from sources we believe to be reliable, but we do not hold ourselves responsible for its completeness or accuracy. All opinions and estimates expressed in this report constitute our present judgment only and are subject to change without notice. This report is intended for persons having professional experience in matters relating to investments. GROWING DOMESTIC CEMENT DEMAND As per research conducted by CEMTEC, Pakistan is amongst the three Cement Hotspots in the world where demand is expected to grow at its fastest. In Pakistan, infrastructure projects and the housing sector are the key drivers for consumption of cement. We believe on back of following factors cement demand is expected to fly high: • Infrastructure projects worth USD 9.8b are planned to be undertaken under China Pakistan Economic Corridor • High spending for infrastructure projects as per allocations made under Public Sector Development Programs. Currently Federal PSDP of PKR 800bn is allocated for FY16-17 particularly for construction of dams, roads and bridges • Large infrastructure projects include Gwadar Airport, Gwadar Deep Sea Port, Hydropower project of around 10,000MW capacity and Karachi-Lahore Motorway • Increasing urbanization with urban areas having lower number of people per household vis-à-vis rural areas creating additional demand for housing units • Significant backlog of housing units estimated at 9 million units and announcement of various plans by the government to address this shortfall • New affordable mega housing projects (Bahria Town, DHA, and LDA City) Based on all the above mentioned factors we expect total cement despatches, mainly domestic despatches, to increase robustly in near future. Considering both historical growth and future scenario we expect total cement despatches to grow at CAGR of 6.6% from FY17 till FY21 against CAGR of 4.6% from FY12 till FY16. Currently cement industry is operating at capacity utilization of 85%, we expect this utilization rate to increase to 88% in FY17 with increasing demand but will start dwindling once expansion from different players starts to materialize and reach 75% between FY20 and FY21. Exports have been shrinking over the last few years and outlook over the next 2‐3 years is not particularly bright. We expect exports to shrink further in future resulting in industry sales mix of 90:10 with 90% being domestic market. 0 10 20 30 40 50 60 MT Local Despatches Export Despatches Total Dispatches Source: Alt-R Team, APCMA Actual and Estimated Industry Despatches 0% 20% 40% 60% 80% 100% 0 10 20 30 40 50 60 70 MT Production Capacity (LHS) Total Dispatches (LHS) Capacity Utilization (RHS) Production Capacity accounts for Expansion of LUCK, DGKC, POWER, ACPL, MLCF, CHCC, KOHC, FECTO and PIOC Source: Alt-R Team, APCMA Industry Production Capacity, Despatches and Utilization
- 4. ACPL Initiating Coverage Asia Pac | Pakistan | Equities Cement This report has been prepared by Alternate Research and is provided for information purposes only. Under no circumstances it is to be used or considered as an offer to sell, or a solicitation of any offer to buy. This information has been compiled from sources we believe to be reliable, but we do not hold ourselves responsible for its completeness or accuracy. All opinions and estimates expressed in this report constitute our present judgment only and are subject to change without notice. This report is intended for persons having professional experience in matters relating to investments. 28% 72% Share of export in Total Company dispatches Share of local in Total Company dispatches Sales Mix 2016 11% 89% 2021 ACPL Market Share Source: Company Accounts, Alt-R Team 0% 1% 2% 3% 4% 5% 6% 7% ACPL Market Share (based on installed capacity) Share in Total Industry Dispatches Source: Company Accounts, Alt-R Team FOCUS ON DOMESTIC MARKET As domestic demand is expected to surge on back of materialization of CPEC, higher investment in PSDP and booming construction sector while exports are expected to fall due to anti-dumping duties imposed on cement sector by South Africa plus competition from cheap Iranian cement in international market and international capacity expansion, we anticipate Attock cement to change its sales mix in order to make the most of this excellent opportunity by focusing on domestic market. Currently, ACPL sales mix showcase 72:28 ratio with 72% representing domestic sales. We expect this sales mix to change gradually and reach about 89:11 by 2021. Attock Cement currently has a market share (based on installed capacity) of 4% as of FY16. With this expansion expected to come online by 2QFY18, the market share is expected to increase to 6.12% in FY18. We don’t expect ACPL’s market share to sustain because of other expansions anticipated in FY18 and FY19 (DGKC, MLCF and LUCK with estimated capacity of 10.65mn tons). Hence, market share is likely to deteriorate moving forward. Based on the total industry despatches, ACPL’s market share currently stands at 5.1%. As ACPL is already operating at capacity of 105% they won’t be able to reap the benefit of increased demand in FY17 as a result drop in market share can be foreseen. However, with expansion in FY18, the market share in total despatches is expected to heighten but fall thereafter as tough competition from LUCK and DGKC is expected. FY2016FY2017EFY2018EFY2019EFY2020EFY2021E ACPL Market Share (based on installed capacity)* 4.0% 3.9% 6.1% 4.7% 4.7% 4.7% Share in Total Industry Despatches 5.1% 4.7% 5.1% 5.1% 5.1% 5.1% Share of export in Total Company Despatches 28% 22% 19% 14% 11% 11% Share of local in Total Company Despatches 72% 78% 81% 86% 89% 89% *Market Share considers expansion of LUCK, DGKC, POWER, ACPL, MLCF, CHCC, KOHC, FECTO and PIOC Source: Company Accounts, Alt-R Team
- 5. ACPL Initiating Coverage Asia Pac | Pakistan | Equities Cement This report has been prepared by Alternate Research and is provided for information purposes only. Under no circumstances it is to be used or considered as an offer to sell, or a solicitation of any offer to buy. This information has been compiled from sources we believe to be reliable, but we do not hold ourselves responsible for its completeness or accuracy. All opinions and estimates expressed in this report constitute our present judgment only and are subject to change without notice. This report is intended for persons having professional experience in matters relating to investments. Loan Terms Principal borrowed: $66,300,000 Interest Rate: 3m Kibor + 0.2% Tenure: 5 years Grace Period 2 Years Loan initiation FY17 Source: Alt-R Team CHANGE IN CAPITAL STRUCTURE In order to expand the production facility by 1.2MT the company opted partially for long-term financing and partially for internally generated cash flow. Thus, we expect that the total cost of project, which is around USD 130mn, will be divided into the debt to equity ratio of 51:49 which translates into long-term financing portion being USD 66.3mn (PKR 7bn) while company will invest remaining amount of USD 63.7mn (PKR 6.5bn) from internally generated cash flow. The loan has been arranged by local Punjab Bank with the support of MCB Bank, Allied Bank, Askari Bank and United Bank Ltd. As per our talk with the management, the loan will be provided for 5 years having grace period of 2 years. The cost of financing would be 3 months Kibor + 0.2%. Furthermore, we expect interest will be capitalized until the plant gets complete for commercial production. We further expect Kibor to showcase increasing trend in the future as inflation have started to rebound which will result in significant interest outlay but we believe that ACPL will be able to pay finance cost with ease as topline and operating profits are expected to excel on back of increased demand and market share post expansion. Moreover, we expect as expansion is a long process and plant will come online by FY18, the company will likely receive financing in two chunks, major portion will be falling in FY17 while the remaining financing will be used in FY18. Additionally, the use of leverage will help provide support to bottom line in shape of tax shield. 0 100 200 300 400 500 600 700 800 900 0 1000 2000 3000 4000 5000 6000 7000 8000 FY2016 FY2017E FY2018E FY2019E FY2020E Long-Term Debt Finance Cost (RHS) Source: Company Accounts, Alt-R Team Long-Term Financing and Finance Cost(In mn) (In mn)
- 6. ACPL Initiating Coverage Asia Pac | Pakistan | Equities Cement This report has been prepared by Alternate Research and is provided for information purposes only. Under no circumstances it is to be used or considered as an offer to sell, or a solicitation of any offer to buy. This information has been compiled from sources we believe to be reliable, but we do not hold ourselves responsible for its completeness or accuracy. All opinions and estimates expressed in this report constitute our present judgment only and are subject to change without notice. This report is intended for persons having professional experience in matters relating to investments. Source: Company Accounts, Alt-R Team Source: Company Accounts, Alt-R Team 0 20 40 60 80 100 120 140 160 180 200 0 5 10 15 20 25 30 35 40 45 BVPS (RHS) EPS (LHS) DPS (LHS) 0% 5% 10% 15% 20% 25% 30% 35% 40% 45% GPM OPM NPM EBITDA Margin Source: Company Accounts, Alt-R Team PKR Mn FY16 FY15 YoY Sales 13,918 13,086 6% COGS 8,332 8,690 -4% GP 5,587 4,396 27% PBT 4,236 3,221 32% NPAT 2,890 2,206 31% EPS 25.24 19.26 31% Financial Highlights Margins EPS, DPS and BVPS HEALTHY GROWTH IN BOTTOM LINE We anticipate earnings of ACPL to surge massively post expansion from mere EPS PKR 25.24/sh in FY16 to EPS PKR 41.97/sh in FY21E, an increase of 66%. However, a slow down in earning growth is expected once other cement manufacturers get their expansion online. Moreover, we expect ACPL management to continue paying hefty dividends as the working capital requirement are lower than the cash generated from operations. The major upsurge in bottom line stems from • Boost in sales on back of increase in production capacity, higher domestic sales due to shift in sales mix and strong demand on back high construction activity expected to incur in future • We expect retention prices on back of strong demand are likely grow further in future leading to increase in the profits • COGS are assumed to hover between 60-62% due to weak outlook of fuel and coal prices giving boost to the margins • Shift in sales mix from 72:28 to 89:11 will further decrease the distribution cost thus increasing operating margins • The benefit from using leverage will provide tax shield to ACPL leading to better profit margins 0 5000 10000 15000 20000 25000 FY2016 FY2017E FY2018E FY2019E FY2020E FY2021E Sales Gross Proft Operating Profit Net Profit Source: Company Accounts, Alt-R Team ACPL Estimated Sales and Profits FY16 PERFORMANCE Sales for FY16 clocked at 13.92bn resulting gross profit to prospered by 27%YoY to settle at PKR 5.59bn. This rise was supported from marvelous rise in local despatches by 23.8%. Additionally, reduction in power cost on back of fuel adjustment owing to dip in international oil prices and along with dip in coal prices decrease growth in cost to sales to 4%YoY. PBT has achieved enormous growth of 32%YoY in FY16. Despite the bulky gain in PBT, NPAT limited to 31%YoY owing to rise in tax payment by 33%YoY. Consequently, earnings for the year clocked in at PKR 2.89bn (EPS: PKR 25.24), depicting a growth of 31%YoY against PKR 2.29bn recorded last year.
- 7. ACPL Initiating Coverage Asia Pac | Pakistan | Equities Cement This report has been prepared by Alternate Research and is provided for information purposes only. Under no circumstances it is to be used or considered as an offer to sell, or a solicitation of any offer to buy. This information has been compiled from sources we believe to be reliable, but we do not hold ourselves responsible for its completeness or accuracy. All opinions and estimates expressed in this report constitute our present judgment only and are subject to change without notice. This report is intended for persons having professional experience in matters relating to investments. VALUATION We initiate coverage on Attock Cement Pakistan Limoted (ACPL), with ‘Buy’ rating and a TP of PKR 322/sh, implying 28.29% upside potential from its closing price PKR 251/sh of Sept 09, 2016. We have used discounted cash flow (Free Cash Flow to Firm) methodology to derive the intrinsic value of ACPL at PKR 322/sh. The stock also offers a dividend yield of 4% making total yield of 32.29%. Following assumptions have been used to arrive at the our target price: FY2016A FY2017E FY2018E FY2019E FY2020E FY2021E WACC 14.9% 9.8% 11.1% 12.2% 12.8% 13.7% EBIT(1-t) 2,905 2,568 3,621 4,021 4,461 5,022 Depreciation 244 680 922 879 837 796 CAPEX -303 -11,186 -2,428 -102 -100 -53 Change in WC -59 667 -805 -406 64 671 FCFF 2,786 -7,271 1,309 4,392 5,263 6,436 PV of FCFF 2,424 -6,035 956 2,773 2,877 3,023 Sum of PV 6,018 Terminal Value 71,050 PV of Terminal Value 30,817 Equity Value 36,835 No. of Shares (mn) 114.52 Target Price 322 Upside @ 251/sh 28.29% Source: Company Accounts, Alt-R Team - 50 100 150 200 250 300 350 400 450 Average Price 2x 4x 6x 8x 10x 12x P/E VALUATION Source: Company Accounts, Alt-R Team By analyzing P/E band it can be witnessed that on average ACPL usually traded between P/E of 8x and 10x. Currently the P/E hover below the P/E 8x (29% discount) suggesting that the scrip is very well undervalue against Allt-R cement universe average P/E of 11.34x. Hence, Supporting our valuation and depicting a potential gain near future. Valuation Parameters RFR 7.75% Beta* 1.15 Market Premium 6.25% Cost of Equity 14.94% Sustainable Growth 4% *5-years monthly beta to reduce the impact of volatility on our valuation. Source: Alt-R Team, PSX PT Sensitivity Risk free rate Growth Rates % 6.75 7.25 7.75 8.25 8.75 3.0 289 292 294 297 299 3.5 301 304 307 310 312 4 315 318 322 324 327 4.5 330 333 337 340 343 5.0 347 351 354 358 361 Source: Alt-R Team
- 8. ACPL Initiating Coverage Asia Pac | Pakistan | Equities Cement This report has been prepared by Alternate Research and is provided for information purposes only. Under no circumstances it is to be used or considered as an offer to sell, or a solicitation of any offer to buy. This information has been compiled from sources we believe to be reliable, but we do not hold ourselves responsible for its completeness or accuracy. All opinions and estimates expressed in this report constitute our present judgment only and are subject to change without notice. This report is intended for persons having professional experience in matters relating to investments. KEY RISKS • If cement demand growth is weaker than expected, it could impact the ability of the industry to push through accretive price increases and lower breakeven utilization on of new capacities. • Cement industry has remained on an active watch-list of the Competition Commission of Pakistan (CCoP) and has been slapped faced fines on allegations of collusive pricing arrangements. Previous fines by manufacturers have remained unpaid yet and case awaits verdict on the matter. • Lower than expected allocation of budgeted Public sector development fund will hurt domestic cement off take. With declining demand eminent from export avenues, lower PSDP will pose a threat for manufacturers. • Technical problems in the new line and resultant delay in production may hurt profitability in the near term. Delays in capacity commissioning will lead to lower volume off-take and hence reduce profit outlook. • Lower than forecasted capacity utilization of the new plant (lower demand) will serve as a key risk to our valuations. • Sharp recovery in input, coal and fuel costs can inflate cost pressure. The gross margins are likely to erode owing to surge in fuel prices and electricity prices. • Sharp increase in finance cost can erode the bottle line because of recent hefty financing for its expansionary business. • South region has in the past has been prone to many terrorist attacks and various acts of violence which has had adverse effect on the law an d order situation in the region. These may lead to plant operation disruptions and hence impact profitability. However, ACPL’s operations have not got impacted so far due to such events in the past. • The expansions of many player are likely to pose a threat of price war if the local demand didn’t surge as expected.
- 9. ACPL Initiating Coverage Asia Pac | Pakistan | Equities Cement This report has been prepared by Alternate Research and is provided for information purposes only. Under no circumstances it is to be used or considered as an offer to sell, or a solicitation of any offer to buy. This information has been compiled from sources we believe to be reliable, but we do not hold ourselves responsible for its completeness or accuracy. All opinions and estimates expressed in this report constitute our present judgment only and are subject to change without notice. This report is intended for persons having professional experience in matters relating to investments. FINANCIALS INCOME STATEMENT FY2016A FY2017E FY2018E FY2019E FY2020E FY2021E Net sales 13,918 14,703 17,151 18,866 20,779 22,707 Cost of sales 8,332 9,112 10,467 11,571 12,643 13,766 Gross profit 5,586 5,592 6,684 7,295 8,136 8,940 Distribution costs 955 934 1,040 1,097 1,172 1,293 Administrative expenses 402 452 514 562 616 675 Other expenses 314 321 370 390 453 511 Other income 341 475 487 499 570 612 Profit from operations 4,257 4,360 5,247 5,745 6,465 7,073 Finance cost 21 16 334 648 467 211 Profit before taxation 4,236 4,344 4,913 5,097 5,999 6,862 Taxation 1,346 1,303 1,474 1,529 1,800 2,059 Profit after taxation 2,890 3,041 3,439 3,568 4,199 4,803 BALANCE SHEET FY2016A FY2017E FY2018E FY2019E FY2020E FY2021E Current assets 6,896 5,177 9,075 10,607 11,942 12,435 PPE 7,117 18,862 18,003 17,173 16,386 15,639 Non-current assets 7,232 18,985 18,135 17,313 16,526 15,781 Total assets 14,128 24,163 27,210 27,920 28,468 28,215 Current liabilities 2,337 2,840 2,849 2,701 3,285 4,624 Non-current liabilities 1,344 9,749 9,831 8,111 5,400 1,405 Long-term Liablitiy 0 5553 6941 5357 3,094 - Total liabilities 3,681 12,589 12,680 10,813 8,685 6,029 Share capital and reserves 10,447 11,574 14,530 17,108 19,783 22,186 Total equity and liabilities 14,128 24,163 27,210 27,920 28,468 28,215 RATIOS FY2016A FY2017E FY2018E FY2019E FY2020E FY2021E Profitability Ratios Return on Equity (ROE - %) 28% 25% 25% 23% 24% 24% Return on Asset (ROA - %) 20% 13% 13% 13% 15% 17% Gross Margin (%) 40% 38% 39% 39% 39% 39% Operating Margin 31% 30% 31% 30% 31% 31% Net Margin (%) 21% 21% 20% 19% 20% 21% EBIDA Margin 32% 34% 36% 35% 35% 35% Liquidity Ratios Quick Ratio (x) 2.3 1.2 2.5 3.1 2.9 2.1 Current Ratio (x) 1.9 0.4 0.7 0.9 1.1 1.5 Cash flow liquidity 4.0 3.0 4.0 4.9 4.7 3.6 Leverage Debt ratio 26% 50% 49% 44% 37% 29% L-T Debt to Total Capitalization 11% 43% 43% 38% 29% 15% Times interest earn 200 276 16 9 14 34 Cash Flow Adequacy 1.31 0.35 3.04 1.26 1.16 0.95 Source: Company Accounts, Alt-R Team Source: Company Accounts, Alt-R Team Source: Company Accounts, Alt-R Team
- 10. Analyst Certification The analyst primarily responsible for the content of this report, in whole or in part, certifies that with respect to each security or issuer that the analyst covered in this report (1) all of the views expressed accurately reflect his or her personal views about those securities or issuers; and (2) no part of his or her compensation was, is or will be directly or indirectly, related to the specific recommendations or views expressed by that research analyst in the research report. Important disclosures and disclaimer Information has been obtained from sources believed to be reliable but Alternate Research does not warrant its completeness or accuracy. The opinions and recommendations herein do not take into account individual client circumstances, objectives, or needs and are not intended as recommendations of particular securities, financial instruments or strategies to particular clients. The recipient of this report must make its own independent decisions regarding any securities or financial instruments mentioned herein. Investors should consider this report as only a single factor in making their investment decision. Periodic updates may be provided on companies/industries based on company specific developments or announcements, market conditions or any other publicly available information. All prices are those at the end of the previous trading session unless otherwise indicated. Additional information will be available upon request. Any opinions expressed herein are statements of our judgment as of the date of publication and are subject to change without notice. Reproduction without written permission is prohibited. Readers are advised that this analysis report is issued solely for information purposes and is not to be considered as an offer to sell or as the solicitation of an offer to buy. Past performance is no guarantee of future results. This report is not an offer to buy or sell or the solicitation of an offer to buy or sell any security or to participate in any particular trading strategy. Alternate Research may have an investment or trade securities or other instruments of companies mentioned in this report, and may trade them in ways different from those discussed in this report. Alternate Research may enter into transactions with companies mentioned in this report and there may be a potential conflict of interest. Employees of Alternate Research not involved in the preparation of this report may have investments in securities or other instruments of companies mentioned in this report, and may trade them in ways different from those discussed in this report. Alternate Research and its affiliate companies do business that relates to companies covered in its research reports, including corporate finance advisory, underwriting, fund management, investment services and investment banking. This document is issued to the person to whom Alternate Research has issued it. This document is intended for general information purposes only, and may not be reproduced or redistributed to any other person. This document is not intended as an offer or solicitation with respect to the purchase or sale of any security. This document is not intended to take into account any investment suitability needs of the recipient. In particular, this document is not customized to the specific investment objectives, financial situation, risk appetite or other needs of any person who may receive this document. Alternate Research strongly advises every potential investor to seek professional legal, accounting and financial guidance when determining whether an investment in a security is appropriate to his or her needs. Any investment recommendations contained in this document take into account both risk and expected return. Information and opinions contained in this document have been compiled or arrived at by Alternate Research from sources believed to be reliable, but Alternate Research has not independently verified the contents of this document and such information may be condensed or incomplete. Accordingly, no representation or warranty, express or implied, is made as to, and no reliance should be placed on the fairness, accuracy, completeness or correctness of the information and opinions contained in this document. To the maximum extent permitted by applicable law and regulation, Alternate Research shall not be liable for any loss that may arise from the use of this document or its contents or otherwise arising in connection therewith. Any financial projections, fair value estimates and statements regarding future prospects contained in this document may not be realized. All opinions and estimates included in this document constitute Alternate Research’s judgment as of the date of production of this document, and are subject to change without notice. Past performance of any investment is not indicative of future results. The value of securities, the income from them, the prices and currencies of securities, can go down as well as up. An investor may get back less than he or she originally invested. Additionally, fees may apply on investments in securities. Changes in currency rates may have an adverse effect on the value, price or income of a security. No part of this document may be reproduced without the written permission of Alternate Research. Neither this document nor any copy hereof may be distributed in any jurisdiction outside the Islamic Republic of Pakistan where its distribution may be restricted by law. Persons who receive this document should make themselves aware of, and adhere to, any such restrictions. By accepting this document, the recipient agrees to be bound by the foregoing limitations. Additional information is available on request. 10