SlideShare a Scribd company logo
1 of 2
Download to read offline
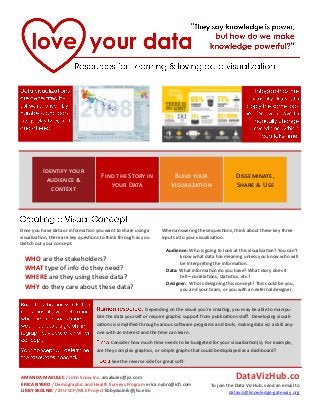
Once you have data or information you want to share using a
visualization, there are key questions to think through as you
sketch out your concept.
WHO are the stakeholders?
WHAT type of info do they need?
WHERE are they using these data?
WHY do they care about these data?
When answering these questions, think about these key three
inputs into your visualization.
Audience: Who is going to look at this visualization? You can’t
know what data has meaning unless you know who will
be interpreting the information.
Data: What information do you have? What story does it
tell—correlations, statistics, etc.?
Designer: Who is designing this concept? This could be you,
you and your team, or you with an external designer.
Depending on the visual you’re creating, you may be able to manipu-
late the data yourself or require graphic support from publications staff. Developing visuali-
zations is simplified through various software programs and tools, making data viz a skill any-
one with an interest and the time can learn.
Consider how much time needs to be budgeted for your visualization(s). For example,
are they complex graphics, or simple graphs that could be displayed as a dashboard?
See the reverse side for great soft-
Identify your
audience &
context
Find the Story in
your Data
Build your
Visualization
Disseminate,
Share & Use
AMANDA MAKULEC / John Snow Inc. amakulec@jsi.com
ERICA NYBRO / Demographic and Health Surveys Program erica.nybro@icfi.com
LIBBY SKOLNIK / JHU-CCP/MLE Project libbyskolnik@jhu.edu
DataVizHub.co
To join the Data Viz Hub, send an email to
dataviz@knowledge-gateway.org
DataMarket, http://datamarket.com
Access thousands of data sets from all over the world,
including UN and World Bank, or upload your own, and
then use the built in tools to create data visualizations.
Tableau, www.tableausoftware.com
Upload your own data and create data visualizations
with this very robust software.
Google Fusion Tables, www.google.com/fusiontables
Use Google to easily, quickly make fusion tables with
your data.
Dedoose, www.dedoose.com
A mixed-methods analysis software with the capacity
to generate compelling visualizations.
Gapminder, www.gapminder.org
Provides a fun interactive platform to explore relation-
ships between variables. Datasets are provided; this
platform was made famous by Hans Rosling.
*Note that some open source visualization programs make your data public
when you upload. Be sure to read the privacy & data sharing disclaimer.
Piktochart.com,
easel.ly and Infogr.am offer templates and design approaches
for infographics, if that’s the next step for your viz.
Timeline JS
(timeline.verite.co) allows you to create free timelines using
Excel or Google Docs. Tiki Toki (tiki-toki.com) also creates time-
lines, but requires you pay for external embed and public views.
Complex Diagrams, http://complexdiagrams.com/
Shows the properties and best uses of visual encod-
ings, i.e. whether it’s best to use shape or color to con-
vey your message.
Color Brewer, http://colorbrewer2.org/
Colorbrewer is an online tool designed to help people
select good color schemes for maps and other
graphics.
Junk Charts http://junkcharts.typepad.com/
Sometimes you might want to create a visualization using sec-
ondary data. The following sites are great resources for health-
related datasets:
DHS Program—http://www.dhsprogram.com—Contains
all DHS datasets .
STATcompiler—http://www.statcompiler.com—Simple
interface for downloading select DHS data in table s or visu-
alizations. Also has a mobile app available for Apple, An-
droid & Windows devices for on-the-go stats access!
World Bank Data—http://data.worldbank.org—includes
most WHO, DHS, and UN statistics.
Institute for Health Metrics and Evaluation (IHME) Global
Health Data Exchange—http://
www.healthmetricsandevaluation.org/ghdx—Includes data
from all IHME research and others.
AIDSVu.org—Has both state and county level HIV data
Have no fear: if your tool of choice is the
ubiquitous MS Excel, you can still create
beautiful visualizations.
Ann Emery (http://annkemery.com/excel)
has excellent short video tutorials in her
for creating interesting graphs using Excel
and some creative maneuvering of data,
rows, and columns.
Think about how to make your Excel graph
or chart sing: change fonts, color palettes,
and use other formatting tricks to trick
people into thinking you used a fancy viz
tool.
Think about your choice of chart types:
avoid creating pie charts, which can be
hard for the human eye to see, and con-
sider horizontal bar charts instead of verti-
cal ones, which give you more space for
your axis labels and categories.
Check out the flowchart at left for some
inspiration to help you go beyond
the bar chart!

More Related Content

More from Amanda Makulec

Developing Dashboards with User-Centered Design
Developing Dashboards with User-Centered DesignDeveloping Dashboards with User-Centered Design
Developing Dashboards with User-Centered DesignAmanda Makulec
 
The Simpsons, Design, and Data Use
The Simpsons, Design, and Data UseThe Simpsons, Design, and Data Use
The Simpsons, Design, and Data UseAmanda Makulec
 
Visualizations with Empathy
Visualizations with EmpathyVisualizations with Empathy
Visualizations with EmpathyAmanda Makulec
 
Visualizations with Empathy: Developing Audience Personas
Visualizations with Empathy: Developing Audience PersonasVisualizations with Empathy: Developing Audience Personas
Visualizations with Empathy: Developing Audience PersonasAmanda Makulec
 
Are Dashboards the Magic Bullet?
Are Dashboards the Magic Bullet?Are Dashboards the Magic Bullet?
Are Dashboards the Magic Bullet?Amanda Makulec
 
Designstorm How-to: Dot Plots
Designstorm How-to: Dot PlotsDesignstorm How-to: Dot Plots
Designstorm How-to: Dot PlotsAmanda Makulec
 
Designing Usage Dashboards for mHealth Program Monitoring
Designing Usage Dashboards for mHealth Program MonitoringDesigning Usage Dashboards for mHealth Program Monitoring
Designing Usage Dashboards for mHealth Program MonitoringAmanda Makulec
 
Data Visualization Design Best Practices Workshop
Data Visualization Design Best Practices WorkshopData Visualization Design Best Practices Workshop
Data Visualization Design Best Practices WorkshopAmanda Makulec
 
Making Data Meaningful
Making Data MeaningfulMaking Data Meaningful
Making Data MeaningfulAmanda Makulec
 
Chart Makeover: A Women's Nutrition Bar Chart
Chart Makeover: A Women's Nutrition Bar ChartChart Makeover: A Women's Nutrition Bar Chart
Chart Makeover: A Women's Nutrition Bar ChartAmanda Makulec
 
A Data Viz Makeover: Approaches for Improving your Visualizations
A Data Viz Makeover: Approaches for Improving your VisualizationsA Data Viz Makeover: Approaches for Improving your Visualizations
A Data Viz Makeover: Approaches for Improving your VisualizationsAmanda Makulec
 
Alternative Reporting Formats
Alternative Reporting FormatsAlternative Reporting Formats
Alternative Reporting FormatsAmanda Makulec
 
Introduction to Infographic Design
Introduction to Infographic DesignIntroduction to Infographic Design
Introduction to Infographic DesignAmanda Makulec
 
Creating Functional Art in Excel
Creating Functional Art in ExcelCreating Functional Art in Excel
Creating Functional Art in ExcelAmanda Makulec
 
Identifying Your Audience
Identifying Your AudienceIdentifying Your Audience
Identifying Your AudienceAmanda Makulec
 
August Designstorm: Alternative Reporting Formats
August Designstorm: Alternative Reporting FormatsAugust Designstorm: Alternative Reporting Formats
August Designstorm: Alternative Reporting FormatsAmanda Makulec
 
June Design-storm : Piktochart
June Design-storm : PiktochartJune Design-storm : Piktochart
June Design-storm : PiktochartAmanda Makulec
 

More from Amanda Makulec (20)

Developing Dashboards with User-Centered Design
Developing Dashboards with User-Centered DesignDeveloping Dashboards with User-Centered Design
Developing Dashboards with User-Centered Design
 
The Simpsons, Design, and Data Use
The Simpsons, Design, and Data UseThe Simpsons, Design, and Data Use
The Simpsons, Design, and Data Use
 
Visualizations with Empathy
Visualizations with EmpathyVisualizations with Empathy
Visualizations with Empathy
 
Visualizations with Empathy: Developing Audience Personas
Visualizations with Empathy: Developing Audience PersonasVisualizations with Empathy: Developing Audience Personas
Visualizations with Empathy: Developing Audience Personas
 
Are Dashboards the Magic Bullet?
Are Dashboards the Magic Bullet?Are Dashboards the Magic Bullet?
Are Dashboards the Magic Bullet?
 
Designstorm How-to: Dot Plots
Designstorm How-to: Dot PlotsDesignstorm How-to: Dot Plots
Designstorm How-to: Dot Plots
 
Data Dinner Parties
Data Dinner PartiesData Dinner Parties
Data Dinner Parties
 
The Human Element
The Human ElementThe Human Element
The Human Element
 
Designing Usage Dashboards for mHealth Program Monitoring
Designing Usage Dashboards for mHealth Program MonitoringDesigning Usage Dashboards for mHealth Program Monitoring
Designing Usage Dashboards for mHealth Program Monitoring
 
Data Visualization Design Best Practices Workshop
Data Visualization Design Best Practices WorkshopData Visualization Design Best Practices Workshop
Data Visualization Design Best Practices Workshop
 
Making Data Meaningful
Making Data MeaningfulMaking Data Meaningful
Making Data Meaningful
 
Chart Makeover: A Women's Nutrition Bar Chart
Chart Makeover: A Women's Nutrition Bar ChartChart Makeover: A Women's Nutrition Bar Chart
Chart Makeover: A Women's Nutrition Bar Chart
 
A Data Viz Makeover: Approaches for Improving your Visualizations
A Data Viz Makeover: Approaches for Improving your VisualizationsA Data Viz Makeover: Approaches for Improving your Visualizations
A Data Viz Makeover: Approaches for Improving your Visualizations
 
Alternative Reporting Formats
Alternative Reporting FormatsAlternative Reporting Formats
Alternative Reporting Formats
 
Introduction to Infographic Design
Introduction to Infographic DesignIntroduction to Infographic Design
Introduction to Infographic Design
 
Creating Functional Art in Excel
Creating Functional Art in ExcelCreating Functional Art in Excel
Creating Functional Art in Excel
 
Design for Delight
Design for DelightDesign for Delight
Design for Delight
 
Identifying Your Audience
Identifying Your AudienceIdentifying Your Audience
Identifying Your Audience
 
August Designstorm: Alternative Reporting Formats
August Designstorm: Alternative Reporting FormatsAugust Designstorm: Alternative Reporting Formats
August Designstorm: Alternative Reporting Formats
 
June Design-storm : Piktochart
June Design-storm : PiktochartJune Design-storm : Piktochart
June Design-storm : Piktochart
 

Recently uploaded

Call Girls Indiranagar Just Call 👗 7737669865 👗 Top Class Call Girl Service B...
Call Girls Indiranagar Just Call 👗 7737669865 👗 Top Class Call Girl Service B...Call Girls Indiranagar Just Call 👗 7737669865 👗 Top Class Call Girl Service B...
Call Girls Indiranagar Just Call 👗 7737669865 👗 Top Class Call Girl Service B...amitlee9823
 
BabyOno dropshipping via API with DroFx.pptx
BabyOno dropshipping via API with DroFx.pptxBabyOno dropshipping via API with DroFx.pptx
BabyOno dropshipping via API with DroFx.pptxolyaivanovalion
 
Smarteg dropshipping via API with DroFx.pptx
Smarteg dropshipping via API with DroFx.pptxSmarteg dropshipping via API with DroFx.pptx
Smarteg dropshipping via API with DroFx.pptxolyaivanovalion
 
Ravak dropshipping via API with DroFx.pptx
Ravak dropshipping via API with DroFx.pptxRavak dropshipping via API with DroFx.pptx
Ravak dropshipping via API with DroFx.pptxolyaivanovalion
 
Best VIP Call Girls Noida Sector 22 Call Me: 8448380779
Best VIP Call Girls Noida Sector 22 Call Me: 8448380779Best VIP Call Girls Noida Sector 22 Call Me: 8448380779
Best VIP Call Girls Noida Sector 22 Call Me: 8448380779Delhi Call girls
 
Best VIP Call Girls Noida Sector 39 Call Me: 8448380779
Best VIP Call Girls Noida Sector 39 Call Me: 8448380779Best VIP Call Girls Noida Sector 39 Call Me: 8448380779
Best VIP Call Girls Noida Sector 39 Call Me: 8448380779Delhi Call girls
 
BDSM⚡Call Girls in Mandawali Delhi >༒8448380779 Escort Service
BDSM⚡Call Girls in Mandawali Delhi >༒8448380779 Escort ServiceBDSM⚡Call Girls in Mandawali Delhi >༒8448380779 Escort Service
BDSM⚡Call Girls in Mandawali Delhi >༒8448380779 Escort ServiceDelhi Call girls
 
Data-Analysis for Chicago Crime Data 2023
Data-Analysis for Chicago Crime Data  2023Data-Analysis for Chicago Crime Data  2023
Data-Analysis for Chicago Crime Data 2023ymrp368
 
Cheap Rate Call girls Sarita Vihar Delhi 9205541914 shot 1500 night
Cheap Rate Call girls Sarita Vihar Delhi 9205541914 shot 1500 nightCheap Rate Call girls Sarita Vihar Delhi 9205541914 shot 1500 night
Cheap Rate Call girls Sarita Vihar Delhi 9205541914 shot 1500 nightDelhi Call girls
 
Zuja dropshipping via API with DroFx.pptx
Zuja dropshipping via API with DroFx.pptxZuja dropshipping via API with DroFx.pptx
Zuja dropshipping via API with DroFx.pptxolyaivanovalion
 
Call me @ 9892124323 Cheap Rate Call Girls in Vashi with Real Photo 100% Secure
Call me @ 9892124323  Cheap Rate Call Girls in Vashi with Real Photo 100% SecureCall me @ 9892124323  Cheap Rate Call Girls in Vashi with Real Photo 100% Secure
Call me @ 9892124323 Cheap Rate Call Girls in Vashi with Real Photo 100% SecurePooja Nehwal
 
Midocean dropshipping via API with DroFx
Midocean dropshipping via API with DroFxMidocean dropshipping via API with DroFx
Midocean dropshipping via API with DroFxolyaivanovalion
 
April 2024 - Crypto Market Report's Analysis
April 2024 - Crypto Market Report's AnalysisApril 2024 - Crypto Market Report's Analysis
April 2024 - Crypto Market Report's Analysismanisha194592
 
Al Barsha Escorts $#$ O565212860 $#$ Escort Service In Al Barsha
Al Barsha Escorts $#$ O565212860 $#$ Escort Service In Al BarshaAl Barsha Escorts $#$ O565212860 $#$ Escort Service In Al Barsha
Al Barsha Escorts $#$ O565212860 $#$ Escort Service In Al BarshaAroojKhan71
 
Schema on read is obsolete. Welcome metaprogramming..pdf
Schema on read is obsolete. Welcome metaprogramming..pdfSchema on read is obsolete. Welcome metaprogramming..pdf
Schema on read is obsolete. Welcome metaprogramming..pdfLars Albertsson
 
BPAC WITH UFSBI GENERAL PRESENTATION 18_05_2017-1.pptx
BPAC WITH UFSBI GENERAL PRESENTATION 18_05_2017-1.pptxBPAC WITH UFSBI GENERAL PRESENTATION 18_05_2017-1.pptx
BPAC WITH UFSBI GENERAL PRESENTATION 18_05_2017-1.pptxMohammedJunaid861692
 
Junnasandra Call Girls: 🍓 7737669865 🍓 High Profile Model Escorts | Bangalore...
Junnasandra Call Girls: 🍓 7737669865 🍓 High Profile Model Escorts | Bangalore...Junnasandra Call Girls: 🍓 7737669865 🍓 High Profile Model Escorts | Bangalore...
Junnasandra Call Girls: 🍓 7737669865 🍓 High Profile Model Escorts | Bangalore...amitlee9823
 
Chintamani Call Girls: 🍓 7737669865 🍓 High Profile Model Escorts | Bangalore ...
Chintamani Call Girls: 🍓 7737669865 🍓 High Profile Model Escorts | Bangalore ...Chintamani Call Girls: 🍓 7737669865 🍓 High Profile Model Escorts | Bangalore ...
Chintamani Call Girls: 🍓 7737669865 🍓 High Profile Model Escorts | Bangalore ...amitlee9823
 
CebaBaby dropshipping via API with DroFX.pptx
CebaBaby dropshipping via API with DroFX.pptxCebaBaby dropshipping via API with DroFX.pptx
CebaBaby dropshipping via API with DroFX.pptxolyaivanovalion
 

Recently uploaded (20)

Delhi 99530 vip 56974 Genuine Escort Service Call Girls in Kishangarh
Delhi 99530 vip 56974 Genuine Escort Service Call Girls in  KishangarhDelhi 99530 vip 56974 Genuine Escort Service Call Girls in  Kishangarh
Delhi 99530 vip 56974 Genuine Escort Service Call Girls in Kishangarh
 
Call Girls Indiranagar Just Call 👗 7737669865 👗 Top Class Call Girl Service B...
Call Girls Indiranagar Just Call 👗 7737669865 👗 Top Class Call Girl Service B...Call Girls Indiranagar Just Call 👗 7737669865 👗 Top Class Call Girl Service B...
Call Girls Indiranagar Just Call 👗 7737669865 👗 Top Class Call Girl Service B...
 
BabyOno dropshipping via API with DroFx.pptx
BabyOno dropshipping via API with DroFx.pptxBabyOno dropshipping via API with DroFx.pptx
BabyOno dropshipping via API with DroFx.pptx
 
Smarteg dropshipping via API with DroFx.pptx
Smarteg dropshipping via API with DroFx.pptxSmarteg dropshipping via API with DroFx.pptx
Smarteg dropshipping via API with DroFx.pptx
 
Ravak dropshipping via API with DroFx.pptx
Ravak dropshipping via API with DroFx.pptxRavak dropshipping via API with DroFx.pptx
Ravak dropshipping via API with DroFx.pptx
 
Best VIP Call Girls Noida Sector 22 Call Me: 8448380779
Best VIP Call Girls Noida Sector 22 Call Me: 8448380779Best VIP Call Girls Noida Sector 22 Call Me: 8448380779
Best VIP Call Girls Noida Sector 22 Call Me: 8448380779
 
Best VIP Call Girls Noida Sector 39 Call Me: 8448380779
Best VIP Call Girls Noida Sector 39 Call Me: 8448380779Best VIP Call Girls Noida Sector 39 Call Me: 8448380779
Best VIP Call Girls Noida Sector 39 Call Me: 8448380779
 
BDSM⚡Call Girls in Mandawali Delhi >༒8448380779 Escort Service
BDSM⚡Call Girls in Mandawali Delhi >༒8448380779 Escort ServiceBDSM⚡Call Girls in Mandawali Delhi >༒8448380779 Escort Service
BDSM⚡Call Girls in Mandawali Delhi >༒8448380779 Escort Service
 
Data-Analysis for Chicago Crime Data 2023
Data-Analysis for Chicago Crime Data  2023Data-Analysis for Chicago Crime Data  2023
Data-Analysis for Chicago Crime Data 2023
 
Cheap Rate Call girls Sarita Vihar Delhi 9205541914 shot 1500 night
Cheap Rate Call girls Sarita Vihar Delhi 9205541914 shot 1500 nightCheap Rate Call girls Sarita Vihar Delhi 9205541914 shot 1500 night
Cheap Rate Call girls Sarita Vihar Delhi 9205541914 shot 1500 night
 
Zuja dropshipping via API with DroFx.pptx
Zuja dropshipping via API with DroFx.pptxZuja dropshipping via API with DroFx.pptx
Zuja dropshipping via API with DroFx.pptx
 
Call me @ 9892124323 Cheap Rate Call Girls in Vashi with Real Photo 100% Secure
Call me @ 9892124323  Cheap Rate Call Girls in Vashi with Real Photo 100% SecureCall me @ 9892124323  Cheap Rate Call Girls in Vashi with Real Photo 100% Secure
Call me @ 9892124323 Cheap Rate Call Girls in Vashi with Real Photo 100% Secure
 
Midocean dropshipping via API with DroFx
Midocean dropshipping via API with DroFxMidocean dropshipping via API with DroFx
Midocean dropshipping via API with DroFx
 
April 2024 - Crypto Market Report's Analysis
April 2024 - Crypto Market Report's AnalysisApril 2024 - Crypto Market Report's Analysis
April 2024 - Crypto Market Report's Analysis
 
Al Barsha Escorts $#$ O565212860 $#$ Escort Service In Al Barsha
Al Barsha Escorts $#$ O565212860 $#$ Escort Service In Al BarshaAl Barsha Escorts $#$ O565212860 $#$ Escort Service In Al Barsha
Al Barsha Escorts $#$ O565212860 $#$ Escort Service In Al Barsha
 
Schema on read is obsolete. Welcome metaprogramming..pdf
Schema on read is obsolete. Welcome metaprogramming..pdfSchema on read is obsolete. Welcome metaprogramming..pdf
Schema on read is obsolete. Welcome metaprogramming..pdf
 
BPAC WITH UFSBI GENERAL PRESENTATION 18_05_2017-1.pptx
BPAC WITH UFSBI GENERAL PRESENTATION 18_05_2017-1.pptxBPAC WITH UFSBI GENERAL PRESENTATION 18_05_2017-1.pptx
BPAC WITH UFSBI GENERAL PRESENTATION 18_05_2017-1.pptx
 
Junnasandra Call Girls: 🍓 7737669865 🍓 High Profile Model Escorts | Bangalore...
Junnasandra Call Girls: 🍓 7737669865 🍓 High Profile Model Escorts | Bangalore...Junnasandra Call Girls: 🍓 7737669865 🍓 High Profile Model Escorts | Bangalore...
Junnasandra Call Girls: 🍓 7737669865 🍓 High Profile Model Escorts | Bangalore...
 
Chintamani Call Girls: 🍓 7737669865 🍓 High Profile Model Escorts | Bangalore ...
Chintamani Call Girls: 🍓 7737669865 🍓 High Profile Model Escorts | Bangalore ...Chintamani Call Girls: 🍓 7737669865 🍓 High Profile Model Escorts | Bangalore ...
Chintamani Call Girls: 🍓 7737669865 🍓 High Profile Model Escorts | Bangalore ...
 
CebaBaby dropshipping via API with DroFX.pptx
CebaBaby dropshipping via API with DroFX.pptxCebaBaby dropshipping via API with DroFX.pptx
CebaBaby dropshipping via API with DroFX.pptx
 

Love Your Data : Viz Highlights

  • 1. Once you have data or information you want to share using a visualization, there are key questions to think through as you sketch out your concept. WHO are the stakeholders? WHAT type of info do they need? WHERE are they using these data? WHY do they care about these data? When answering these questions, think about these key three inputs into your visualization. Audience: Who is going to look at this visualization? You can’t know what data has meaning unless you know who will be interpreting the information. Data: What information do you have? What story does it tell—correlations, statistics, etc.? Designer: Who is designing this concept? This could be you, you and your team, or you with an external designer. Depending on the visual you’re creating, you may be able to manipu- late the data yourself or require graphic support from publications staff. Developing visuali- zations is simplified through various software programs and tools, making data viz a skill any- one with an interest and the time can learn. Consider how much time needs to be budgeted for your visualization(s). For example, are they complex graphics, or simple graphs that could be displayed as a dashboard? See the reverse side for great soft- Identify your audience & context Find the Story in your Data Build your Visualization Disseminate, Share & Use AMANDA MAKULEC / John Snow Inc. amakulec@jsi.com ERICA NYBRO / Demographic and Health Surveys Program erica.nybro@icfi.com LIBBY SKOLNIK / JHU-CCP/MLE Project libbyskolnik@jhu.edu DataVizHub.co To join the Data Viz Hub, send an email to dataviz@knowledge-gateway.org
  • 2. DataMarket, http://datamarket.com Access thousands of data sets from all over the world, including UN and World Bank, or upload your own, and then use the built in tools to create data visualizations. Tableau, www.tableausoftware.com Upload your own data and create data visualizations with this very robust software. Google Fusion Tables, www.google.com/fusiontables Use Google to easily, quickly make fusion tables with your data. Dedoose, www.dedoose.com A mixed-methods analysis software with the capacity to generate compelling visualizations. Gapminder, www.gapminder.org Provides a fun interactive platform to explore relation- ships between variables. Datasets are provided; this platform was made famous by Hans Rosling. *Note that some open source visualization programs make your data public when you upload. Be sure to read the privacy & data sharing disclaimer. Piktochart.com, easel.ly and Infogr.am offer templates and design approaches for infographics, if that’s the next step for your viz. Timeline JS (timeline.verite.co) allows you to create free timelines using Excel or Google Docs. Tiki Toki (tiki-toki.com) also creates time- lines, but requires you pay for external embed and public views. Complex Diagrams, http://complexdiagrams.com/ Shows the properties and best uses of visual encod- ings, i.e. whether it’s best to use shape or color to con- vey your message. Color Brewer, http://colorbrewer2.org/ Colorbrewer is an online tool designed to help people select good color schemes for maps and other graphics. Junk Charts http://junkcharts.typepad.com/ Sometimes you might want to create a visualization using sec- ondary data. The following sites are great resources for health- related datasets: DHS Program—http://www.dhsprogram.com—Contains all DHS datasets . STATcompiler—http://www.statcompiler.com—Simple interface for downloading select DHS data in table s or visu- alizations. Also has a mobile app available for Apple, An- droid & Windows devices for on-the-go stats access! World Bank Data—http://data.worldbank.org—includes most WHO, DHS, and UN statistics. Institute for Health Metrics and Evaluation (IHME) Global Health Data Exchange—http:// www.healthmetricsandevaluation.org/ghdx—Includes data from all IHME research and others. AIDSVu.org—Has both state and county level HIV data Have no fear: if your tool of choice is the ubiquitous MS Excel, you can still create beautiful visualizations. Ann Emery (http://annkemery.com/excel) has excellent short video tutorials in her for creating interesting graphs using Excel and some creative maneuvering of data, rows, and columns. Think about how to make your Excel graph or chart sing: change fonts, color palettes, and use other formatting tricks to trick people into thinking you used a fancy viz tool. Think about your choice of chart types: avoid creating pie charts, which can be hard for the human eye to see, and con- sider horizontal bar charts instead of verti- cal ones, which give you more space for your axis labels and categories. Check out the flowchart at left for some inspiration to help you go beyond the bar chart!