More Related Content
Similar to Prstat and Processes Oracle
Similar to Prstat and Processes Oracle (20)
More from Anar Godjaev (20)
Prstat and Processes Oracle
- 1. Prstat and processes oracle
The report below shows that the oracle user processes cupy 94% of the RAM, which is almost 188GB,
while the RAM on the server in the amount equal to vsego32GB (16GB of physical memory + 4GB of
virtual memory).
Physical memory:
oracle@myhost $ prtdiaggrepMemory
Memorysize: 16384 Megabytes
Virtual memory:
oracle@myhost $ vmstat 3 3
kthrmemorypagediskfaultscpurbwswapfreeremfpipofrdesrs0 sdsdsdinsycsussyid
0 0 0 16319144 8342704 15 104 7 8 8 15688 0 0 0 0 0 473 2256 2086 2 1 97
0 0 0 4425048 280488 33 409 0 3 3 11448 0 0 0 0 0 1076 408191 5033 24 15 60
0 0 0 4425048 280440 25 255 0 13 13 8352 0 0 0 0 0 867 429324 6717 25 15 59
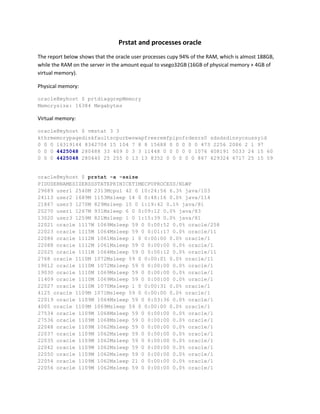
oracle@myhost $ prstat -a -ssize
PIDUSERNAMESIZERSSSTATEPRINICETIMECPUPROCESS/NLWP
29689 user1 2540M 2313Mcpu1 42 0 10:24:56 6.3% java/103
24113 user2 1689M 1153Msleep 14 0 0:48:16 0.0% java/114
21867 user3 1270M 829Msleep 15 0 1:19:42 0.1% java/81
20270 user1 1267M 931Msleep 6 0 0:09:12 0.0% java/83
13020 user3 1259M 821Msleep 1 0 1:15:39 0.0% java/81
22021 oracle 1117M 1069Msleep 59 0 0:00:52 0.0% oracle/258
22023 oracle 1115M 1064Msleep 59 0 0:01:17 0.0% oracle/11
22086 oracle 1112M 1061Msleep 1 0 0:00:00 0.0% oracle/1
22088 oracle 1112M 1061Msleep 59 0 0:00:00 0.0% oracle/1
22025 oracle 1111M 1064Msleep 59 0 0:00:12 0.0% oracle/11
2768 oracle 1110M 1072Msleep 59 0 0:00:01 0.0% oracle/11
19012 oracle 1110M 1072Msleep 59 0 0:00:00 0.0% oracle/1
19030 oracle 1110M 1069Msleep 59 0 0:00:00 0.0% oracle/1
11409 oracle 1110M 1069Msleep 59 0 0:00:00 0.0% oracle/1
22027 oracle 1110M 1070Msleep 1 0 0:00:31 0.0% oracle/1
4125 oracle 1109M 1071Msleep 59 0 0:00:00 0.0% oracle/1
22019 oracle 1109M 1064Msleep 59 0 0:03:36 0.0% oracle/1
4005 oracle 1109M 1069Msleep 59 0 0:00:00 0.0% oracle/1
27534 oracle 1109M 1068Msleep 59 0 0:00:00 0.0% oracle/1
27536 oracle 1109M 1068Msleep 59 0 0:00:00 0.0% oracle/1
22048 oracle 1109M 1062Msleep 59 0 0:00:00 0.0% oracle/1
22037 oracle 1109M 1062Msleep 59 0 0:00:00 0.0% oracle/1
22035 oracle 1109M 1062Msleep 59 0 0:00:00 0.0% oracle/1
22042 oracle 1109M 1062Msleep 59 0 0:00:00 0.0% oracle/1
22050 oracle 1109M 1062Msleep 59 0 0:00:00 0.0% oracle/1
22054 oracle 1109M 1062Msleep 21 0 0:00:00 0.0% oracle/1
22056 oracle 1109M 1062Msleep 59 0 0:00:00 0.0% oracle/1
- 2. 22060 oracle 1109M 1062Msleep 59 0 0:00:00 0.0% oracle/1
22064 oracle 1109M 1062Msleep 59 0 0:00:00 0.0% oracle/1
22058 oracle 1109M 1062Msleep 59 0 0:00:00 0.0% oracle/1
22070 oracle 1109M 1062Msleep 53 0 0:00:00 0.0% oracle/1
22066 oracle 1109M 1062Msleep 59 0 0:00:00 0.0% oracle/1
22068 oracle 1109M 1062Msleep 59 0 0:00:00 0.0% oracle/1
NPROCUSERNAMESIZERSSMEMORYTIMECPU
184 oracle 196G 188G 94% 0:44:30 0.1%
1 vmpapp2 2540M 2313M 1.1% 10:24:56 6.3%
1 vmpapp3 1689M 1153M 0.6% 0:48:16 0.0%
4 vmpods5 1272M 935M 0.5% 0:09:12 0.0%
1 vmpods2 1270M 829M 0.4% 1:19:42 0.1%
1 vmpods4 1259M 821M 0.4% 1:15:39 0.0%
6 vmpapp1 1012M 537M 0.3% 0:06:59 0.0%
1 vmpapp4 1005M 516M 0.3% 0:06:23 0.0%
2 vmpapp5 978M 492M 0.2% 0:08:46 0.6%
1 vmpjms4 975M 479M 0.2% 0:04:49 0.0%
Total: 277 processes, 2763 lwps, loadaverages: 2.62, 2.61, 2.52
Many utilities Solaris is not quite correct to find statistics on the
processes that work with shared memory (shared memory), in this case, a
shared-memory Oracle.
It turns out that the utility prstat adds shared memory for all processes
oracle.
oracle@myhost $ ps -efgreporawc -l
185
The total size of SGA instance oracle:
oracle@myhost $ sqlplus '/assysdba'
SQL>showsga
TotalSystemGlobalArea 1075651720 bytes
If we multiply the number of processes on the total size of the SGA, we get
closer to 188GB, which showed us prstat. Of course, a more accurate estimate,
you need to add more size PGA for each process.
185 * 1 075 651 720 bytes = 198 995 568 200 bytes = 185GB