Recommended

Recommended
More Related Content
Recently uploaded
Recently uploaded (20)
Featured
Featured (20)
Identifying Evolutionary Pressures in the Connective Tissue Growth Factor Gene
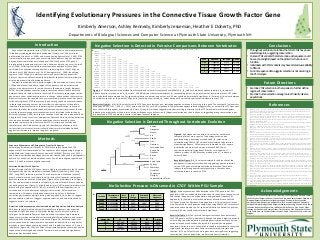
- 1. Acknowledgements We would like to thank Plymouth State University, the PSU Research Advisory Council, the PSU Student Research Advisory Council, and the New Hampshire Idea Network of Biological Research Excellence for funding support. We would like to thank the University of New Hampshire Hubbard Center for Genome Studies and Dartmouth College Molecular Biology Shared Resources Lab for sequencing. We would also like to thank Jon Bairam, Kevin Chesmore, Joel Dufour, Hailey Gentile, Evyn Grimes, Ethan Johnson, Kathryn Kahrhoff, Lauren Oakes, Stacy Peterson, Ellen Rounds, Harlie Shaul, Lorna Smith, Kate-Lyn Skribiski, Zachary Stevens, Amed Torres, Zoe White, and Alycia Wiggins. Conclusions Departments of Biological Sciences and Computer Science at Plymouth State University, Plymouth NH References 1. Colwell, A., Phan, T., Kong, W., Longaker, M., Lorenz, P. 2005. Hypertrophic scar fibroblasts have increased connective tissue growth factor expression after transforming growth factor-beta stimulation. Plastic and Reconstructive Surgery, 116(5): 1387-1390. 2. Dessein, A., Chevillard, C., Arnaud, A., Hou, X., Hamdoun, A., Dessein, H., He, H., Abdelmaboud, S., Lou, X., Li, J., Varoquaux, A., Mergani, A., Abdelwahed, M., Zhou, J., Monis, A., Pitta, M., Gasmelseed, N., Cabantous, S., Zhao, Y., Prata, A., Brandt, C., Elwali, N., Argiro, L., & Li, Y. 2009. Variants of CTGF are associated with hepatic fibrosis in Chinese, Sudanese, and Brazillians infected with Schstosomes. The Journal of Experimental Medicine, 206(11):2321-2328. 3. Farfan, M., Minana-Galbis, D., Fuste, M.C., & Loren, J.G. 2009. Divergent evolution and purifying selection of the flaA gene sequences in Aeromonas. Biology Direct, 4(23). 4. Fonseca, C., Lindahl, G., Ponticos, M., Sestini, P., Renzoni, E., Holmes, A., Spagnolo, P., Pantelidis, P., Leoni, P., McHugh, N., Stock, C., Wen, X., Denton, C., Black, C., Welsh, K., du Bois, R.,& Abraham, D. 2007. A Polymorphism in the CTGF Promoter Region Associated with Systemic Sclerosis. The New England Journal of Medicine. 5. Frazier, K., Williams, S., Kothapalli, D., Klapper, H., Grontendoest, G. 1996. Stimulation of Fibroblast Cell Growth, Matrix Production, and Granulation Tissue Formation by Connective Tissue Growth Factor. The Journal of Investigative Dermatology, 107(3): 404-411. 6. Huttley, G. Easteal, S., Southey, M., Tesoriero, A., Giles, G., McCredie, M., Hopper, J., Venter, D., & Australian Breast Cancer Family Study. 2000. Adaptive evolution of the tumour suppressor BRCA 1 in humans and chimpanzees. Nature America Inc, 25:410-413. 7. Igarashi, A., Okochi, H., Bradham, D., & Grotendorst, G. 1993. Regulation of Connective Tissue Growth Factor Gene Expression in Human Skin Fibroblasts and During Wound Repair. Molecular Biology of the Cell, 4: 637- 645. 8. Ivkovic, S., Yoon, B., Popoff, S., Safadi, F., Libuda, D., Stephenson, R., Daluiski, A., & Lyons, K. 2003. Connective tissue growth factor coordinates chondrogenesis and angiogenesis during skeletal development. Development, 130(12): 2779-2791. 9. Kawaguchi, Y., Ota, Y., Kawamoto, M., Ito, I., Tsuchiya, N., Sugiura, T., Katsumata, Y., Soejima, M., Sato, S., Hasegawa, M., Fujimoto, M., Takehara, K., Kuwana, M., Yamanaka, H., Hara, M. 2009. Association study of a polymorphism of the CTGF gene and susceptibility to systemic sclerosis in the Japanese population. Annals of the Rheumatic Diseases, 68(12): 1921-1924. 10. Miyata, T. & Yasunaga, T. 1980. Molecular evolution of mRNA: a method for estimating evolutionary rates of synonymous and amino acid substitutions from homologous nucleotide sequences and its applications. Journal of Molecular Evolution, 16(1): 23-36. 11. Shimo, T., Nakanishi, T., Nishida, T., Asano, M., Kanyama, M., Kuboki, T., Tamatani, T., Tezuka, K., Takemura, M., Matsumura, T., & Takigawa, M. 1999. Connective tissue growth factor induces the proliferation, migration, and tube formation of vascular endothelial cells in vitro, and angiogenesis in vivo. The Journal of Biochemistry, 126(1): 137-145. 12. Xu, B. and Yang, Z. 2013. PAMLX: a graphical user interface for PAML. Molecular Biology and Evolution, 30(12): 2723-2724. 13. Yang, Z. 1997. PAML: a program package for phylogenetic analysis by maximum likelihood. Computer Applications in the Biosciences, 13(5): 555-556. 14. Yang, Z. & Bielawski, J. 2000. Statistical methods for detecting molecular adaptation. TREE, 15(12): 496-503. 15. Yang, Z. & Nielson, R. 2002. Codon-substitution models for detecting molecular adaptation at individual sites along specific lineages. Mol. Biol. Evol. 19(6):908-917. 16. Yang, Z. 2007. PAML4: phylogenetic analysis by maximum likelihood. Molecular Biology and Evolution, 24(8): 1586-1591. • Examine CTGF selection in other species to further define regions of conservation • Examine human selection among more ethnically diverse populations • Throughout evolution, mutations that alter CTGF have been selected against, suggesting conservation • Human CTGF variants that alter amino acid sequence could have a meaningful impact on the protein’s structure and function • Individuals with CTGF variants may have altered susceptibility to fibrosis • Current sequence data suggests selection is not occurring in the PSU sample Identifying Evolutionary Pressures in the Connective Tissue Growth Factor Gene Kimberly Amerson, Ashley Kennedy, Kimberly Jesseman, Heather E Doherty, PhD Future Directions Negative Selection is Detected in Pairwise Comparisons Between Vertebrates Human Orngtn Rabbit Pika GuinPg Mouse Rat Elephnt Pig Bovine Opossm TsmDvl AnlLzd Platyps Chcken ZbrFnch Flyctch ChTrtl Human Orangutan 0.1786 Rabbit 0.2277 0.2197 Pika 0.1790 0.1620 0.2764 GuinPig 0.2209 0.2301 0.2564 0.2612 Mouse 0.0956 0.0877 0.1273 0.1559 0.1639 Rat 0.0995 0.0913 0.1371 0.1489 0.1601 0.0678 Elephant 0.1628 0.1534 0.1783 0.1733 0.1444 0.0791 0.0810 Pig 0.0994 0.0961 0.1570 0.1654 0.1767 0.0760 0.0686 0.1128 Bovine 0.0974 0.0978 0.1581 0.1447 0.1788 0.0828 0.0803 0.1265 0.0760 Opossum 0.0598 0.0647 0.0702 0.0930 0.0738 0.0635 0.0762 0.0824 0.0618 0.0588 TasmDvl 0.0675 0.0681 0.0714 0.0830 0.0804 0.0639 0.0740 0.0755 0.0684 0.0653 0.0259 AnoleLzd 0.0778 0.0764 0.1106 0.1155 0.0996 0.0844 0.0773 0.0959 0.0839 0.0879 0.0682 0.0675 Platypus 0.1066 0.1091 0.1193 0.1622 0.1442 0.1016 0.0920 0.0986 0.1104 0.1132 0.0535 0.0648 0.1031 Chicken 0.0986 0.1014 0.1285 0.1390 0.1068 0.0757 0.0815 0.1011 0.0888 0.1046 0.0436 0.0594 0.0803 0.1037 ZbrFnch 0.0876 0.0886 0.0951 0.0975 0.0980 0.0654 0.0675 0.0851 0.0663 0.0987 0.0563 0.0721 0.0849 0.0817 0.0599 Flyctchr 0.1063 0.1068 0.1139 0.1238 0.1125 0.0842 0.0917 0.0896 0.0917 0.1234 0.0564 0.0778 0.0919 0.1117 0.0690 0.0965 ChTrtl 0.1051 0.1156 0.0850 0.1174 0.1145 0.1210 0.1085 0.1248 0.1179 0.1229 0.1020 0.1256 0.1550 0.1206 0.1381 0.1770 0.1743 Coelacnth -1.000 -1.000 0.0367 0.0650 -1.000 0.0570 0.0556 0.0795 0.0530 -1.000 0.0523 0.0658 0.0630 0.0696 0.0785 0.0728 0.0922 0.1216 Exon Selection LRT value p-value 1 & 2 < 1; negative 41.379 < 0.0001 3 < 1; negative 85.770 < 0.0001 4 < 1; negative 58.471 < 0.0001 5 < 1; negative 58.471 < 0.0001 Location Chromosome Location Base Change A.A. Change Published Frequency Observed Frequency Exon 2 6:131950889 G/A C56Y unpublished 0.057 Exon 2 6:131950812 C/G H83D >0.99 0.989 Exon 2 6:131950778 T/C V94A unpublished 0.057 Exon 3 6:131950313 G/A V174M <0.01 0.006 Human Exon L1 L0 LRT p-value 1 & 2 -337.099 -337.411 0.622 0.430 3 -268.287 -268.509 0.443 0.416 4 -70.051 -70.051 4.00*10-6 ~1 5 -237.590 -237.590 1.15*10-4 ~1 Figure 2: A phylogenetic tree with dN/dS values for each branch comparing two or more species. The phylogenetic tree was generated using a bootstrap method and dN/dS values were calculated using PAMLX. LRT values were calculated to determine statistical significance. LRT values were compared to a Chi-square distribution to determine p-values, where p<0.00625 was considered statistically significant. Branches marked with a * indicate p-values <0.001. Branches marked with a ** indicate p- values <0.0001. Results for Figure 2: dN/dS values calculated for all branches of the phylogenetic tree were less than one, suggesting negative selection for the CTGF gene at multiple evolutionary branches. These data indicate that, throughout vertebrate evolution, there has been selective pressure to conserve CTGF. Table 1: A) Nonsynonymous SNPs detected in the CTGF gene in our PSU population. SNP list includes information about location, base change, amino acid change, frequency in our population, and published frequency (if applicable). B) Summary of selective pressures detected in exons of the CTGF gene within the Plymouth State population. dN/dS values for all exons were computed for each pairwise comparison using PAMLX. LRT values were calculated and compared to a Chi-square distribution to determine p-values, where p<0.05 was considered statistically significant. Results for Table 1: A) Four protein coding variants have been detected in the CTGF gene in our PSU population. Although this gene is highly conserved across a long evolutionary period, multiple genetic variations that alter the amino acid sequence have been detected in a relatively homogenous population. Variants in our PSU sample are found in evolutionarily conserved regions and, therefore, are more likely to impact protein structure and function. B) The p-values for exonic regions were not significant, suggesting that within our human population, we observed neutral selection. Figure 1: CTGF sequences were obtained from Ensembl and values were computed using PAMLX. dN/dS values <1 indicate negative selection, dN/dS values >1 indicate positive selection, and a dN/dS value = -1.0000 indicates that after adjustment for confounding factors, no synonymous variants were present. LRT values were calculated and compared to a Chi-square distribution to determine p-values. p<0.05 was considered statistically significant. A) Pairwise dN/dS values between 19 vertebrate species for the whole CTGF gene. B) Summary of pairwise dN/dS values between 19 vertebrate species for individual exons of CTGF. Results for Figure 1: A) All dN/dS values for the full CTGF gene are less than one, indicating negative selection is occurring in this gene. The average LRT value across all species is 92.97 (L0 = -7959, L1 = -7913) with p-value <0.001 (p<0.05 is significant). The detected negative selection suggests that, as a whole, the CTGF gene has been conserved throughout its evolutionary history. Strong conservation suggests mutations resulting in alteration to the CTGF protein were selected against, indicating the importance of the protein’s amino acid sequence to its function. B) Negative selection was seen in all exons, suggesting strong conservation is not just observed in CTGF as a whole, but also in individual exons of this gene. No Selective Pressure is Observed in CTGF Within PSU Sample Negative Selection is Detected Throughout Vertebrate Evolution Connective tissue growth factor (CTGF) is a protein vital to numerous processes in the body including blood vessel development (Shimo et al., 1999), cellular proliferation (Frazier et al., 1996), and wound healing (Igarashi et al., 1993). CTGF is also important in bone and connective tissue development, and has only been observed in vertebrate species (Ivkovic et al., 2003). When the CTGF gene is overexpressed, development of scar tissue, known as fibrosis, can occur (Colwell et al., 2005). Differing levels of fibrosis susceptibility and severity have been correlated with variations among humans in certain regions of the CTGF gene (Dessein et al, 2009, Fonseca et al., 2007, Kawaguchi et al., 2009). Identifying regions of the CTGF gene in which variants may be most likely to impact the protein’s structure and function could help identify those variants more likely to alter an individual’s risk of developing fibrosis. To detect these potentially important regions, the evolutionary history of the CTGF gene was examined. Some regions of the genome, known as conserved regions, are under pressure to remain the same (Reviewed in Yang & Bielawski, 2000). Very few changes that alter protein structure and function are observed between species in regions that are conserved. Alternatively, some regions of the genome are under evolutionary pressure to change, and variations that may alter protein structure or function are seen more commonly in these areas. Our goal is to identify regions of CTGF that are conserved among species, because variations in these regions among humans are more likely to alter regions of the protein involved in important functions. To detect regions of conservation, the ratio of variations that alter the protein sequence (nonsynonymous) to variations that do not alter the protein sequence (synonymous) were calculated (as described by Miyata & Yasunaga, 1980). Intra-species variations in humans were also examined using the CTGF sequences from individuals at Plymouth State University. Variations that we have detected in our human population that are located in these conserved regions are more likely to alter CTGF structure and function and therefore may alter fibrosis severity and risk. Identification of patients with variants likely to increase fibrosis risk could allow for more individualized and aggressive treatments to improve long-term prognosis. Sequence Alignments and Phylogenetic Trees for 19 Species Ensembl genome browser (Flicek et al., 2014) was used to obtain the CTGF sequences of 19 vertebrate species. The sequences were aligned using a program called Molecular Evolutionary Genetics Analysis 7 (MEGA7) (Tamura et al., 2015), and a maximum likelihood phylogenetic tree was created to be used in phylogenetic analysis. For analysis of individual exons, exons 1 and 2 were aligned together and exons 3, 4 and 5 were each aligned separately. Selection Analysis for 19 Species To identify regions of the CTGF gene that are highly conserved across the 19 species, Phylogenetic Analysis by Maximum Likelihood (PAMLX) (Xu & Yang, 2013, Yang, 1997, Yang, 2007) software was used. The codon maximum likelihood (codeml) branch model was used to calculate the dN/dS ratios for all pairwise comparisons between species for both the whole gene (Figure 1A) and individual exons (Figure 1B). The same method was used to calculate dN/dS values for each branch node on the phylogenetic tree (Figure 2). A likelihood ratio test (LRT) was performed for each branch using the equation LRT=2*(L0-L1), where L0 is the null hypothesis of no selection and L1 is the alternative hypothesis of selection. LRT values were compared to a Chi-square distribution to determine p-values. A Bonferroni correction was made for multiple testing, when needed. dN/dS values > 1 suggest positive selection, values < 1 suggest negative selection, and values close to one suggest neutral or no selection. Detection of Nonsynonymous Variants and Human Population Selection Analysis DNA from cheek cells obtained from Plymouth State volunteers was extracted, amplified using PCR and sent to Molecular Biology Core Facility at Dartmouth College or UNH Hubbard Center of Genome Studies for sequencing. Returned sequences were then analyzed for variants using PolyPhred software, and variants that altered the protein sequence were noted (Figure 3A). Returned sequences were also analyzed for selection within human evolutionary history, using similar methods to those above, examining exons 1 and 2 together, and exons 3, 4, and 5 individually (Figure 3B). L0 and L1 values for pairwise comparisons between human sequences were averaged and then LRT values were calculated and significance determined as described above. * 0.0946 ** 0.0001 ** 0.2109 ** 0.0001 ** 0.0470 ** 0.0501** 0.1390 ** 0.0091 ** 0.1917 ** 0.0337 ** 0.0942 ** 0.0408 ** 0.4282 ** 0.0721 ** 0.0623 ** 0.0513 ** 0.1585 Methods Introduction A B A B Human Mouse Orangutan Rat Rabbit Pika Opossum Tasmanian Devil Guinea Pig Elephant Bovine Pig Anole Lizard Chicken Zebrafinch Flycatcher Coelacanth Platypus Chinese Softshell Turtle