India's Declining Savings Rate & its Implications
•
0 likes•1,041 views

Their has been a remarkable shift in the savings-investment gap at the global level as well as in India. While this has had a tangible impact on global potential growth, the recovery is likely to differ from one country to another. In the Indian context, the recovery in trend growth is likely to be much higher than what is generally peceived and thus requires a more proactive response from policy makers, especially the monetary authorities.

Recommended
Recommended
More Related Content
What's hot
What's hot (20)
Viewers also liked
Viewers also liked (17)
Similar to India's Declining Savings Rate & its Implications
Similar to India's Declining Savings Rate & its Implications (20)
Recently uploaded
Recently uploaded (20)
India's Declining Savings Rate & its Implications
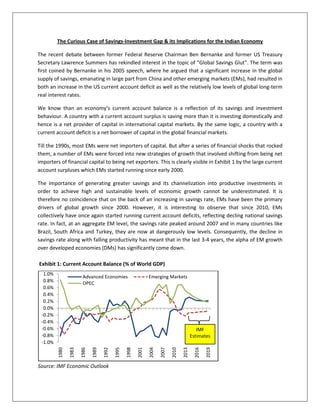
- 1. The Curious Case of Savings-Investment Gap & its Implications for the Indian Economy The recent debate between former Federal Reserve Chairman Ben Bernanke and former US Treasury Secretary Lawrence Summers has rekindled interest in the topic of “Global Savings Glut”. The term was first coined by Bernanke in his 2005 speech, where he argued that a significant increase in the global supply of savings, emanating in large part from China and other emerging markets (EMs), had resulted in both an increase in the US current account deficit as well as the relatively low levels of global long-term real interest rates. We know than an economy’s current account balance is a reflection of its savings and investment behaviour. A country with a current account surplus is saving more than it is investing domestically and hence is a net provider of capital in international capital markets. By the same logic, a country with a current account deficit is a net borrower of capital in the global financial markets. Till the 1990s, most EMs were net importers of capital. But after a series of financial shocks that rocked them, a number of EMs were forced into new strategies of growth that involved shifting from being net importers of financial capital to being net exporters. This is clearly visible in Exhibit 1 by the large current account surpluses which EMs started running since early 2000. The importance of generating greater savings and its channelization into productive investments in order to achieve high and sustainable levels of economic growth cannot be underestimated. It is therefore no coincidence that on the back of an increasing in savings rate, EMs have been the primary drivers of global growth since 2000. However, it is interesting to observe that since 2010, EMs collectively have once again started running current account deficits, reflecting decling national savings rate. In fact, at an aggregate EM level, the savings rate peaked around 2007 and in many countries like Brazil, South Africa and Turkey, they are now at dangerously low levels. Consequently, the decline in savings rate along with falling productivity has meant that in the last 3-4 years, the alpha of EM growth over developed economies (DMs) has significantly come down. -1.0% -0.8% -0.6% -0.4% -0.2% 0.0% 0.2% 0.4% 0.6% 0.8% 1.0% 1980 1983 1986 1989 1992 1995 1998 2001 2004 2007 2010 2013 2016 2019 Advanced Economies Emerging Markets OPEC IMF Estimates Source: IMF Economic Outlook Exhibit 1: Current Account Balance (% of World GDP)
- 2. Like most EMs, India too has witnessed a precipitous decline in its savings rate in recent years. Supported by favourable demographics, India’s domestic savings rate started rising from the late 1980s. It increased from an average of 18.6% (as a % of GDP) during 1980-1990 to 23% during 1990-2000. It picked up even further in the last decade, reaching a high of 36.8% in FY08. Consequently, India’s potential growth also accelerated sharply during this period. However, post the crisis, the savings rate started to show a declining trend, eventually falling to a 10-year low of 30.6% in FY14. Historically, Indian households have not only been the largest providers of capital (savings-investment gap positive) to the corporate and conolidated public sector (savings-investment gap negative), but their savings behaviour has also tended to exhibit remarkable stability. In other words, the cyclicality in the overall savings-investment gap of the economy and thus the current account has generally come from the corporate and public sector rather than households. It is perhaps because of this reason that these two sectors (the public sector in particular) have often been chided during periods of high current account deficits while the household sector has often escaped being censured. However, it is the households as an entity who deserve much of the criticism for the increased levels of external sector vulnerability in recent years. As Exhibit 2 shows, household savings-investment gap climbed up steadily from 9.9% in FY01 to a peak of 12.0% in FY10, but thereafter has experienced a free fall. In fact, it is currently reeling at levels last seen during the late 1980s. But this is hardly the complete picture. This is because the aggregate savings-investment gap in Exhibit 2 does not add upto the current account balance. This is due to the fact that the category “valuables” is not included in the gross capital formation of any of the three sectors (as it is difficult to locate the end user of the item) and is instead reported as a separate category. If we assume that households are the primary end users of “valuables” and adjust household gross capital formation accordingly, then the decline in the household savings- investment gap looks far more ominous (Exhibit 3). Household (1) Private Corporate Sector (2) Public Sector (3) Aggregate (1+2+3) 2000-01 9.9% -1.2% -8.5% 0.2% 2001-02 10.5% -1.9% -8.8% -0.1% 2002-03 10.0% -1.8% -6.7% 1.5% 2003-04 11.0% -2.0% -5.3% 3.7% 2004-05 10.1% -3.8% -5.1% 1.2% 2005-06 11.9% -6.1% -5.5% 0.3% 2006-07 11.3% -6.6% -4.7% -0.1% 2007-08 11.6% -7.9% -3.9% -0.1% 2008-09 10.1% -3.9% -8.5% -2.2% 2009-10 12.0% -3.8% -9.0% -0.8% 2010-11 9.9% -4.8% -5.8% -0.8% 2011-12 7.7% -3.6% -6.2% -2.2% 2012-13 7.3% -3.5% -5.5% -1.7% 2013-14 7.5% -1.7% -6.4% -0.6% Exhibit 2: Savings-Investment Gap across the Three Sectors (% of GDP) Source: CMIE database FY12-FY14 numbers based on new gdp series
- 3. Evidently, this aberration in household behavior has had some series implications for the macro economy: 1. When households purchase gold, it often comes at the cost of a financial asset and since gold is an imported commodity, there is a permanent leakage of a potential financial saving from the domestic economy. If instead of buying gold, the household exchanges its cash for a financial asset then a) financial resources remain within the economy and b) the asset forms a part of domestic savings and to that extent enhances domestic capital formation. Clearly, this substitution of financial savings towards gold as well as real estate by households in recent years has shaved off a few additional basis points from our potential growth. This is an important but a rather under-appreciated fact 2. Increased household investments have not only resulted in a reduction in capital availability to the private sector, but the economy’s capital productivity too has suffered (reflected in rising ICOR). This is because private sector investments tend to be far more productive and tend to have a much higher multiplier effect on the economy as compared to household sector. Though difficult to quantify precisely, the dent in productivity has further impacted potential growth 3. The reduced capital availability to the private sector has caused domestic liquidity conditions to remain extremely tight in the last few years, leading to over reliance on foreign savings, despite subdued levels of private investments. While this over dependence has come at a time when foreign liquidity has been in surplus mode, going forward, given the transient nature of this liquidity, the global environment may not continue to remain as supportive Households (1) Private Corporate Sector (2) Public Sector (3) Aggregate (1+2+3) Errors & Ommissions (4) Current Account Balance (1+2+3+4) 2000-01 9.2% -1.2% -8.5% -0.4% -0.1% -0.6% 2001-02 9.9% -1.9% -8.8% -0.7% 1.4% 0.7% 2002-03 9.5% -1.8% -6.7% 0.9% 0.3% 1.2% 2003-04 10.2% -2.0% -5.3% 2.9% -0.6% 2.3% 2004-05 8.8% -3.8% -5.1% 0.0% -0.3% -0.3% 2005-06 10.7% -6.1% -5.5% -0.8% -0.3% -1.2% 2006-07 10.1% -6.6% -4.7% -1.3% 0.3% -1.0% 2007-08 10.6% -7.9% -3.9% -1.2% -0.1% -1.3% 2008-09 8.9% -3.9% -8.5% -3.5% 1.2% -2.3% 2009-10 10.2% -3.8% -9.0% -2.6% -0.2% -2.8% 2010-11 7.8% -4.8% -5.8% -2.8% 0.1% -2.8% 2011-12 4.8% -3.6% -6.2% -5.0% 0.8% -4.2% 2012-13 4.6% -3.5% -5.5% -4.4% -0.4% -4.8% 2013-14 6.2% -1.7% -6.4% -1.9% 0.2% -1.7% Exhibit 3: Savings-Investment Gap across the Three Sectors Adjusted for Valuables (% of GDP) Source: CMIE database FY12-FY14 numbers based on new gdp series
- 4. While it is far easier to penalize the public or the private corporate sector for their profligacy, there is hardly any solid mechanism to regulate/alter household behavior. However, our view is that the damage to the output gap due to aberration in household behavior has been so large, that the recovery (which is already underway) is also likely to be much quicker. While we do not expect the headline household savings rate to improve much in the near term, we believe that the savings-investment gap will continue to show a marked improvement going forward. This is because while the headline savings rate is a function of income, the allocation of savings into financial and physical assets is a function of relative returns. Thus, with real income growth continuing to remain muted, the recovery in the headline savings is likely to be very gradual. On the other hand, with more and more money gravitating from gold and real estate and with inflation remaining constrained due to structural and cyclical reasons, households investments is likely to moderate significantly, leading to a large positive savings-investment gap. So what should be the way forward for policymakers? We believe that monetary authorities should be more aggressive in cutting interest rates because of two factors: 1. Even though headline savings is unlikely to meaningfully pick up soon, the slack creation process (rising savings-investment gap, falling credit-deposit ratio, falling inflation) is moving reasonably quickly. In other words, the balance sheets of all stakeholders are showing signs of improvement. Since potential growth is a direct function of strong balance sheets, it implies that a recovery in potential growth is also underway. However, balance sheet repair still has some way to go and this is unlikely to be possible without an accomodative monetary policy 2. Globally, the fear of deflation has led to an extraordinary monetary policy response in recent years by the world’s major central banks. In fact, six years post the crisis, central banks around the world (led by ECB and BoJ) continue to provide monetary support in some way or the other. While deflation has become the consensus trade, potential growth in all major economies continue to head lower, led by a collapse in labour and capital productivity. A fall in potential output means that the world economy, especially the US, is operating much closer to potential than most realize. This in turn implies that the need for unwinding of this ultra accomodative monetary policy is likely to arise sooner rather than later. India, therefore, only has a small window before global liquidity conditions turn unfavourable. Thus, In order to efficiently avail this window, it is imperative for policy makers, especially the monetary authorities to provide full support to the economy, so as to strengthen the domestic macroeconomic profile and thereby reduce dependence on foreign liquidity. To conclude, the Indian economy has undergone significant macro-rebalancing in the last 18 months. Domestically, a number of imbalances which had creeped up is now showing signs of reversal. The global environment also remains supportive, atleast as of now. In such an environment, the RBI has adopted inflation targeting as its priority number one. Considering that a) the drivers of inflation could be very different from rates/liquidity and b) balance sheets still need support and time to recover, the urgency of implementation of a CPI based inflation targeting regime may not have been apt. Though there is never a right time to swallow a bitter pill, the current environment warrants that growth gets the attention it deserves. Disclaimer: The author is Investment Strategist and Economist at Reliance Capital Asset Management. Views are personal.