Bcg article
•
2 likes•3,227 views

This Article address BCG matrix, case study Sanaa Airport, for traffic, and other operators

Recommended
More Related Content
Viewers also liked
Viewers also liked (20)
Similar to Bcg article
Similar to Bcg article (20)
More from Mohammed Hadi
More from Mohammed Hadi (20)
Recently uploaded
Recently uploaded (20)
Bcg article
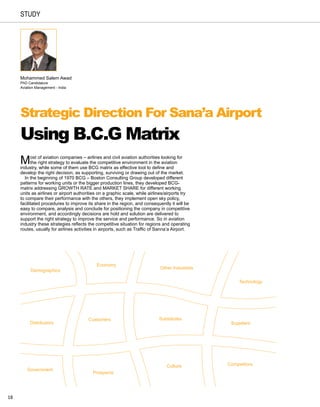
- 1. study Mohammed Salem Awad PhD Candidature Aviation Management - India Strategic Direction For Sana’a Airport Using B.C.G Matrix M ost of aviation companies – airlines and civil aviation authorities looking for the right strategy to evaluate the competitive environment in the aviation industry, while some of them use BCG matrix as effective tool to define and develop the right decision, as supporting, surviving or drawing out of the market. In the beginning of 1970 BCG – Boston Consulting Group developed different patterns for working units or the bigger production lines, they developed BCG- matrix addressing GROWTH RATE and MARKET SHARE for different working units as airlines or airport authorities on a graphic scale, while airlines/airports try to compare their performance with the others, they implement open sky policy, facilitated procedures to improve its share in the region, and consequently it will be easy to compare, analysis and conclude for positioning the company in competitive environment, and accordingly decisions are hold and solution are delivered to support the right strategy to improve the service and performance. So in aviation industry these strategies reflects the competitive situation for regions and operating routes, usually for airlines activities in airports, such as Traffic of Sanna’a Airport. Economy Other Industries Demographics Technology Customers Substitutes Distributors Suppliers Culture Competitors Government Prospects 18
- 2. study Introduction BCG Matrix BCG matrix is the most effective and well known As it is mentioned before, the out come of method and tool to manage and develop decision, passengers in terms of growth rates and market it is established based on a production theory. At share can be located in four mapping matrix to the beginning of seventies BC group developed and define the airport market situation which are: implement BCG matrix, this matrix can be used to 1- STARS: High status growth , Bigger Market Share find the priorities for doing a productivities of unit 2- CASH COW: Low status growth, work. Beside to ensure a long term performance, Bigger Market Share. company should secure all the productive units of 3- DOGS: Low status growth, Small Market Share. high growth rate for the needs of the money while it 4- QUESTION MARK: High status is also for low growth rate of productive units for the growth, Small Market Share. needs of cash flow. BCG matrix is defined by two parameters: GROWTH RATE and MARKET SHARE, SANA’A International Airports (Case Study) and its main concept is, if there is big market share According to the statistical annual reports (2004- or high growth rate, the market will develop fast. 2009) of Central Statistical Organization CSO for In Air transport and Airline industry, the ICAO, the traffic of Yemen airports, SAH, ADE, TAI, HOD, IATA, and others world countries have to liberate the RIY, and GXF as mentioned in the following table. skies and offer facilities to attract the traffic to their As shown in the table below the share countries and to their airports. Thus air transport percentage of domestic airports for 2009, SAH industry acts as a catalyst for other development airport share is 72% of the total traffic.8 sector like education, Tourism, and hotel investment. It is a part of business sequence business connected ring, mostly defined as package. Finally we have to define the main terms of BCG matrix. Market Share The number of passengers should not be necessary to reflect the company performance compared to Relative Market Share other companies for competitive airports. Actually (Cash Generation) the change in number of passengers reflects change of market size or in the economic factors of the region. So the airport performance can be High Low compared with competitors of neighborhood airports and can also be evaluated by market share, that airport gains, and it is defined as the market share High of that airport in the region, calculated as follows: Market Growth Rate Market Share = (No. of Pax in airport / Total No. of Pax in the region) (Cash Usage) Stars Question Marks Growth Rate This is the second important factor for the analysis, as it is a significant element based on historical data of the passengers and same measured as: Growth Rate for Recent Year = (No. of Pax of Recent Year - No. of Pax of Low Previous Year) / No. of Pax of Previous Year And can be represented by the Latin letter λ as constant growth factor, which can fairly be represented by Exponential distribution, so for positive value of λ Cash Cows Dogs it means growth market, while for negative value of λ means declining market of airport passengers. 19
- 3. study Analysis total (passengers) The analysis is done in to two directions. Airports sah ade tiz hod MUK gD First: Traffic of SAH Airport with 2004 1061 190 29 20 108 40 other Domestic Airports: By implementing BCG Matrix for 2005 1271 203 32 22 148 0 SAH Airport (as origin) for 2009, 2006 1404 204 33 24 127 28 with other domestic airports, the 2007 1570 225 29 24 129 46 results will be as follows: 2008 1734 247 38 28 143 50 1- Since the growth rate is negative factor 2009 1648 299 62 50 148 65 for SAH airport, so the other values of domestic airports reflects the CASH COW situation, as SAH airport captures the highest market share of Yemen traffic. So SAH Airport is the main stream to direct cash money, but there is no growth but recession in passengers. Accordingly the need for improving service, expansion is a must, i.e the plan of opening new Sanaa airport soon will BCG Matrix (Sana’a Airport Case Study) improve the growth rate and consequently Selecting the Right Strategy will derive SAH airport to STAR situation and as shown in the analysis, Yemenia Relative Market Share (Cash Generation) consider SAH airport as main Hub for High Low their operation without giving the same High opportunity for other domestic airports. Market Growth Rate (Cash Usage) Second: Airlines Competitive Stars Question Marks Analysis of SAH Airport For the Airlines competitive analysis Low Relative Growth Rate % of SAH airport, the airlines operating Cash Cows Dogs to SAH are RJ, ET, MS, QR, ET, SV and off course IY. Using BCG Matrix SAH Airport again, many tough situations have arisen, as the competition between MUK EK and IY for Yemen market and the results of Matrix analysis are: gDH ADE 1- STAR situation: In this situation, two routes are analyzed CAI, and ADD, showing IY is the leader. TIZ 2- CASH COW situation Three routes are addressed AMM, HOD JED, and RUH. These routes should be continued and keep them active Relative Market Share % in operation for their cash flow. 3- DOG Situation Yemenia should reconsider the BCG Matrix (Sana’a Airport Case Study) routes DOH, and DXB seriously, Selecting the Right Strategy as the main competitors are EK, and QR with a superior service. Relative Market Share (Cash Generation) 4- QUESTION MARK situation High Low Operation to BAH should be reviewed ET High Market Growth Rate and supported by IY. unless there is a GF (Cash Usage) need either to support or withdraw. Stars Question Marks Summary Relative Growth Rate % Low This study points out the use of BCG Cash Cows Dogs Matrix in taking the strategic decisions MS especially for the competitive markets, as IY it reflects the actual picture of company situation with the other competitors, RJ EK SV-JED then accordingly the policies and the right decision are taken based on the results of BCG matrix outcomes. It a QR powerful tool for top management to know the strengths and weakness points and discrepancies in the company, to SV-RUH take the right action on the right time, finally this method can be implemented on monthly, quarterly and annual bases according to the company requirements.■ Relative Market Share % 20
- 4. Civil Aviation & Meteorology Authority, October - December 2010, issue 9 AIR TERRORISM www.camamagazine.com