Santander Bank Annual Report 2011 Key figures 2011
•
1 like•742 views

Santander Bank Annual Report 2011 Key figures 2011

Recommended
Recommended
More Related Content
Viewers also liked
Viewers also liked (13)
More from BANCO SANTANDER
More from BANCO SANTANDER (20)
Recently uploaded
Recently uploaded (20)
Santander Bank Annual Report 2011 Key figures 2011
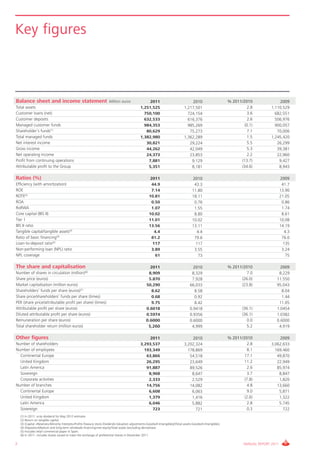
- 1. Key figures Balance sheet and income statement Million euros 2011 2010 % 2011/2010 2009 Total assets 1,251,525 1,217,501 2.8 1,110,529 Customer loans (net) 750,100 724,154 3.6 682,551 Customer deposits 632,533 616,376 2.6 506,976 Managed customer funds 984,353 985,269 (0.1) 900,057 Shareholder’s funds(1) 80,629 75,273 7.1 70,006 Total managed funds 1,382,980 1,362,289 1.5 1,245,420 Net interest income 30,821 29,224 5.5 26,299 Gross income 44,262 42,049 5.3 39,381 Net operating income 24,373 23.853 2.2 22,960 Profit from continuing operations 7,881 9,129 (13.7) 9,427 Attributable profit to the Group 5,351 8,181 (34.6) 8,943 Ratios (%) 2011 2010 2009 Efficiency (with amortization) 44.9 43.3 41.7 ROE 7.14 11.80 13.90 ROTE(2) 10.81 18.11 21.05 ROA 0.50 0.76 0.86 RoRWA 1.07 1.55 1.74 Core capital (BIS II) 10.02 8.80 8.61 Tier 1 11.01 10.02 10,08 BIS II ratio 13.56 13.11 14.19 Tangible capital/tangible assets(3) 4.4 4.4 4.3 Ratio of basic financing(4) 81.2 79.6 76.0 Loan-to-deposit ratio(5) 117 117 135 Non-performing loan (NPL) ratio 3.89 3.55 3.24 NPL coverage 61 73 75 The share and capitalisation 2011 2010 % 2011/2010 2009 Number of shares in circulation (million)(6) 8,909 8,329 7.0 8,229 Share price (euros) 5.870 7.928 (26.0) 11.550 Market capitalisation (million euros) 50,290 66,033 (23.8) 95,043 Shareholders’ funds per share (euros)(1) 8.62 8.58 8.04 Share price/shareholders’ funds per share (times) 0.68 0.92 1.44 PER (share price/attributable profit per share) (times) 9.75 8.42 11.05 Attributable profit per share (euros) 0.6018 0.9418 (36.1) 1.0454 Diluted attributable profit per share (euros) 0.5974 0.9356 (36.1) 1.0382 Remuneration per share (euros) 0.6000 0.6000 0.0 0.6000 Total shareholder return (million euros) 5,260 4,999 5.2 4,919 Other figures 2011 2010 % 2011/2010 2009 Number of shareholders 3,293,537 3,202,324 2.8 3,062,633 Number of employees 193,349 178,869 8.1 169,460 Continental Europe 63,866 54,518 17.1 49,870 United Kingdom 26,295 23,649 11.2 22,949 Latin America 91,887 89,526 2.6 85,974 Sovereign 8,968 8,647 3.7 8,847 Corporate activities 2,333 2,529 (7.8) 1,820 Number of branches 14,756 14,082 4.8 13,660 Continental Europe 6,608 6,063 9.0 5,871 United Kingdom 1,379 1,416 (2.6) 1,322 Latin America 6,046 5,882 2.8 5.745 Sovereign 723 721 0.3 722 (1) In 2011, scrip dividend for May 2012 estimate. (2) Return on tangible capital. (3) (Capital +Reserves+Minority Interests+Profits-Treasury stock-Dividends-Valuation adjustments-Goodwill-Intangibles)/(Total assets-Goodwill-Intangibles). (4) (Deposits+Medium and long-term wholesale financing+net equity/Total assets (excluding derivatives). (5) Includes retail commercial paper in Spain. (6) In 2011, includes shares issued to meet the exchange of preferential shares in December 2011. 2 ANNUAL REPORT 2011
- 2. Santander posted an attributable profit of EUR 5,351 million in 2011 and assigned EUR 3,183 million to provisions, while strengthening its solvency and maintaining shareholder remuneration at EUR 0.60 per share for the third year running. Gross income Net operating income Million euros Million euros + 5.3% 2011/2010 + 2.2% 2011/2010 24,373 44,262 23,853 42,049 22,960 39,381 2009 2010 2011 2009 2010 2011 Attributable profit Total dividend payout Million euros Million euros – 34.6% 2011/2010 + 5.2% 2011/2010 5,260 8,943 8,181 4,999 4,919 5,351 2009 2010 2011 2009 2010 2011 Efficiency Core capital % BIS II criteria. % + 1.6 p.p. 2011/2010 + 1.22 p.p. DEC 2011/DEC 2010 10.02 44.9 43.3 41.7 8.80 8.61 2009 2010 2011 DEC 09 DEC 10 DEC 11 ANNUAL REPORT 2011 3