Gestión de aguas y lodos municipales- Adry Salome
•
0 likes•263 views

Adry Salom, Magister en Ingeniería Civil en Delft University, fue convocado por CTAgua para dictar un seminario sobre la gestión de aguas y lodos municipales. Está es la presentación mediante la que compartió la experiencia holandesa.

Recommended
Recommended
More Related Content
Similar to Gestión de aguas y lodos municipales- Adry Salome
Similar to Gestión de aguas y lodos municipales- Adry Salome (20)
Recently uploaded
Recently uploaded (20)
Gestión de aguas y lodos municipales- Adry Salome
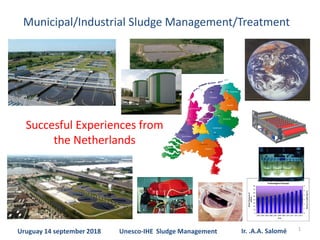
- 1. 1 Municipal/Industrial Sludge Management/Treatment Succesful Experiences from the Netherlands Uruguay 14 september 2018 Ir. .A.A. SaloméUnesco-IHE Sludge Management
- 2. Topics 1. History of Durch Water Management 2. Facts of the Dutch Waterboards 3. Regulations & Finances 4. Wastewater and Sludge Treatment 5. Management & Finances at HHSK 6. Energy & Recovery 7. Future developments Uruguay 14 september 2018 2Unesco-IHE - Sludge Management
- 3. Uruguay 14 september 2018 3 Uruguay: Netherlands: 4,2 x 176.215 km2 41.550 km2 (1,5 % water) (18 % water) 0,2 x 3.370.000 inhabitants 17.000.000 inhabitants Unesco-IHE - Sludge Management
- 4. Argentina 17 - 20 september 2018 4 History of Dutch Water Management Unesco-IHE - Dutch Water Management Water Management = Safe Living No Water Management = 60% flooded Ir. .A.A. Salomé
- 5. Argentina 17 - 20 september 2018 5 History of Dutch Water Management Unesco-IHE - Dutch Water Management 11th century: first organisation 12th - 15th century: growth water boards 15th century: floods and reorganisation 16th century: new generation 19th century: 3.500 water boards 20th century: 2.000 water boards 1969: 1.000 water boards 1995: 88 water boards 2009: 26 water boards 2013: 24 water boards 2018: 22 water boards Ir. .A.A. Salomé
- 6. Argentina 17 - 20 september 2018 6 Organisation of Dutch Water Management Unesco-IHE - Dutch Water Management The unavoidable Water and Sludge Chain Drinking Water Production Drinking Water Consumption Wastewater Production Wastewater Treatment Sludge Production Sludge Treatment Ir. .A.A. Salomé
- 7. Argentina 17 - 20 september 2018 7 Organization of Drinking water supply and Sanitation in the Netherlands Unesco-IHE - Dutch Water Management Ministry of Agriculture Ministry of Public Works Ministry of Environment 12 Provincial Governments 10 Water Supply Companies (drinking water supply) 22 Water Boards (water security, wastewater treatment) 388 Municipalities (wastewater collection) Direct Public management Public Water PLC 1 32 Ir. .A.A. Salomé
- 8. Argentina 17 - 20 september 2018 8 Facts of the Dutch Waterboards Unesco-IHE - Dutch Water Management Ir. .A.A. Salomé Calculation Example (average 2018) Family with 2 children (total of 4 persons): • Pollution Taks € 145,-- • Water System Tax Residence € 41,-- • Water System Levy Building € 53,-- Total waterboard € 239,-- Drinking Water (120 liter/per person per day) € 236,-- Sewage Tax (Municipality) € 343,-- Total costs € 800,-- / year ARS 28.560,-- per year
- 9. Facts of the Dutch Waterboards Uruguay 14 september 2018 9 Sewerage > 97% Wastewater treatment > 99% Unesco-IHE - Sludge Management
- 10. Uruguay 14 september 2018 10 Number of Waterboards (2018): 22 Number of employees: 11.000 Taks revenues: € 2,6 billion/year = UYU 96,2 billion/year Number of treatment plants: 333 Treatment capacity: 2.000.000.000 m3/year Facts of the Dutch Waterboards Unesco-IHE - Sludge Management
- 11. Uruguay 14 september 2018 11 Facts of the Dutch Waterboards Investment costs/year 2009: € 330.000.000 (UYU 12.200.000.000) 2015: € 240.000.000 (UYU 8.880.000.000) Taks revenues € 2,6 billion/year UYU 96,2 billion/year Means € 153 per person per year UYU 5.659 per person per year Unesco-IHE - Sludge Management
- 12. Uruguay 14 september 2018 12 Environmental standards • 1970: Regulation of Oxygen Demand: Pollution of Surface Water Act: WVO 1970 • 1980’s: Regulation of N and P. Eutrofication of surface and groundwaters: - European Council Directive on Nutrients - Northsea Action Plan • 1990’s: Regulation on ecological function of water bodies. European Water Framework Directive of 2001 Regional efficiency per water board: • 75% Nitrogen removal • 75% Phosphate removal Specific effluent requirements: • N = 10 mg/l • P = 1 mg/l (2 mg/l) • Future: • N = 2,2 mg/l • P = 0,15 mg/l • medicine and hormone residues, micro pollutants, pesticides and heavy metals Facts of the Dutch Waterboards Unesco-IHE - Sludge Management
- 13. Facts of the Dutch Water & Sludge Treatment Uruguay 14 september 2018 13Unesco-IHE - Sludge Management 40.000.000 p.e. Capacity Wastewater Treatment Plants Municipal Wastewater Treatment Plants Industrial Wastewater Treatment Plants
- 14. Facts of the Dutch Water & Sludge Treatment Uruguay 14 september 2018 14Unesco-IHE - Sludge Management Nitrogen Phosphate Capacity and Nutrient Removal Wastewater Treatment Plants Total capacity Phosphate removal capacity Nitrogen removal capacity
- 15. Facts of the Dutch Water & sludge treatment Uruguay 14 september 2018 15 Nutrient removal • Nitrogen: 1995 11 % 2016 84 % • Phosphate: 1995 10 % 2016 85 % 80 % (biological) Sludge treatment incineration cement industry powerplants (electricity) agriculture disposal Unesco-IHE - Sludge Management
- 16. Facts of the Dutch Water & sludge treatment Uruguay 14 september 2018 16Unesco-IHE - Sludge Management Disposal/destination Sludge from Wastewater Treatment Plants Other Power/plants (electricity) Cement industry Incineration Landfill Compsting (fertilizer) Wet Oxidatrion Agriculture
- 17. Facts of the Dutch Water & sludge treatment Uruguay 14 september 2018 17 Sludge production domestic wastewater treatment 325 million kg ds/year Sludge production industrial wastewater treatment 210 million kg ds/year Total Sludge Production: 535 million kg ds/year Unesco-IHE - Sludge Management Disposal routes: • Ocean? • Spreading on soil? • Landfill? • Lagoons? • Agriculture? • . . . . . . . . . .?
- 18. Sludge amounts without treatment Uruguay 14 september 2018 18Unesco-IHE - Sludge Management Average Domestic Sludge production on a WWTP: • 60-70 g ds per person per day • 6 liter sludge per person per day • 2.500 Liter sludge per person per year • 3.5 million people 8.000.000 m3/year !!! 270.000 x - - -
- 19. Treatment at Wastewater Department Schieland en de Krimpenerwaard (HHSK)
- 20. Treatment at Wastewater Department Schieland en de Krimpenerwaard (HHSK)
- 21. Treatment at Wastewater Department Schieland en de Krimpenerwaard (HHSK)
- 22. Treatment at Wastewater Department Schieland en de Krimpenerwaard (HHSK)
- 23. Treatment at Wastewater Department Schieland en de Krimpenerwaard (HHSK)
- 24. Treatment at Wastewater Department Schieland en de Krimpenerwaard (HHSK)
- 25. Treatment cost at Wastewater Department Schieland en de Krimpenerwaard (HHSK) Uruguay 14 september 2018 25Unesco-IHE - Sludge Management Cost: € 34.000.000/year (UYU 1.260.000.000) 1. Treatment by other Water Boards 2. Capitial costs 3. Exploitation costs: - management, operation, control, - maintanance, research, administration Division: • external treatment: € 11.000.000/year • Transportation € 5.000.000/year • wastewater treatment € 13.000.000/year • Sludgetreatment € 5.000.000/year 32 % 15 % 38 % 15 % - - - 22 % 56 % 22 %
- 26. Management and organisation HHSK Uruguay 14 september 2018 26Unesco-IHE - Sludge Management Characteristics: • Centralized WWT in dense areas • Local WWTP’s in rural areas • Centralized Sludge Treatment • Local thickening • Anaerobic Sludge Digestion • Centralized Dewatering Organisation: from task to process driven (strategy-processes- PDCA) Continues operation: 24 hours/day, 365 days/year! • operation • maintanance - - -
- 27. Management and organisation HHSK Uruguay 14 september 2018 27Unesco-IHE - Sludge Management 50 employees • Technical specialists: o Proces control/automization o mechanical o electrical o civil/construction • Technology specialists: o proces technology o information- and data management o licenses and sampling/analyses - - - Structural Organised Interaction
- 28. Sludge treatment at HHSK Uruguay 14 september 2018 28Unesco-IHE - Sludge Management Operation & Maintanance • Procescontrol • Automatic (distance) control • Sampling and analyses • Inspections • Service group (outside working hours)
- 29. Sludge treatment at HHSK Uruguay 14 september 2018 29Unesco-IHE - Sludge Management - - - 23 Wastewater Pumping Stations 79 km pressure mains (transportion pipes wastewater) 9 Wastewater Treatment Plants (610.000 p.e.) Cetralized sludge treatment for 9 wwtp’s • thickening, anaerobic digestion, mechanical dewatering Biogasproduction (2.100.000 m3/year) • Electricity production (4.000.000 kWh/year)
- 30. Energy facts at HHSK Uruguay 14 september 2018 30Unesco-IHE - Sludge Management Sludge treatment • disposal = 34.000 ton/year at 25% d.s. Energy consumption: • HHSK total: 29.000.000 kWh/y • WWTP’s: 21.000.000 kWh/y (€ 2.500.000/y) • E-Production: 4.000.000 kWh/y (saves € 500.000/y) UYU 92 million/y UYU 19 million/y - - -
- 31. Ranking HHSK Droge voeten en schoon water 31 Monitor report 2016 Energy consumption: Wastewater treatment: 72% Water systems: 24% Water protection: 4% Disitribution of business units in total energy consumption (2016) 24% 4% Wastewater treatment Water systems Water safety 72%
- 32. Future developments sludge management • Decrease of landfill options • Decrease of agricultural purposes • Decreaes of soil improvement • Increase of incineration techniques • Reduction of volume • Energy savings • Energy recovery • From waste product to valuable material • Upgrade of biogas to high multi purpose quality • Reuse of ashes Uruguay 14 september 2018 32Unesco-IHE - Sludge Management
- 33. Legal Note Durability, established 2017 Droge voeten en schoon water 33 Energy Yearly 2% energy savings In 2020 min. 40% sustainable energy production In 2025 100% sustainable energy production = energy neutral Climate Yearly 1% less emission of Carbon dioxide (CO2) [ In 2020 30% less CO2 emission related to 1990 ] In 2050 (netto) zero emission of greenhouse gases (+ energy neutral) Raw materials In 2020 10% of tenders “circular economy” [re-use of raw materials and/or no waste products] In 2030 50% “circular economy” In 2050 full “circular economy” Sharing/exchanging knowledge = multiplying knowledge
- 34. Ranking HHSK Droge voeten en schoon water 34 Monitor report 2016 Sustainable energy production in 2016 for Waterboard Hoogheemraadschap van Schieland en de Krimpenerwaard (HHSK) Total sustainable energy production in 2016 for all Dutch Waterboards 50 % 33 %
- 35. Droge voeten en schoon water 35 Extra energy production and energy savings up to 2017 • Centralisation sludge treatment: increase biogas + 40 % • Replacing surface aeration by bubble aeration: decreasing energy use - 15% • Facilitation windturbine on wwtp Kralingseveer • Formal participation in HVC (part ownership) for sludge treatment Initiatives and successes
- 36. Droge voeten en schoon water | 36 2016 in ratio of 2011: -/- 20% 16,000,000 17,000,000 18,000,000 19,000,000 20,000,000 21,000,000 22,000,000 2011 2013 2015 2016 Totaal Elektriciteitsverbruik HHSK (kWh) Decrease energy consumption HHSK Total energy consumption HHSK (kWH)
- 37. Droge voeten en schoon water 37 Energie Efficiency Plan MJA-3 • Themista; innovative proces sludge • Replacing aeration systems at 2 wwtp’s • Measurements on RWF (Rain Weather Flow) to wwtp’s • Smart pumping (at DWF (Dry Weather Flow), weather forecast, low price) Initiatives up to 2020
- 38. Droge voeten en schoon water | 38 Consumption and production in 2020 Consuption Production
- 39. Thermista at a wwtp Thermista: from innovation to full scale WWTP Primary clarifier Aeration tank Final clarifier Primary sludge Secondairy sludge External sludge Digester CH4 Sludge to incineration Dewatering Bypass Proces ControlOther wwtp’s Upgrading biogas to electricity or fuel gas
- 40. Secondairy sludgeExternal sludge Primairy sludge Digester Sludge Feed bij Smart Proces Control Bypass Thermista: from innovation to full scale
- 41. Droge voeten en schoon water 41 • Increasing digester capacity (max, load + 20%) • Possibilities treatment of extra external sludge • Increased biogas production (+ 17%) • Extra electriciy production (+1.2 mln kWh per year) • Lowering CO2 footprint (- 700 ton per year) • Better dewaterability of sludge (+1%) • Decrerase of sludge disposal of 4000 ton per year (- 13%) • Lower viscosity sludge resuts in better mixing • Better mixing results in increasing gas production Effects & Contributions Environmental Goals Thermista: from innovation to full scale
- 42. Argentina 17 - 20 september 2018 42 The Future in Wastewater Treatment Unesco-IHE - Dutch Water Management Examples of all Dutch Waterboards Energy and Raw Material Production on Sewage treatment Plants 1. Recovery of valuable materials from sewage 2. Increasing Energy Production to high valuable levels using bio-gas 3. Recovery of Phosphate: in Struvite = MagnesiumAmmoniumPhosphate 4. Recovery of Cellulose (remains from toiletpapaper at wwtp’s) for e.g. isolation material, use in asphalt (roads in Friesland), bio-composite, bio-plastics e.g. CirTec-Proces 5. Recovery of PHA: basic material for bio-plastics 6. Recovery of NEO-Alginate (bio-glue material): from Nereda-treatment proces for use in textile, building- and paper/pulp undustry 7. LCA = Life Cycle Analyses 8. WWTP’s with (centralised) Digesting Proces Ir. .A.A. Salomé Examples of future technologies and re-use
- 43. Argentina 17 - 20 september 2018 43 The Future in Wastewater Treatment Unesco-IHE - Dutch Water Management Examples of (near) future technologies and re-use Example Rotterdam (European Union Project) 1. Start: 2018 2. Costs: € 14,5 milion 3. Making bio-diesel from Sludge Sewage breakdown under additonal pressure) 4. Treatment Plant 5. Technology: pyrolyse (thermical) 6. Cooperation of EU (Horizon 2020) 7. Waterboard Delfland 8. Prvate Company Sludge Handling and Treatment Ir. .A.A. Salomé
- 44. Droge voeten en schoon water | 44 Recovery of Phosphate • Recovery of phosphate from fly ash • Cooperation of 10 waterboards • 50.000 ton fly ash per year • Covering 50% phosphate use in the Netherlands • 21.000 ton phosphate per imported by fertilizers • 11.000 – 12.000 ton phosphate per year (fixated in sludge from wwtp’s) • Recovery of other materials: metals, cast, etc. Recovery of raw materials
- 45. Argentina 17 - 20 september 2018 45 The Future in Wastewater Treatment Unesco-IHE - Dutch Water Management Examples wwtp’s Land van Cuijck, Apeldoorn, Amersfoort, Amsterdam Recovery of Phosphate: in Struvite = MagnesiumAmmoniumPhosphate 1. Production of fertilizer Ir. .A.A. Salomé Sustainable Technologies Recovery of Struvite Clogging of pipes Equilibrium Phosphate Examples of future technologies and re-use
- 46. Argentina 17 - 20 september 2018 46 The Future in Wastewater Treatment Unesco-IHE - Dutch Water Management Ir. .A.A. Salomé Dewatering Dewatering Rejection Water treatment Struvite Recovery Struvite Recovery Water line treatment Water line treatment Buffer Capacity (mol HCO3 -/mol NH4 +-N NH4 +-Nremoval(%) 1 2 Examples of future technologies and re-use
- 47. Argentina 17 - 20 september 2018 47 The Future in Wastewater Treatment Unesco-IHE - Dutch Water Management Example wwtp Bath (Waterboard Brabantse Delta) Recovery of PHA from sewage sludge 1. basic material for bio-plastics 2. high quality PHA-plastic 3. 100% bio-degradable 4. Pilot 4 Waterboards: Brabantse Delta, De Dommel, Scheldestromen and Fryslân 5. Succesful Test Products 6. Business Feasability Plan (market, economics) + 7. Investors and commercial businesses 8. Next phase: production up to 100.000 kg/week Ir. .A.A. Salomé Sustainable Technologies Examples of future technologies and re-use
- 48. Argentina 17 - 20 september 2018 48 The Future in Wastewater Treatment Unesco-IHE - Dutch Water Management Example wwtp Tollebeek EPHYRA Technology Proces 1. Innovative Digesting Technology 2. Multi Stage Technology 3. Separation of hydraulic and sludge retention time 4. Plug flow 5. Higher concentration; smaller reactors 6. Full scale 7. Since 2017 8. 20 – 30 % increase of decomposition/degradability (into bio-gas!) 9. Decrease of remaining solids (lower discharge costs) 10. Improved dewatering 11. Waterboard Zuiderzeeland 12. Consultant RHDHV Ir. .A.A. Salomé Examples of future technologies and re-use
- 49. Waste Water Department of Hoogheemraadschap van Schieland en de Krimpenerwaard THE END Presentation Uruguay 14 september 2018 Adry A. Salomé Director Waste Water Department Droge voeten en schoon water