Matteo Prato - Talking Continents 09/07/2010
•
0 likes•459 views

Intervento di Matteo Prato al workshop "Talking Continents" tenutosi a CastelBrando (TV) il 9 luglio 2010

Recommended
More Related Content
More from CastelBrando
More from CastelBrando (18)
Recently uploaded
Recently uploaded (20)
Matteo Prato - Talking Continents 09/07/2010
- 1. 1
- 2. Latest Arrival Figures – April 2010 • Arrival figures for YE April 2010 show Italian visitors are down by 6 per cent compared to the same period in 2009, whilst total European arrivals (incl. Russia) are up by 1 per cent. • For the four months to April 2010, Italian arrivals were up 4 per cent whilst overall European arrivals were up 1 per cent for the same period. Source: Australian Bureau of Statistics, Overseas Arrivals and Departures 2
- 3. Italian Holiday Market for Australia • Australia’s seventh most important international holiday market in terms of average spend per person. – On average, Italian holiday visitors spend AUD$6,308 on their trip to Australia. The average spend of all inbound holiday visitors to Australia is AUD$3,853. • Australia’s eleventh most important international holiday market in terms of average duration of stay. – On average, Italian visitors spend 41 nights in Australia, well over the total average of 26 nights for all inbound holiday visitors to Australia. • Australia’s sixteenth most important holiday international market in terms of visitor numbers. – There were 30,048 Italian holiday visitors to Australia in the year ended March 2010. • Australia’s twenty-first most important international leisure market in terms of dispersal. – 43% of Italian visitor holiday nights are spent outside Sydney/ Brisbane/ Melbourne/ Perth. This is the same as the average for all inbound holiday visitors to Australia (43%). • 23% of Italian holiday visitors are repeat visitors to Australia, below the total inbound repeat rate of 50%. N.B: All above figures relate to the period year ended March 2010. Source: Tourism Research Australia, International Visitors Survey 3
- 4. Italian Arrivals by age • The 15-29 year old segment is the biggest age segment of the Italian market, representing 25% of total arrivals from the market in year ended March 2010. • All age segments in the Italian market experienced declines in the year ended March 2010. The age segments that experienced the smallest declines were the 40-49 year olds and the 30-39 year olds (down 3% and 5% respectively). Source: International Visitor Survey 4 Base: Visitors 15 and over
- 5. Visitors to Australia by purpose of visit • The leisure segment (Holiday + VFR) is the biggest segment of the Italian market, representing a combined total of 61% of Italian arrivals in year ended March 2010. • The VFR (Visiting Friends and Relatives) segment as well as the Education segment are the only two segments to have grown for the year ended March 2010 relative to March 2009 (up by 17% and 24% respectively). Source: International Visitor Survey 5 Base: Visitors 15 and over
- 6. Italian Visits by Australian State • New South Wales, Queensland and Victoria are the 3 most visited Australian states for the Italian market. • Tasmania saw the biggest increases in Italian visitors (up by 169%) for the year ended March 2010 relative to March 2009, although from a very small base. Victoria, the Northern Territory and Canberra also had minor increases. 6
- 7. Working Holiday Maker Visas • In the European markets, the Working Holiday Maker programme has gained in popularity and application grants have increased across most markets. • In Italy, 5,137 WHM visas were granted between July 2009 and May 2010, representing an 18% increase on the same period of the previous year. There was a total of 4,635 WHM visas issued in the 2008/09 year for Italy. Source: Department of Immigration and Citizenship 7
- 8. Forecast of Italian Visitors to Australia Total Visitors Average Total nights TIEV total TIEV per % change ('000) nights (million) ($ million) visitor ($) 2007 54 3.7 37.8 2.0 $307m $5,730 2008 59 9.5 43.0 2.5 $382m $6,504 2009 (F) 54 -8.5 44.4 2.4 $361m $6,722 2010 (F) 61 5.1 41.8 2.5 $393m $6,440 Source: Tourism Forecast Report, Tourism Forecasting Committee December 2009 8
- 9. Cities
- 10. L’outback
- 11. Nature - Kangaroo Island
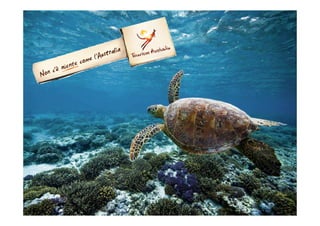
- 12. Grande Barriera Corallina - Queensland Grande Barriera Corallina
- 13. Hear Reef - Queensland
- 14. Whiteheaven beach - Queensland
- 15. Twelve Apostles - Victoria
- 16. Uluru - Northern Territory Sydney Opera House & Harbour Bridge, New South Wales
- 17. Cultura aborigena Incontri ravvicinati
- 18. Flinders Ranges - South Australia
- 19. Kangaroo Island - South Australia
- 20. Kakadu National Park - Northern Territory