Equity report_U-Ming Marine Transport Co.
•
1 like•1,542 views

Target Company: U-Ming Marine Transport Co.(裕民航運) Industry: Shipping industry Author: Meng-Chen, Tsai (蔡孟辰) - Copyright ownership belongs to Collaborator, shall not be reproduced, copied, or used in any other ways without permission. Otherwise Collaborator will have the right to pursue legal responsibilities. This report is produced for non-profit research within Collaborator internal and graduate alumni.

Recommended
Recommended
More Related Content
What's hot
What's hot (20)
Viewers also liked
Similar to Equity report_U-Ming Marine Transport Co.
Similar to Equity report_U-Ming Marine Transport Co. (20)
More from Collaborator
More from Collaborator (20)
Recently uploaded
Recently uploaded (20)
Equity report_U-Ming Marine Transport Co.
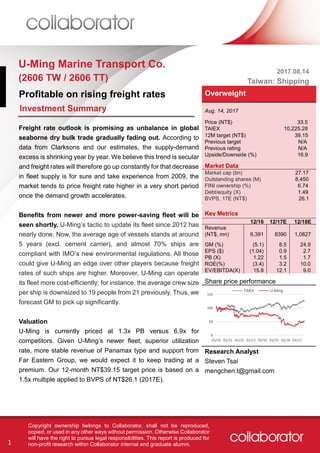
- 1. 1 Copyright ownership belongs to Collaborator, shall not be reproduced, copied, or used in any other ways without permission. Otherwise Collaborator will have the right to pursue legal responsibilities. This report is produced for non-profit research within Collaborator internal and graduate alumni. U-Ming Marine Transport Co. (2606 TW / 2606 TT) Profitable on rising freight rates Freight rate outlook is promising as unbalance in global seaborne dry bulk trade gradually fading out. According to data from Clarksons and our estimates, the supply-demand excess is shrinking year by year. We believe this trend is secular and freight rates will therefore go up constantly for that decrease in fleet supply is for sure and take experience from 2009, the market tends to price freight rate higher in a very short period once the demand growth accelerates. Benefits from newer and more power-saving fleet will be seen shortly. U-Ming’s tactic to update its fleet since 2012 has nearly done. Now, the average age of vessels stands at around 5 years (excl. cement carrier), and almost 70% ships are compliant with IMO’s new environmental regulations. All those could give U-Ming an edge over other players because freight rates of such ships are higher. Moreover, U-Ming can operate its fleet more cost-efficiently; for instance, the average crew size per ship is downsized to 19 people from 21 previously. Thus, we forecast GM to pick up significantly. Valuation U-Ming is currently priced at 1.3x PB versus 6.9x for competitors. Given U-Ming’s newer fleet, superior utilization rate, more stable revenue of Panamax type and support from Far Eastern Group, we would expect it to keep trading at a premium. Our 12-month NT$39.15 target price is based on a 1.5x multiple applied to BVPS of NT$26.1 (2017E). 2017.08.14 Taiwan: Shipping Overweight Aug. 14, 2017 Price (NT$) 33.5 TAIEX 10,225.28 12M target (NT$) 39.15 Previous target N/A Previous rating N/A Upside/Downside (%) 16.9 Market Data Market cap (bn) Outstanding shares (M) FINI ownership (%) Debt/equity (X) BVPS, 17E (NT$) 27.17 8,450 6.74 1.49 26.1 Key Metrics 12/16 12/17E 12/18E Revenue (NT$, mn) GM (%) EPS ($) PB (X) ROE(%) EV/EBITDA(X) 6,391 (5.1) (1.04) 1.22 (3.4) 15.8 8390 8.5 0.9 1.5 3.2 12.1 1,0827 24.9 2.7 1.7 10.0 9.0 Share price performance Research Analyst Steven Tsai mengchen.t@gmail.com 0 50 100 150 01/10 01/11 01/12 01/13 01/14 01/15 01/16 01/17 TAIEX U-Ming Investment Summary
- 2. 2 Copyright ownership belongs to Collaborator, shall not be reproduced, copied, or used in any other ways without permission. Otherwise Collaborator will have the right to pursue legal responsibilities. This report is produced for non-profit research within Collaborator internal and graduate alumni. Company Description U-Ming Marine Transport Co., formerly known as Yue Ming Transportation Co., is a subsidiary of Far Eastern Group. U- Ming commenced operations in 1968 as a land transportation firm; then being reorganized to a marine transportation company in 1984 to meet the need of cement transportation from Asia Cement Corp, also a subsidiary of Far Eastern Group. U-Ming focuses on dry bulk and oil shipping businesses. Based in Taiwan, U-Ming’s fleet is the most comprehensive among local competitors. U-Ming operates ships mainly under its wholly owned subsidiary - U-Ming Marine Transport (Singapore) Pte. Ltd. (29 out of 43 vessels). Besides, U-Ming set up 4 main investment firms, which contribute roughly ~2% of consolidated revenue. Exhibit 1: U-Ming Company Structure Source: Company data, Collaborator Research Since 2012, U-Ming has been actively updating its fleet, making shares of capesize, oil tanker, and panama larger, while gradually phasing out cement carrier. Currently, after acquiring 2/3 new Capesize/Ultramax ships in. 2017, U-Ming operates 43 vessels as of Aug. 4, with the average age around only 5 years old (excl. cement carrier). Besides, the share of fuel-saving ship now stands at nearly 70% in terms of capacity. U-Ming Marine Transport Co. U-Ming Marine Transport (Hong Kong) Ltd. U-Ming Marine Transport (Singapore) Pte. Ltd Yue-Li Investment Corp. Yue-Tung Investment Corp. Marine Transportation Overseas Shipping Pte. Ltd. (OSPL) Alliance Maritime Pte. Ltd. U-Ming (Xiamen) International Ship Mgmt. Co., Ltd. 100%100% 68% 74% 100% 100% 32% 26% Marine Transportation Marine Transportation Marine Transportation Marine Transportation Falcon Investment Private Limited (Falcon) Eagle Investment Private Limited (Eagle) 100% 100% Marine Transportation Investment Marine Transportation Investment Vessel Service Global Energy Maritime Co., Ltd. Marine Transportation 40%
- 3. 3 Copyright ownership belongs to Collaborator, shall not be reproduced, copied, or used in any other ways without permission. Otherwise Collaborator will have the right to pursue legal responsibilities. This report is produced for non-profit research within Collaborator internal and graduate alumni. Industry Overview & Trend Exhibit 4: Baltic Exchange Indices Since the financial crisis, the shipping industry has been trapped in oversupply. Too many vessels have been built while global trade has slowed down. Baltic Dry Index (BDI) did not bottom out until the end of 2016. Currently, the supply of dry bulk shipping industry has significantly diminished over the past few years. The order book in dwt as the percentage of service in dwt now sits at around 11.21%, with most of them expecting to be delivered in first halves of 2017/18. In addition, capacity growth of different sizes of bulker differ; only VLCC and Panamax are estimated to grow while rest of them fall by 2019. Afterwards, all of them will fall due to ship-wrecking activities and lack of newbuilding orders. Note that new environmental regulations rolled out by IMO may boost demolition activities before 2022. On the demand side, based on data from Clarksons Research (Table 1), about 33%, 25% and 8% of the world dry bulk seaborne trade are iron ore, coals(coking coal & thermal coal) and steel related product respectively; Source: CEIC, Lloyds list Exhibit 2: Fleet Capacity by Ship Type Unit: dwt Exhibit 3: Numbers of each Ship Type Source: Company data, Collaborator Research Source: Company data, Collaborator Research - 1,000,000 2,000,000 3,000,000 4,000,000 5,000,000 6,000,000 As of Aug. 4 2017E 2018E 2019E Capesize Panamax Supramax Cement Carrier Oil Tanker 16 12 6 4 5 Capesize Panamax Supramax Cement Carrier Oil Tanker 0 500 1,000 1,500 2,000 2,500 01/15 07/15 01/16 07/16 01/17 07/17 BHSI BSI BPI BCI BDI
- 4. 4 Copyright ownership belongs to Collaborator, shall not be reproduced, copied, or used in any other ways without permission. Otherwise Collaborator will have the right to pursue legal responsibilities. This report is produced for non-profit research within Collaborator internal and graduate alumni. if we look deeper into the numbers, we could find that China almost dominates trades of commodities such as iron ore and steel by having the largest share in global trade. Thus, we would take China’s import of iron ore as the proxy for the demand of dry bulk shipping. From the chart of china fixed asset & infrastructure investment (Exhibit 6), we can easily notice that freight rates of iron ore (Capesize) are driven by FAI in China, particularly by infrastructure investment. According to 2017 Economic Blue Book published by Chinese Academy of Social Sciences (CASS), the total fixed asset investment in China in 2017 is estimated to be over 67 trillion yuan, 8.9% growth in nominal term or 8.7% growth in real term, and infrastructure investment is expected to be around 20 trillion RMB or 20% YoY in 2017. Take data from C.P., Clarksons, and IMF into consideration (Exhibit 7). We think freight rates of dry bulk shipping will rise secularly as FAI in private sector appears to be on the rise and possibility that Chinese government will maintain infrastructure spending while in the same period, the supply- demand excess gradually become smaller and smaller. Table 1: Top Importer & Exporter of Major Dry Bulk Source: The Observatory of Economic Complexity (OEC), UN COMTRADE, International Trade Administration of U.S. Exhibit 5: Bulk Carrier Capacity Unit: mn dwt Exhibit 6: China FAI vs. Iron Ore Freight Rate Source: Reuters Eikon Source: NBS, Baltic Exchange Iron Ore Coal Steel Top Country % Country % Country % Importer China 61 India 52 U.S. 19 Japan 10 Malaysia 5.8 Germany 7 Exporter Australia 54 Indonesia 40 China 24 Brazil 22 Australia 26 Japan 9 -1% 0% 1% 2% 3% 4% 5% 6% 0 100 200 300 400 500 600 700 800 900 13 14 15 16 17E 18E 19E 20E Mini Bulk Handysize Handymax / Supramax Panamax Capesize Large Capesize VLOC 0 10 20 30 40 0% 10% 20% 30% 40% 02/13 11/13 08/14 05/15 02/16 11/16 08/17 FAI (Accu. YoY) FAI by state ( Accu. YoY) FAI by private sector (Accu. YoY) Infrast. Inv. (Accu. YoY) Brazil Tubarao-Qingdao(RHS) Aussie Dampier-Qingdao(RHS) Unit: USD/mt
- 5. 5 Copyright ownership belongs to Collaborator, shall not be reproduced, copied, or used in any other ways without permission. Otherwise Collaborator will have the right to pursue legal responsibilities. This report is produced for non-profit research within Collaborator internal and graduate alumni. Operation Analysis Revenue jump in H1 indicate possible recover in the near future U-Ming’s revenue has declined to 6,391 million in 2016 (YoY -17.4%), the seventh consecutive year (excl. 2014). Yet the downward trend seems to come to an end after strong revenue result in 2017 H1 (YoY 34% for H1). The growth is attributed to the increase in freight rate, especially that for capesize. Rise of freight rate is pivotal to U-Ming’s revenue growth because utilization rate of U-Ming is incredibly high (90%+, company data). Freight revenue consists over 98% of U-Ming’s revenue. In 2016, totally 36,468 thousand dwt goods were shipped, with iron ore and coal primary cargo. However, in terms of YoY, shipping amount has been subdued after peaking in 2014. Exhibit 7: Global Dry Bulk Shipping Supply Demand Excess (Shortage) Unit: mn dwt Source: Crucial Perspective, Clarksons, UNCTAD, IMF, Reuters Eikon, Collaborator Research -5% 0% 5% 10% 15% 20% (800) (600) (400) (200) 0 200 400 600 800 1,000 1,200 2003 2004 2005 2006 2007 2008 2009 2010 2011 2012 2013 2014 2015 2016 2017E 2018E 2019E 2020E Supply-Demand Excess (Shortage) Supply growth (RHS) Demand growth (RHS)
- 6. 6 Copyright ownership belongs to Collaborator, shall not be reproduced, copied, or used in any other ways without permission. Otherwise Collaborator will have the right to pursue legal responsibilities. This report is produced for non-profit research within Collaborator internal and graduate alumni. Exhibit 8: U-Ming’s Revenue Unit: mn, NTD Exhibit 9: Total Amount of Goods Shipped Source: Company data Source: Company data Cost reduction from fleet update/low bunker prices The cost and expense have steadily decreased thanks to sells of outmoded vessels and low bunker prices. A newer ship will enable U-Ming to downsize its workforce required for maintaining operations, for instance, average crew size per ship fall from 21 to 19 people. Nevertheless, we still believe the COGS in 2017 will increase slightly as new vessels were put into operation. Bunker price is usually an important factor for gross profit in shipping industry (~40% of COGS, we estimate). Bunker prices are quite stable over the past 3 years, basically in pace with the development of oil prices. Exhibit 10: Cost & Expense Unit: mn, NTD Exhibit 11: Bunker Prices Unit: USD/mt Source: Company data Source: Clear Lynx -50% -40% -30% -20% -10% 0% 10% 20% 30% 40% 50% 0 500 1,000 1,500 2,000 2,500 3,000 3,500 4,000 03/10 03/11 03/12 03/13 03/14 03/15 03/16 03/17 Net Sales YoY (RHS) -15% -10% -5% 0% 5% 10% 15% 0 5,000 10,000 15,000 20,000 25,000 30,000 35,000 40,000 2010 2011 2012 2013 2014 2015 2016 Iron Ore Coal Cement Oil Others YoY Unit: T tons 0 100 200 300 400 500 0 1,000 2,000 3,000 4,000 5,000 6,000 7,000 8,000 2008 2009 2010 2011 2012 2013 2014 2015 2016 Cost Of Goods Sold Operating Expenses (RHS) 0 100 200 300 400 500 600 700 01/14 07/14 01/15 07/15 01/16 07/16 01/17 07/17 HSFO180 HSFO380 MGO LSMO
- 7. 7 Copyright ownership belongs to Collaborator, shall not be reproduced, copied, or used in any other ways without permission. Otherwise Collaborator will have the right to pursue legal responsibilities. This report is produced for non-profit research within Collaborator internal and graduate alumni. Exhibit 12: Margin Analysis Exhibit 13: Net NOI Breakdown Unit: mn, NTD Source: Company data Source: Company data Non-op. income/expense sway net income for years Non-op. income plays a big role in pre-tax income for years; it is normally a positive contributor to pretax income and is more influential than ever recently as operating income fluctuates around zero. Change in non-op. income largely come from investment-related income (mostly dividends received) and exchange gain (60%+/~20% of pretax income, 5-yr average). For investment-related income, U- Ming’s holdings are all subsidiary or sub-subsidiary of Far Eastern Group, so equity method is adopted when recognizing investment income. Table 2: Long-term Investment Details Source: Company data -2,000 -1,000 0 1,000 2,000 3,000 4,000 5,000 6,000 7,000 8,000 -1,250 -850 -450 -50 350 750 1,150 1,550 1,950 2,350 2,750 2009 2010 2011 2012 2013 2014 2015 2016 Net Investment-related income Net Exchange Gain Net Gain-Disposal F/A Net Interest Income Others Operating Income (RHS) Pretax Incom (RHS) -60% -40% -20% 0% 20% 40% 60% 80% 100% 03/10 03/11 03/12 03/13 03/14 03/15 03/16 03/17 Gross Margin % Operating Income % Pre-Tax Income %
- 8. 8 Copyright ownership belongs to Collaborator, shall not be reproduced, copied, or used in any other ways without permission. Otherwise Collaborator will have the right to pursue legal responsibilities. This report is produced for non-profit research within Collaborator internal and graduate alumni. Valuation: Initiated Coverage with 12-month Target Price of NT$39.15 At the current stock price of NT$33.5, U-Ming is priced at about 1.3x PBR, which is much higher than the industry average 6.9x. However, it is still below its 5-year average 1.35x; meaning that overall confidence in dry bulk shipping industry still not resume. Given how the market is valuing U-Ming, for target selection, we apply a target multiple of 1.5x, which is slightly higher than its 5-year average, for that: 1) High utilization rate will benefit U-Ming’s profit immediately when the freight rates go up. 2) Although panama type will keep growing even in 2018/19, U-Ming would be affected lesser since a certain percentage of its current vessels are under long-term contracts; also, normally freight rate for eco-ship is higher. 3) U-Ming is backed by Far Eastern Group, and therefore, U-Ming is less to be faced with financial distress. Potential risks 1) Recently, oil price is increasing on the news that OPEC will be stricter on curbing oil production. This might drive up the cost. 2) It’s possible that rebounds in G7 are temporary, and this can make U-Ming even worse under heavier maintenance burden derived from larger fleet. Exhibit 14: Revenue Breakdown Source: Collaborator Research Estimate Exhibit 15: PBR vs. Quick Ratio Exhibit 16: U-Ming PB Band Source: Company data, TEJ Source: Company data, TEJ 0 2,000 4,000 6,000 8,000 10,000 12,000 2016 2017E 2018E Capesize Panamax Handymax Others Unit: mn, NTD 6,391 8,390 10,826 0.5 0.6 0.7 0.8 0.9 1 1.1 1.2 1.3 0% 50% 100% 150% 200% PBR Quick Ratio U-Ming (2606 TT) Wisdom (2637 TT) Chinese Maritime (2612 TT) Sincere Navigation (2605 TT) Taiwan Navigation (2617 TT) Shih Wei Navigation (5608 TT) 15 25 35 45 55 65 75 01/10 12/10 11/11 10/12 09/13 08/14 07/15 06/16 05/17 0.7x 0.9x 1.2x 1.5x 1.8x 2x 2.3x U-Ming
- 9. 9 Copyright ownership belongs to Collaborator, shall not be reproduced, copied, or used in any other ways without permission. Otherwise Collaborator will have the right to pursue legal responsibilities. This report is produced for non-profit research within Collaborator internal and graduate alumni. Financials & Valuation
- 10. 10 Copyright ownership belongs to Collaborator, shall not be reproduced, copied, or used in any other ways without permission. Otherwise Collaborator will have the right to pursue legal responsibilities. This report is produced for non-profit research within Collaborator internal and graduate alumni. Disclaimer These report contain certain forward-looking statements with respect to the results of operation, financial condition and current expectation about future events. By their nature, forward looking statements involve risk and uncertainty because they relate to events and depend on circumstances that will occur in the future. In preparing the information herein, Collaborator have relied upon and assumed, without independent verification, the accuracy and completeness of all information available from public sources or which was provided to Collaborator or which was otherwise reviewed by Collaborator. Neither Collaborator nor its advisors have made any representation or warranty as to the accuracy or completeness of such information and nor so they assume any undertaking to supplement such information as further information becomes available or in light of changing circumstances. None of Collaborator, nor any of their respective affiliates, advisers or representatives shall have any liability whatsoever (in negligence or otherwise) for any loss howsoever arising from any use of this presentation or its contents or otherwise arising in connection with this presentation. Neither this presentation nor any of its contents may be reproduced to a third party without the prior written consent of Collaborator.