1.
Propulsion System
Aaron Spanner, Annie Lin, Edwin Romero, Diana Alsindy, Jae Oh, Jansen Quiros
i. Introduction
The Students for the Exploration and Development of Space at the University of
California, San Diego (SEDS@UCSD) Chapter is researching additively manufactured
propulsion thrusters. The first monopropellant engine, named Callan, was designed
and tested by SEDS@UCSD. This engine includes an additively manufactured diffuser
section, reaction chamber, and nozzle module, which are printed in separate pieces to
be bolted together. The catalyst pack is not additively manufactured and is assembled
through traditional manufacturing processes. Presented in this document is the ground
testing of Callan engine in Purdue University prior to Ground Tournament 3, the
Propellant Feed system Ground testing at Open Source Maker Labs in Vista, CA, as
well as the design changes of the first iteration of the thruster. The 3D printed thruster
aims to promote the Cube Quest Challenge and its mission of completing a lunar orbit
in December 2018. (SEDS@UCSD) will be approaching this challenge by designing
Triteia: a 6U configuration CubeSat designed to achieve a polar lunar orbit from a
trans-lunar injection trajectory through the SLS EM-1 secondary payload deployment
sequence. Triteia transforms from an unassuming, ordinary CubeSat to an autonomous
and intelligent power management system with a state-of-the-art additively
manufactured high test hydrogen peroxide (H2O2) propulsion unit that allows for
extraordinarily fast in-space translational speeds. This is an unprecedented level of
detail in design as Triteia’s propulsion system is built with direct metal laser sintering
(DMLS) techniques that manufacture the thruster as 3 separate modules: the diffuser
plate, reaction chamber, and the nozzle, thereby allowing for unlimited customization
and total aesthetic control. SEDS@UCSD has embarked on designing an entirely new,
Hydrogen Peroxide (H2O2) monopropellant propulsion system with never-before seen
Delta-V and thrust capabilities onto the 6U Triteia CubeSat. Upon anticipation for
securing the Lunar Derby prize in NASA’s Cube Quest Competition, this sophisticated
propellant structure will be one of the pioneers of its kind to evolve away from the
conventional electric propulsion thrusters.
1
2.
Table of Contents
i. Introduction 4. Subsystem Verification
1. System Requirements 4.1 Callan Testing
1.1 Volume 4.1.1 Theoretical Results
1.2 Safety 4.1.2 Experimental Results
1.3 Material 4.2 Brassboard Testing
1.4 Thermal 4.2.1 Theoretical Results
1.5 Storage and Handling 4.2.2 Experimental Results
1.6 Electrical Power
2. Subsystem Design
2.1 Nomenclature
2.2 Propulsion System Configuration
2.3 Component List
2.4 Thruster Design Changes
3. Subsystem Analysis
3.1 Delta-V Analysis/Propellant Mass Budgets
3.1.1 Constant Mass Flow Rate
3.1.2 Variable Mass Flow Rate
3.2 Propellant Bladder
3.3 Pressure Vessel Sizing and Stresses
3.3.1 Structural Analysis
3.4 Lines and Fittings
3.5 Flammability of Materials
2
3.
I. System Requirements
Category Requirement: Verification Method:
1.1 Volume The propulsion system was allotted
3300 of volume within the 10cm xcm3
20 cm x 30 cm structure.
The CAD of our system fits within the chassis
that is designed to fit the allotted volume. The
assembled system will be measured to verify.
[SPS.SPL.005] Dispenser/Payload
Cleanliness. Payloads shall comply
with the GSDO-RQMT-1080,
Cross-Program Contamination Control
Requirements document for visibly
clean standard level.
The system meets the payload cleanliness
design challenge, because all fittings, valves,
tubes, and tanks that make up the system will
be subject to oxidizer cleaning by AstroPak and
subsequent inspection.
[SPS.SPL.006] Payload Storage:
Payloads shall be storable up to 6
months under conditions listed in
Table 3-2.
The system meets the storage design challenge
based on the analysis performed because the
materials chosen for the propellant storage are
class 1 compatible with hydrogen peroxide.
Aclar 22C was chosen for the fuel bladder
material because it has a low AOL with higher
concentrations of HTP.
1.2 Safety [IDRD.3.4.4.3] Pressurized systems
with lines and fittings less than 1.5
inches diameter (outside diameter
(OD)) must have a Factor of Safety
(FOS) for Pressure of 2.0x MDP for
proof and 4.0x MDP for ultimate.
All lines and fittings meet the minimum proof
FoS of 2x MDP and ultimate FoS of 4x MDP
based on the analysis performed, and will
undergo acceptance and qualification tests
during GT4.
[IDRD.3.4.4.3] Pressurized systems
with reservoirs / pressure vessels must
have a FOS of 1.5 x MDP for proof and
a 2.0x MDP for ultimate.
All reservoirs/pressure vessels meet the
minimum proof FoS of 1.5x MDP and ultimate
FoS of 2x MDP based on the analysis and
simulations performed, and will undergo
acceptance and qualification tests during GT4.
[IDRD.3.4.4.3] Pressurized systems
for other components and their internal
parts which are exposed to system
pressure must have a FOS of 1.5x
MDP for proof and 2.5x MDP for
ultimate.
All other components ie solenoid and service
valves meet the minimum proof FoS of 1.5x
MDP and ultimate FoS of 2.5x MDP based on
vendor data, and will undergo acceptance and
qualification tests during GT4.
1.3
Material
All material and components in
contact with H2O2, must not
decompose with H2O2 unless
otherwise intended.
The tanks and tubing are made out of Al 6063
and the bladder is made of Aclar 22C, and these
have great compatibility with 90% HTP.
Furthermore, all the valves in the system are
made of stainless 316, which also has good
compatibility with peroxide. Only the catalyst
bed, made of silver and nickel, is meant to
decompose the peroxide. The amount of
decomposition is verified by our analysis.
3
4.
[IDRD 3.4.8.5] Materials and
processes shall be in accordance with
NASA-STD-6016. For materials that
create potential hazardous situations
as described in the paragraphs below
and for which no prior NASA test data
or rating exists, the payload developer
will present other test results for SLS
Program review or request assistance
from the MSFC in conducting
applicable tests.
All materials and processes are in accordance
with NASA-STD-6061. An oxygen compatibility
assessment was made for all flammable
materials. A materials offgassing assessment
was performed for all materials using the
MAPTIS database. For those materials where no
flammability or offgassing data was provided,
we will request additional assistance from
NASA MSFC.
1.4
Thermal
[Secondary Payload User’s Guide]
The payload must be able to endure
surface temperatures ranging from
200F <TBR-001> with direct Sun on
one side to -143F <TBR-001> with
deep space on the other side.
The valves, pressure transducers, and
thermocouples were selected with vendor data
that show an operating range encapsulating
200F to -143F. This will be verified by testing in
an environmental chamber with simulated
temperature cycling.
The secondary payload integrated with
the deployer inside the MSA is not
expected to radiate heat or contribute
to the thermal loading for the SLS
vehicle.
The propulsion system has three valves in
series, giving it triple redundancy to ensure that
no peroxide will leak out of the system nor will it
allow the thruster to fire. No other part of our
sub-system can radiate heat.
1.5
Storage
and
Handling
Secondary payload design must be
compatible with storage of up to six
months under launch site
environments while awaiting
integration into the vehicle. Storage
temperatures can range from 65-85F.
Other environmental conditions are
discussed in the following sections.
The system meets the storage design challenge
based on the analysis performed because the
materials chosen for the propellant storage are
class 1 compatible with hydrogen peroxide.
Aclar 22C was chosen for the fuel bladder
material because it has a low AOL with higher
concentrations of HTP. This amount of
decomposition is verified by our analysis.
1.6
Electrical
Power
The valves and data acquisition
instruments of the propellant feed
system were chosen to keep the
electrical power consumption below 8
watts due to battery and solar power
constraints. The safety / redundancy
valves can not draw extra power.
Vendor data for the PTs and Thermocouples
show a maximum power draw of 0.8W. The
vendor for solenoid valves will consume a
maximum of 0.25W each. This falls well below
the 8W allotted. During final system testing the
power draw will be verified in an environmental
testing chamber.
4
5.
II. Subsystem Design
A subsystem testing on component was performed on the first iteration of Callan at
Purdue University in West Lafayette, Indiana using a test system provided by the
Maurice J. Zucrow Propulsion Laboratory. The purpose for conducting testing on the
thruster was to capture data about the chamber pressure, temperature, heat flux
across the chamber wall and the resulting pressure drop across the catalyst pack. This
suite of information from the extensive testing of Callan during startup and steady state
operation not only helps prove the flight technology level of additively manufactured
thrusters, but also helps with the analysis of other systems on-board the Triteia
CubeSat as a result of thruster operation in space. The test matrix outlining the
experiments required to obtain the data mentioned included a series of short pulses to
characterize and determine the ideal startup procedure for the thruster, as well as a
series of long duration burns to mimic the burn operations while the thruster is on the
mission. A system level testing was performed at Open Space Maker Labs (OSML) for
the propellant feed system to verify the design of the Triteia 6U Cube Satellite
propellant feed system, an assembled and tested brass board system for Callan.
Callan was subjected to iterative water flow testing to simulate the blowdown system
that is projected to occur during the actual flight.
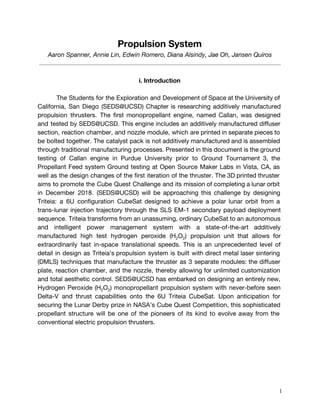
Figure 2.1 (left) 3D Printed Thruster. (middle-left) 3D Printed Front Diffuser Plate with Truncated
Nozzle. (middle-right) Purdue System Set-Up For Verification Testing. (right) Systems Verification
Testing For Propellant Feed System Cold Flow
5
6.
2.1 Nomenclature
Q= Volumetric Flow Rate
ṁ= Mass Flow Rate
=Dry massmf
=Propellant massmp
=Wet massmo
⍴= Density
Re= Reynold’s Number
U= Ullage Volume
P= Pressure
P0n = Stagnation pressure at chamber
μ= Viscosity
f= Friction Factor
l= Length of Straight Pipe
g= Acceleration Due to Gravity
k= Specific Heat Ratio
E = Young’s Modulus
D= Inner Diameter of Pipe
𝜉= Coefficient of Loss
A*= Throat Area
t= Thickness
= Residence timetΔ
σ= Stress
SF= Safety Factor
F= Force
Isp= Specific Impulse
= First Burn Timet1
=Burned off Massmburn,1
=Second Burn Timet2
=Burned off Massmburn,2
= Stagnation TemperatureT0
of Chamber
R= Specific Gas Constant
2.2 Propulsion System Configuration
As shown in the figure below, Triteia propellant feed system repositioned the thruster
to the top to conserve space margins and free up space for a potential payload.
Figure 2.2. (left) Original Propellant Feed System Configuration. (right) Modified Propellant Feed
System Configuration
6
7.
2.3 Component List
Table 2.1: Component List
Componen
t
Part Number Vendor
Materia
l
NDE
Techniqu
e
Acceptance
Testing
Qualificatio
n Testing
(for FLT
HWR)
Image
Solenoid
Valve
IEPA2421141H Lee Company SS 316 Ultrasonic
-Proof at
1.5*MDP
-Leak Test
-API 5911
- API 6A 1
Service Valve
For Press
99-V24000-01 Valcor
Al
2024-T85
11
Ultrasonic
-Proof at
1.5*MDP
-Leak Test
-API 591 1
- API 6A 1
Service Valve
For H2O2
99-V24000-01 Valcor Al 6063 Ultrasonic
-Proof at
1.5*MDP
-Leak Test
-API 591 1
- API 6A 1
Pressure
Relief Valve
PRFA2819700
L
Lee Company Al 6063 Ultrasonic
-Proof at
1.5*MDP
-Leak Test
-API 591 1
- API 6A 1
Pressure
Vessel
Custom Part Shwabel Al 6063 Ultrasonic
-Proof at
1.5*MDP
-Leak Test
-Vibration
- Cycle(1)
- Leak Test
- Burst
Fuel Bladder Custom Part
Aero Tec
Laboratories
Inc.
Aclar 22C
Liquid Dye
Penetrant
Inspection
-Leak Test
-Expansion
-Vibration
- Cycle(1)
- Leak Test
- Burst
1
"Qualification Standards on Performance Type Testing for Valves Used Top Side and in Facilitie." (2012):
n. pag. Cameron. Web.
7
8.
Pressure
Transducer
105C12
PCB
Piezotronics
SS 316
Radiograph
y
-Check
against
calibrated
Pressure
Gauge
-Vacuum
Environment
Testing
-Vibration
-Leak Test
Thermocoupl
e
Custom part
Thermometric
s Corporation
SS 316
Radiograph
y
-Check
against
calibrated
Thermomete
r
-Vacuum
Environment
Testing
-Vibration
-Thermal
Cycling
Tubing TBD
Kaiser
Aluminum
Al 6063
Radiograph
y
-Proof at
1.5*MDP
-Leak Test
-Vibration
- Cycle(1)
- Leak Test
- Burst
Fittings Custom Part
United
Titanium
Al 6063
Radiograph
y
-Proof at
1.5*MDP
-Leak Test
-Vibration
- Cycle(1)
- Leak Test
- Burst
Thruster Custom Part
Metal
Technologies
Inc. (MTI)
Inconel
718
Ultrasonic
-Hot Fire
Test at
Purdue
-Vibration
-Leak Test
-Vacuum
Environment
Testing
Note: (1)
- The cycle testing includes the information from Table XYX.
Table 2.2: Qualification Cycle Test Requirements
8
9.
2.4 Thruster Design Changes
Table 2.3: Thruster Design Changes
Design
Changes
Description
3D Print
Reduction
The holes built in the vertical
direction were more susceptible
to percent reductions in area
after 3D printing. The hole size
also had an effect on the
percent reduction in hole area,
showing that holes with smaller
diameters tended to “shrink”
more than larger sized holes. For
the 2nd print iteration, the
Internal holes were over-sized in
the CAD based on test data to
obtain correctly sized holes after
printing.
Orifice Plate
Deflection
The original assembly procedure for compressing the
catalyst pack had the compression take place against the
front diffuser plate, which was already attached to the
chamber. This compression plastically deformed the diffuser
plate. For the next Callan iteration the assembly process will
have the compression take place against a block of scrap
metal, and then the front diffuser plate will be attached after
the compression has occurred. This will avoid the deflection
seen in the image to the right.
Surface
Roughness
The chamber roughness and inner nozzle surface
will be machined to be as smooth as possible,
smooth enough to create a seal with the baffles,
~Ra=16. Blue surfaces are the ones we wish to
minimize surface roughness.
9
10.
O-Rings
Grooves/
Gaskets
The vermiculite gaskets used during testing began to
disintegrate when in contact with HTP. The vermiculite will
be replaced with 316 Stainless Steel gaskets that can
withstand the 1300F temperature and the highly corrosive
conditions of HTP during firing.
Nozzle
Truncation
The first iteration truncated print of Callan
had an expansion ratio of 4.023, not 1.8 as
intended. Throat radius is 0.0396” and exit
plane radius was 0.0794”, but has been
adjusted to 0.0531”.
III. Subsystem Analysis
3.1 Delta-V analysis/Propellant Mass Budgets
3.1.1 Constant Mass Flow Rate
The values in the Delta-V budget table were calculated assuming a constant mass flow
rate. Since the configuration of the propulsion system is a blowdown configuration and
will in reality have a variable mass flow rate as tank pressures decay over time, the
values in the table below are rough estimates subject to change once experimental
values are obtained for the solenoid valve pressure drops and the catalyst pack
pressure drop.
Table 3.1: Overview of Delta-V budget
Mission Phase Maneuver Name
GT2
Delta-V
(m/s)
GT3
Delta-V (m/s)
Comments
Cruise
Trajectory Correction
Maneuver (TCM)
46
30.41
Orbit Insertion Lunar Orbit Injection (LOI) 350 350
Error Margin 56.8 72.39 To be used for additional
10
11.
correction maneuvers, the
protection of historic lunar
sites, etc.
Total 452.8 452.8
Grand total Delta-V for the
mission
Table 3.2: Total Mass and Volume Budget
GT2 Raw Value GT2 Marginal
Value
GT3 Raw
Value
GT3 Marginal
Value
Delta-V, V Δ 396 m/s 452.8 m/s 380.41 m/s 452.8 m/s
Dry mass, mf 6.482 kg 6.799 kg 7.25 kg N/A
Propellant mass, mp 1.910 kg 2.227 kg (16.6%) 2.136kg 2.351 kg
Wet mass, mo 8.392 kg 8.709 kg 9.386 kg 9.600 kg
First Burn Time, t1 82.143sec 85.246sec 62.357 sec. N/A
Burned off Mass, mburn,1 0.248kg 0.257kg 0.188 kg N/A
Second Burn Time, t2 550.446sec 571.203sec 635.318 sec N/A
Burned off Mass, mburn,2 1.662kg 1.726kg 1.921 kg N/A
Mass Flow Rate, m˙ 0.00302 kg/s 0.00302 kg/s 0.00302 kg/s 0.00302 kg/s
Specific Impulse, Isp 156.27 sec N/A 156.27 sec N/A
3.1.2 Variable Mass Flow Rate
The propulsion system of Triteia is a blowdown system, and as such, the internal tank
pressure decays as fuel is depleted. This means that steady-state analysis does not
fully describe the system. In order to account for the unsteady flow in the system, this
quasi-static iterative method accurately describes the system and allows the
calculation of Thrust, , and Delta-v curves that are functions of time.Isp
Assumptions:
- H202 is an incompressible fluid
- Depletion of the tank is isothermal (slow depletion)
11
12.
- Helium pressurant behaves as an ideal gas
- Mass flow rate out of tanks is equal to the mass flow rate out of engine (mass
continuity)
- Quasi-static and one dimensional flow
- Neglect transient startup
- Chamber temperature is adiabatic flame temperature of H202 decomposition
- Velocity in engine chamber can be neglected (absolute conditions are same as
stagnation)
- Isentropic nozzle with choked flow
- Pressure drop across system determined experimentally
Analysis:
The change in ullage volume after a small enough residence time, = :tΔ t )( i+1 − ti
U t Δ = ⍴
ṁ
∙ Δ
In combination with the ideal gas law for an isothermal process:
(1)U UPtank,i i = Ptank,i+1 i+1
Describe the pressure of the tanks after by:tΔ
(2)Ptank,i+1 =
P Utank,i i
(U + ∙Δt)1 ⍴
ṁ
This equation still depends on the mass flow rate of the system, which for choked flow
through an isentropic nozzle is described by:
ṁ = A* ∙ Pchamber,i
√
k
T R0
( 2
k+1
)
− k+1
2(k−1)
With an experimentally determined hydraulic pressure loss ( ) across the solenoidPHL
valves and engine catalyst pack (from cold-flow testing):
Pchamber,i = Ptank,i − PHL
Such that:
(3) ṁ = A* ∙ P( tank,i − PHL)√
k
T R0
( 2
k+1
)
− k+1
2(k−1)
From equations (2) and (3), the pressure of the tanks at time i+1 can be determined
from the pressure and ullage volume of the tanks at time i. Equation (1) can be used to
find ullage volume at time i+1. This set of equations can be iterated through our
MATLAB code until the propellant mass is depleted to generate vectors of tank
pressure and ullage volume data. This data is then used to calculate the transient
Thrust, , and Delta-v that are characteristic of the blowdown system. See testingIsp
and verification section 4.2 for an analysis of the testing performed in order to obtain
the experimental hydraulic pressure loss across the solenoid valves and catalyst pack.
3.2 Propellant Bladder
The fuel containment bladder was designed to account for the volume constraint of the
tank profile and the amount of HTP the bladder material would cause to decompose.
See figure 3.1 for a schematic of the diagram.
12
13.
Table 3.3: Bladder Material and Active Oxygen Loss2
Material HTP
Concentration
AOL @ 30
C/week
AOL @ 66
C/week
Decomposed
Mass [kg]
Decomposition
Volume [cm3
]
Aclar 22C 90% 0.175 1.2 0.2571 183.6428571
Table 3.3 shows information about the Active Oxygen Loss of Aclar 22C, which was
chosen as the ideal propellant bladder material because the amount of liquid volume
that decomposed was much smaller than any other compatible materials.
Figure 3.1. (Left) Outline of bladder within the pressure vessel. (Right) Similar bladder fabricated by
Aero Tec Laboratories Inc.
3.3 Pressure Vessel Sizing and Stresses
The values in the pressure vessel volume requirements table were also calculated for a
constant mass flow rate. After the propellant volume was found, the ullage volume
was found and losses resulting from the blowdown configuration were included. The
losses found included the residual propellant volume and the amount of liquid
propellant lost to vapor from decomposition. The amount of propellant that changed
phase from liquid to vapor was calculated using the active oxygen loss of the material .3
Note that these values are also rough estimates since the delta-V values that were
used to find the volume parameters assume a constant mass flow rate.
Table 3.4: Pressure Vessel Volume Parameters
2
Ventura, Mark. "Long Term Storability of Hydrogen Peroxide - 41st AIAA/ASME/SAE/ASEE Joint
Propulsion Conference & Exhibit (AIAA)." Long Term Storability of Hydrogen Peroxide - 41st
3
Ventura, Mark. "Long Term Storability of Hydrogen Peroxide - 41st AIAA/ASME/SAE/ASEE Joint
Propulsion Conference & Exhibit (AIAA)." Long Term Storability of Hydrogen Peroxide - 41st
13
14.
Description Value [cm^3] Assumptions
Propellant Volume 856.872 10% propellant margin
Ullage Volume 285.624 25% of total tank volume
Residual Propellant Volume 34.274 4% of the propellant volume
Volume from Propellant Decomposition See Table 3.3
3.3.1 Structural Analysis
The Triteia pressure vessels were designed in accordance with ASME design
equations:
Cylinder Section
The following ASME equation taken from ASME Boiler and Pressure Vessel Code
Section III, Division 1 was used to determine the thickness of the cylindrical section for
the vessels:
t = PR
S(E)+0.4P
where
- P: Internal Pressure
- R: Outside radius
- S: Allowable Stress
- E: Weld Joint Efficiency
ASME 2:1 Elliptical Head
The following ASME 2:1 elliptical head thickness equation taken from ASME Pressure
Vessel Design Section VIII, Division 1 was used to determine the thickness of the
heads:
t = PDK
2(S)(E)−0.2P
where
- P: Internal Pressure
- D: Internal Diameter
- K: factor where K = ⅙*[2+(D/2h)2
]
- h: Internal height of the head.Typical 2:1 elliptical head with 1000mm inside
diameter will have a height of 250mm
- S: Allowable Stress
- E: Weld Joint Efficiency
Based on the width and length of the chassis frame, the maximum internal radius
available for the pressure vessels was:
14
15.
.0455 m (1.795 in) R =
Using this radius value as our constraint, the following table was produced:
Table 3.5: Pressure Vessel Design Parameters
Tank
Section
MDP Material FoS ASME Equation Inputs ASME
Equation
Outputs
Final
Thickness
Cylinder
Section
4.275
E-06
(620 psi) Aluminu
m 6063
2
P = 8549499.043 (1240 psi)
R = .0455 m (1.795 in)
S = 213737476.089 Pa (31
ksi)
E = 0.8
Min Required
Thickness
=.0023 m
(.0905 in)
.00317 m
(.125 in)
Elliptical
Head
4.275
E-06
(620 psi)
Aluminu
m 6063
2 P = 8549499.043 (1240 psi)
R = .0455 m (1.795 in)
S = 213737476.089 Pa (31
ksi)
E = 0.8
Min Required
Thickness
=.0023 m
(.0905 in)
.00317 m
(.125 in)
Note: Since the factor of safety for the shell is , which satisfies 1240 psi P = oS 2 F =
and exceeds the proof requirement in table 3-9 of SLS-SPIE-RQMT-018.
Since the final thickness of the pressure vessels was set to .125 inches, the pressure at
which the vessels begin to yield was estimated to be P = 11.435 MPa (1658.506 psi).
Since the mounting extrusions seen on the elliptical heads were expected to add stress
concentrations, a simulation was run to verify how much the extrusions decrease the
burst pressure of the vessels. The mounting face of the extrusions were fixed, and an
internal pressure of 1400 psi was applied to the internal tank walls.
15
16.
Figure 3.2: Simulation of tank at 1400 psi
As seen in the above figure, the mounting extrusions create stress concentrations on
the internal surface that weaken the vessel. However, the vessel does not yield at 1400
psi, and with a design pressure of 620 psi, the vessel maintains a FoS of 2.26, well
above the needed FoS of 2.
3.4 Lines and Fittings
Similar to the design of the Triteia vessel cylinder section, the following ASME equation
taken from ASME Boiler and Pressure Vessel Code Section III, Division 1 was used to
determine the thickness of the tubing for the Triteia propulsion system:
t = PR
S(E)+0.4P
The outer diameter of the lines and fittings will be 0.25 in (R = 0.125 in) and the material
is Aluminium 6063 which has a yield strength S of 31 ksi . The design pressure through4
the lines is 533 psi. Therefore, with a FoS of 4.0 our calculations use an Internal
Pressure P of 2132 psi. We are assuming a weld efficiency of 50% (E = 0.5) for
Aluminum.
The minimum thickness t is calculated to be:
.016 in t = (2132 psi) (0.125 in)
(31000 psi) (0.50) + (0.4)(2132 psi) = 0
Since the minimum wall thickness that our vendor carries is t = 0.018 in, our Aluminum
tubes satisfy the safety requirements.
3.5 Flammability of Materials
Table 3.6: Flammability Data for Metals5
Material Lowest Burn Pressure Highest No-burn Pressure
Mpa psia Burn Length(in) Mpa psia Burn length (in)
Silver (pure) No Data >68.9 >10,000 0
4
United States. ASM International. Aluminum Alloy 6063. Alloy Digest, Inc., n.d. Web. 21 Sept.
2016.
5
Manual 36 (Safe Use of Oxygen and Oxygen Systems: Handbook for Design, Operation, and
Maintenance: 2nd Edition), pp.1821, Table 31, 32
16
17.
Nickel 200 mesh No Data >68.9 >10,000 N/A
Inconel 718 ≤3.4 ≤500 0.5-4.3 None
300 series Stainless
Steel
0.4 200 0.1-1.3 0.8 111 0.1-0.9
Aluminum 6063 No Data
Since gaseous oxygen will be present in the system due to the decomposition of
hydrogen peroxide propellant during storage and the production of oxygen exhaust
when propellant contacts the silver catalyst, flammability analysis of materials under
worst operating environment is crucial.
According to MAPTIS Material Selection Database, the bladder material Aclar 22C has
an “I” flammability rating in a 40% oxygen concentration and 10.2 psia environment in
accordance to NASA-STD-6001B rating standard based on Test Rpt No. M105258-B
tested in 1997. This non-metal data should be re-tested because it exceeds 10 years
(Ref). Assistance from MSFC will be requested to conduct additional test.
Aluminum 6063 is a class 1 compatible material with high concentration hydrogen
peroxide. It is commonly used as the material for pipe, tubing and other uses(Ref). In
the Triteia propulsion system, Aluminum 6063 tanks will contain hydrogen peroxide
propellant under 533 psi tank pressure. Aluminum 6063 will be assumed flammable
because no data could be found on MAPTIS and ASTM manual 36. The following table
summarized the flammability analysis on Aluminum 6063 tubing and tank based on
Oxygen compatibility assessment.
Table 3.7. Bladder,Tank,Tubing OCA
* PCT data assuming commercially pure aluminum. Aluminum 6063 is not found on table 31
Table 3.8. Lee Solenoid Valve OCA
17
18.
Other materials that will be exposed to gaseous oxygen include thruster chamber
material Inconel 718 and catalyst pack mesh materials silver and nickel 200. 90%
hydrogen peroxide decomposes into 0.7076 mol fraction of H2O and 0.2924 mol
fraction of O2. As the liquid propellant decomposes along the catalyst pack, the
concentration of gaseous oxygen increases. The chamber pressure of the Callan
thruster is required to be 125 psi with estimate of 173 psi pressure drop across the
catalyst pack. As shown in the table above, the lowest burn pressure of Inconel 718 is
500 psia and 385 psi is well below the lowest burn pressure of Inconel 718 in 100%
oxygen concentration environment, therefore it is safe to assume Inconel 718 thruster
component is non-flammable in the system. Silver and nickel 200 both have highest
no-burn pressure above 10,000 psia and are considered to be non -flammable in the
triteia propulsion system.
IV. Subsystem Verification
4.1 Callan Testing
The objective of this testing was to obtain data about the thruster’s pressure,
temperature, thrust, the heat flux across the thruster walls, and flow velocity of the
propellant through the lines. Confirming the thruster design and efficiency from the
thrust values at ideal steady state operation would then prove the flight technology
readiness level of additively manufactured thrusters. The ideal testing of the Callan
thruster was to perform a series of burn sequences or pulse tests and determine what
amount of mass flow rate sprayed at the catalyst pack and at what time intervals would
produce the highest temperature increase in the catalyst pack for the least amount of
propellant. As a result, several pulse tests would be performed in order to compare
which pulse length and at what interval would be the most efficient. After confirming
the most efficient pulse, the thruster would then be tested at 15 sec and at 82 sec in
order to replicate the burn times that have been calculated during mission operation.
These steady state tests would help SEDS@UCSD analyze the fatigue and thermal
stresses experienced by the thruster during long operation. The test matrix is shown
below.
18
19.
Figure 4.1: Callan Engine Setup at Purdue University June 17th, 2016 (left). Callan Engine Test Matrix
(right)
4.1.1 Theoretical Results
The purpose of pulsing the Callan thruster is to warm and prime the catalyst pack for
sustained operation. As a result, the most important data for the pulse tests would be
the temperature data at various locations on both the inside and outside walls of the
thruster. The locations deemed the most critical were the top of the chamber, the mid
section of the chamber, and the bottom of the chamber. Based on academic literature
regarding hot fire tests and monopropellant hydrogen peroxide thrusters, the correct
sequence to prime a thruster similar in size to the Callan thruster would have pulse
lengths ranging from 200-600 milliseconds with 5 second intervals between each pulse
and repeating this process 6 times for every pulse. Despite this research, the required
number and length of pulses to successfully prime the thruster was suggested to
SEDS@UCSD by Purdue personnel to be specific to every engine and every test
conducted on any given day. As a result, the pulse tests conducted at Purdue
University were conducted by tracking the data from the thermocouple located at the
aft diffuser plate. After the first pulse test, the real time graphs from the thermocouple
would rise exponentially, then approach a peak value and finally decrease. Once the
graph would begin decreasing, another pulse was conducted and the graph would
again rise but now reach a higher peak than before. The pulse lengths were instead ½
second pulses. This process was followed for all 3 pulse tests conducted at Purdue.
Based on the research of other hydrogen peroxide monopropellant rocket engines, it
was expected that the temperature profile across the catalyst pack would increase as
the distance from the front diffuser increased. That is, the temperature of the catalyst
pack immediately following the front diffuser plate was expected to exhibit the lowest
temperature. The maximum temperature of the catalyst pack would exist in the section
just upstream of the aft diffuser plate. This temperature profile would exist during the
transient stage of thruster operation. Once the thruster reached steady state from the
priming of the catalyst pack, the catalyst pack would reach a uniform temperature
profile across the catalyst pack at the decomposition temperature of 90% hydrogen
peroxide at approximately 1400F or 1033K.
19
20.
4.1.2 Experimental Results
The experimental results for all three pulse tests conducted show a different
temperature profile for the catalyst pack than was expected. Whereas the literature
explains the highest temperatures to be at the aft diffuser plate, the tests showed the
highest temperatures to be in the mid section of the two diffuser plates, followed by
slightly lower temperatures at the front diffuser plate, and finally the lowest
temperatures at the aft diffuser plate. This temperature profile was found true for all
three pulse tests. Although this temperature profile was not expected, this data was
confirmed by the infrared images and videos taken for each pulse test. Both pieces of
equipment measured the maximum temperatures at the mid section for all three pulse
tests.
Pulse Test 1
The first pulse test in the series of
experimental tests served as a
baseline to properly pulse and
improve the pulse procedure of the
Callan thruster. From the data
collected, it was determined that the
mid-section of the catalyst pack
exhibited the highest temperature,
followed by the front-section of the
catalyst pack, and finally followed by
the aft-section of the catalyst pack.
The maximum temperature as
evidenced by the data shown in
Figure 4.3 (a) hovers around 527K or
489F. Furthermore, based on the
results of the first pulse test it can be
generalized that every pulse results in
an increase in the temperature of the
catalyst pack. Examining the mass
flow rate throughout the first pulse test in Figure 4.3 (b), it can be noticed that the flow
rates are excessively high. But, looking closer at the data, it can be seen that maximum
mass flow rate occurs at about 1.4 grams per second (zeroed) when a pulse is
actuated and returns to 0 grams per second after flow is shut off. Although no
thermocouples were used to directly measure the varying catalyst pack temperatures,
this temperature for the first pulse test was confirmed by the high speed footage. The
20
21.
high speed footage shows there was a clear exhaust exiting the truncated nozzle.
Because hydrogen peroxide decomposes into water and oxygen when in contact with
a reactive catalyst, a clear exhaust indicated that superheated steam (which is
transparent) and oxygen (which is also transparent) was exiting the nozzle. As a result,
these visual cues were a strong indication that full decomposition was taking place
inside the thruster, as the images show.
(a) (b)
Figure 4.3. Plots of (a) Temperature vs. Time at different locations on the thruster and (b) Mass Flow
Rate vs. Time from Pulse Test 1.
Pulse Test 2
The second pulse test produced much different results than the first pulse test. The
figures included below show that now, small droplets were exiting the truncated nozzle
during the start of the pulse and a liquid stream was exiting the nozzle during the end
of the pulse, unlike during the first pulse test. In the second pulse test, the same
temperature profile of the catalyst pack can be observed. The mid-section of the
catalyst pack exhibits the highest temperature, followed by the front catalyst pack, and
finally followed by the aft catalyst pack. However, the maximum temperature of the
catalyst pack dropped to 385K or 233F. The general trend in heating up the catalyst
pack applied in the second pulse test where a pulse resulted in an increase in the
catalyst pack’s temperature. The mass flow rates show a maximum flow rate of 3.7
grams per second which is similar to the results of the first pulse test. The mass flow
rate returns to 0 grams per second once the main valve for the test system is closed.
21
22.
(a) (b)
Figure 4.4. Plots of (a) Temperature vs. Time at different locations on the thruster and (b) Mass Flow
Rate vs. Time from Pulse Test 2.
Pulse Test 3
The third pulse test confirms the temperature profile of the catalyst pack. The
mid-section of the catalyst pack operates at the highest temperature, followed by the
front section, and finally followed by the aft section. In addition, after every pulse, the
catalyst pack temperature increased, similar to the first and second pulse tests. The
maximum temperature is consistent with the results of the second pulse test and
occurs at 385K or 233F. Similar to the second pulse test, the maximum mass flow rate
occurs at approximately 3.75 grams per second and returns to 0 grams per second
when the main valve is shut off.
(a) (b)
Figure 4.5. Plots of (a) Temperature vs. Time at different locations on the thruster and (b) Mass Flow
Rate vs. Time from Pulse Test 3.
Thermal images of the Callan thruster were taken during all three pulse tests. Figure 12
illustrates the maximum temperature achieved during the third pulse test. Examining
22
23.
the images, it is possible to see a consistency between the recorded data from the
thermocouples and the infrared thermometer as both sources of data measure a
maximum temperature around 355K or 179F.
Figure 4.6: (Left to Right): Thermal Distribution During Pulse Test 3
4.2 Brassboard Testing (Propellant Feed System Testing)
In order to further verify the design of
the Triteia 6U Cube Satellite propellant
feed system, SEDS@UCSD assembled
and tested a brass board system for
Callan. Callan was subjected to
iterative water flow testing to simulate
the blowdown system that is projected
to occur during the actual flight. This
testing was performed in order to
obtain experimental hydraulic pressure
loss data to be used in the iterative
MATLAB code discussed in section
3.1.2. The goal was to obtain a
relationship between instantaneous
tank pressure and the instantaneous
pressure drop across system
components such as solenoid valves and
the catalyst pack. This information would
consider the blowdown nature of the system.
23
24.
The brassboard PID, shown below, followed the actual flight plumbing and
instrumentation diagram with the exception of thermocouples, service valves, and the
two solenoids used in ensuring triple redundancy.
Figure 4.8 Press System and Propellant Feed System Testing PID
The team assembled the brassboard in-house at OSML and mounted it vertically for
testing. This included flaring all tubing, tightening all components, machining the
mounts for the system, wiring of solenoids and thermocouples, and designing and
implementing the LabVIEW and MATLAB codes for data acquisition and analysis. The
pressurization system was modified slightly from a previous SEDS@UCSD project, and
used a K-bottle of gaseous nitrogen for the pressurant gas. This setup can and will be
used for further verification testing of the system.
4.2.1 Theoretical Results
An average mass flow rate of 0.00302 kg/s is expected to ensure that enough thrust
will be produced to reach a delta-v of 396.0 m/s. As a blowdown system, the thrust of
the system is expected to decay exponentially as opposed to a pressure fed system
with a constant pressure outlet. However, assuming steady-state flow, a close
approximation can be determined. The head loss through the tubing and fittings were
calculated to be 10 psi. The flight solenoid valves are expected to have a pressure
drop of 75 psi each, and the catalyst bed was expected to have a nominal pressure
drop of 173 psi. Given the total pressure drop of 10 psi through the tubing and fittings,
225 psi through the three valves and the 173 psi through the catalyst bed, the
maximum design pressure for the pressure vessels on the flight system will be 533 psi.
24
25.
For the valves, Lohms law for liquids was used:6
L = I
KV
√S
H
Where H is the differential pressure loss, L is the valve’s Lohm rating, I is volumetric
flow rate, S is specific gravity, V is a viscosity compensation factor, and K is a units
constant.
The pressure drop across the lines and fittings was estimated using the following major
and minor head loss equations:
( )( ) hL, major = f l
D 2g
V 2
P (ρg) Δ = hL, major
ξ( ) hL, minor = 2g
V 2
P ξ ρV Δ = 2
1 2
The Ergun Equation was used to generate a MATLAB script to calculate pressure drop
across the catalyst pack. The relevant equations are:7
4.2.2 Experimental Results
The pressurized system tested a range of pressures between 400 and 660 psi in the
pressure vessels to determine the time dependency of pressure drop across the
catalyst pack and valves. Pressure transducers were placed above the tanks, above
and below the solenoid, and at the engine chamber in order to measure the pressure
drop across the solenoid valve and the catalyst pack and relate them to tank pressure.
Symmetric filling and pressurization of propellant was tested by using a single port to
fill both tanks, and a separate single port to pressurize. The simultaneous release of the
propellant through the system was tested using a single high pressure solenoid valve.
The brassboard was tested at MDP’s of 400, 550, and 660 psi. The following table
summarizes the pressure drop data for the three tests run:
Table 4.1: Operating Pressures of Propellant Feed System
6
http://www.leeimh.com/resources/engineering/p136_LohmLawsLiquidFlow.htm
7
Ergun, S., Orning, A.A. "Fluid Flow Through Packed Columns", Chemical Engineering Progress. 48 8994
(1952).
25
26.
GT2 GT3
Item Estimated MDP (psi) Estimated MDP (psi) Tested MDP (psi)
Pressure Vessels 390 533 400, 530, 660
Estimated (psi)P Δ Estimated (psi)P Δ Tested (psi)P Δ
Solenoid Valves (3) 60 75 88-62, 96-71, 111-81
Lines 10 10 27-9, 31-10, 34-12
Catalyst Pack 75 173 120-40, 160-45,
215-55
Estimated Chamber
Pressure (psi)
Estimated Chamber
Pressure (psi)
Tested Chamber
Pressure (psi)
Engine 125 125 10-5, 12-6, 15-8
After reviewing this data and observing a consistently minimal chamber pressure, we
decided to remove the catalyst pack and test again at 530 psi in order to determine if it
was actually the catalyst pack creating this pressure drop to such low chamber
pressures. When we ran this test we discovered the exact same pressure drop across
the engine and the same chamber pressure, even with the catalyst pack removed. See
the below plots of this data, and notice how they are practically identical despite the
catalyst pack being installed in the first set but absent in the second set. Just as a
note, the pressure spike seen just before 80 seconds represents the depletion of the
water in the tanks and the transition to flow of the purely gaseous nitrogen pressurant.
Figure 4.9. Cold Flow with Catalyst pack Screens @550 psi (Left) Callan Head Loss (Right) Chamber
Pressure.
26
27.
Figure 4.10. Cold Flow without Catalyst pack Screens @550 psi (Left) Callan Head Loss. (Right)
Chamber Pressure.
We concluded that the cause of this pressure loss that was independent of the catalyst
pack was the deformation of the front diffuser plate caused by compression of the
catalyst pack for the Purdue testing. The deformation caused the orifices in the diffuser
plate to partially and fully close, thus reducing the effective open area of the diffuser.
This reduction in area meant that a very large pressure drop occurred across the
diffuser, and thus we could not create a high enough inlet pressure to obtain useful
data on catalyst pack pressure drop.
To correct this issue we need to test with the second print of our engine Callan. The
second print will have the the design changes discussed in an earlier section, with
changed assembly process to prevent the same deformation from occurring, and is
expected to ship on September 22, 2016. We did not have this engine available for
testing before the GT3 deadline so we were unable to find an experimental hydraulic
pressure drop relationship with tank pressure to be used in the iterative blowdown
MATLAB code discussed earlier. Our intention is to use the setup we currently have to
test this new, un-deformed engine, with the purpose of obtaining the experimental
pressure drop. Once this data is collected, the effects of the blowdown system can be
included in our delta-V analysis and mass budget analysis.
27