Global Services Fact Sheet: Technology, Sourcing, Talent & Location Models
•
3 likes•1,486 views

Looking for an overview of the global services market? Look no further - this 6-page deck offers details on the business process services (BPS), IT services (ITS), and shared services/global in-house center (GIC) markets.

Recommended
Recommended
More Related Content
What's hot
What's hot (20)
Viewers also liked
Similar to Global Services Fact Sheet: Technology, Sourcing, Talent & Location Models
Similar to Global Services Fact Sheet: Technology, Sourcing, Talent & Location Models (20)
More from Everest Group
More from Everest Group (20)
Recently uploaded
Recently uploaded (20)
Global Services Fact Sheet: Technology, Sourcing, Talent & Location Models
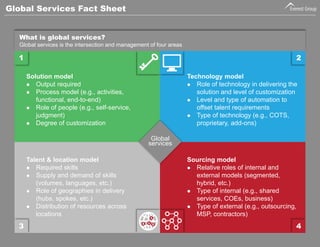
- 1. Global Services Fact Sheet Technology model Role of technologyin delivering the solution and level of customization Level and typeof automation to offset talent requirements Type of technology (e.g., COTS, proprietary, add-ons) Sourcingmodel Relative roles of internal and external models (segmented, hybrid, etc.) Typeof internal (e.g., shared services, COEs, business) Typeof external (e.g., outsourcing, MSP, contractors) Talent & location model Required skills Supply and demand of skills (volumes, languages, etc.) Role of geographiesin delivery (hubs, spokes, etc.) Distributionof resources across locations Global services Solutionmodel Output required Process model (e.g., activities, functional, end-to-end) Roleof people (e.g., self-service, judgment) Degree of customization 1 2 4 3 What is global services? Global services is the intersection and management of four areas
- 2. Global Offshore Services Market GIC Market Activity Heatmap Offshore Delivery Center Set-Up Locations, 2013 105 Set-Ups APAC EMEA LATAM 52% 16% 31% Offshore Delivery Center Set-Ups Tier 1 v Tier 2/3 City, 2013 # of transactions Outsourcing Transactions by Type www.everestgrp.com $US billion 73 81 90 98 107 21 24 26 29 31 2009 2010 2011 2012 2013 3rdparty service providers GICs 94 105 116 127 138 Distribution of Cloud Deals, 2013 47% 35% 15% # of deals Europe & UK North America APAC Latin America 3% GIC = Global In-house Center replaces “captive” No major activity (<10 centers) Nascent location (10-50 centers) Mature location (>100 centers) Emerging location (50-100 centers) NOT EXHAUSTIVE LA MEA Rest of Asia India Recent Change in GIC Activity Increase Decrease GIC Activity Trends Divestitures Set ups & expansions 89 70 71 2011 2012 2013 1 5 2 ITO BPO Both 1,730 1,978 1,929 1,633 1,679 73% 68% 66% 71% 75% 24% 30% 31% 27% 22% 4% 3% 2% 2% 3% 2009 2010 2011 2012 2013 Tier-1 Cities, by Country, Indexed to India BPO=100 100 236 150 314 257 518 254 246 143 321 186 407 336 632 243 375 0 200 400 600 India China Costa Rica Philippines Czech Republic Poland Brazil Mexico BPO ITO Indexed Annual Operating Cost Per FTE Global Services Fact Sheet Europe Tier 1 Tier 2/3/4 61% 50% 29% 86% 39% 50% 71% 14% APAC Central & Eastern Europe Latin America Middle East & Africa updated August 2014
- 3. Global Services Fact Sheet BPO Market Maturity S-curve Pioneers Emerging rapid growth Reaching maturity Market value creation Market maturity Horizontal BPO Industry-specific BPO Contact center HR www.everestgrp.com The largest and most mature BPO segment Largely commoditized for the core services and hence greater push to offer value-adds to increase client stickiness Provider M&As primarily driven to enhance scale Supply Chain Management F&A Most mature non-voice BPO segment Beyond North America and Europe, adoption spreading into emerging geographies (APAC, LATAM) Laborarbitrage is the traditional value lever though other levers / solutions increasingly important (automation, industry-specificity, end-to-end process enablement) Most-mature industry specific BPO market Adoption moving beyond large global banks to national and mid-tier banks Global sourcing a key value lever though domain expertise, technology leverage, and analytics increasingly important Healthcare Quickly moved beyond pioneering stage though market still getting defined Both broad-based BPO players as well as specialists playing / entering the market M&As likely to increase, driven primarily by expertise considerations Banking Fast growing market on the back of structural changes in the industry Adoption across payers and providers though solutions differ significantly Service provider M&As primarily driven by capabilities enhancements than scale Procurement Insurance updated August 2014
- 4. 7-8% 6-7% 8-9% 2-5% 9-12% 15-20% 13-16% North America Europe & UK APAC Others $US billion Annual growth rate Accenture | ADP Aon Hewitt | IBM NGA Human Resources Accenture | Capgemini| Genpact| IBM Infosys | TCS Serco | Sitel Teleperformance| Xerox AonHewitt| Fidelity | Towers Watson Accenture- Procurian| GEP | IBM | Infosys | Xchanging Alexander Mann Solutions | Kenexa| ManpowerGroup, Pinstripe | Pontoon Solutions | Randstad Sourceright| The RightThing Allegis Global Solutions | KellyOCG| Randstad Sourceright| TAPFIN, ManpowerGroupSolution Horizontal BPO Key Market Characteristics www.everestgrp.com Buyer maturation drives service evolution and doubling of deal sizes Market Characteristics CCO Contact Center BAO Benefits Administration MPFAO Multi-Process Finance & Accounting PO Procurement RPO Recruitment Process MSP Managed Services 23 21 10 13 25 23 20 Market Leaders # Providers Tracked Global Services Fact Sheet MPHRO Multi-Process Human Resources Growth is the theme: deal number and scope, geographic footprint, FTE count –all on the rise Slow growth, but significant change as APAC becomes the market’s activity hub Advances in FAO solutions empower buyers to switch providers in search of more value, improved customer experiences, and transformation US healthcare reform spurs steady growth; private health exchanges are expected to have impact going forward Evolution is the catchphrase in RPO as geographic mix shifts and an RPO+ value proposition comes to the fore 89% 1% 2% 8% 4.6 3.3 2.0 1.8 50% 3% 36% 11% 54% 33% 10% 3% 46% 34% 15% 5% 59% 25% 12% 4% 45% 32% 12% 11% 59% 1.05 8% 1% 33% 72.5 6.3 Elementary changes are altering the dynamics of the MSP market as buyer profiles and demands change, and the service provider landscape morphs updated August 2014
- 5. ITO Key Market Characteristics Global Services Fact Sheet www.everestgrp.com Global IT outsourcing market by service type 2013; US$ billion 36% 33% 28% 3% North America EMEA APAC Rest of World Global IT outsourcing market 2013; US$ billion 472 484 496 509 521 2013 2014 (E) 2015 (E) 2016 (E) 2017 (E) $US472 billion Application outsourcing Infrastructure outsourcing Consulting services 37% 35% 28% Global IT outsourcing market by geography 2013; US$ billion Manufacturing Energy, utilities, and chemical Retail, distribution, and CPG Telecom Electronics & hi-tech Healthcare & life sciences Media & entertainment Others 22-27% 20-25% 12-14% 7-9% 6-8% 6-8% 5-7% 4-6% 3-5% 3% 100% BFSI Public Total Global IT outsourcing market size by industry vertical 2013; Percentage 100% = US$472 billion updated August 2014
- 6. Global Services Fact Sheet $US billion Annual growth rate CSC | Fujitsu | HP | IBM Accenture | Cognizant | IBM | TCS | Wipro ITO Key Market Characteristics www.everestgrp.com Unprecedented disruption: providers and enterprises scramble as cloud and software-defined models unsettle the industry Market Characteristics Accenture | Cognizant | CSC | IBM | TCS Accenture | Cognizant | IBM | TCS Accenture | Cognizant | Dell Services | IBM Accenture | Cognizant | HCL Technologies | IBM| Infosys | TCS Accenture | CSC | Dell Services 27 20 28 12 20 18 12 Market Leaders # Providers Tracked Others Infrastructure Banking Insurance ~24% ~50% 0% ~15% ~12% ~11% ~14% North America Europe & UK APAC Cap Markets Life Sci& Pharma Provider Payer 10-15 8-13 5-8 42% 35% 15% 8% 49% 43% 4% 3% 47% 42% 7% 82% 11% 7% 49% 34% 17% 68% 17% 11% 4% 50-55 35-40 BANKING, FINANCIAL SERVICES, & INSURANCE HEALTHCARE Analytics and infrastructure services are most in demand as life sciences firms seek leverage in a challenging market A return of discretionary spend among banks drives applications investments and intensifying provider competition Insurance industry challenges drive SMAC adoption Environmental challenges – revenue, cost, regulations, customer demand –are forcing investments in technology, making capital markets the highest growth market in BFSI Market challenges drive ITO adoption with a focus on analytics, EHR, and digitization 35% 31% 28% 6% 163-167 30-35 4% Buyers in the payer market are beginning to look up from the reforms mandate to find additional value in ITO updated August 2014