An Inside Look at the Politics of Climate Science
•Download as PPTX, PDF•
1 like•5,826 views

Presentation by Professor Roger Pielke Jr.. Presented at the U of Florida, 16 March 2017.

Recommended
Recommended
More Related Content
What's hot
What's hot (20)
Similar to An Inside Look at the Politics of Climate Science
Similar to An Inside Look at the Politics of Climate Science (20)
More from Fabius Maximus
More from Fabius Maximus (7)
Recently uploaded
Recently uploaded (20)
An Inside Look at the Politics of Climate Science
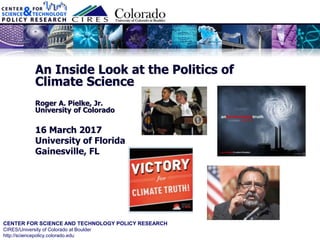
- 1. CENTER FOR SCIENCE AND TECHNOLOGY POLICY RESEARCH CIRES/University of Colorado at Boulder http://sciencepolicy.colorado.edu An Inside Look at the Politics of Climate Science Roger A. Pielke, Jr. University of Colorado 16 March 2017 University of Florida Gainesville, FL
- 2. slide 2 “You are in the Wikileaks release today” – October 2016
- 3. slide 3 Some voices must be silenced "I think it's fair say that, without Climate Progress, Pielke would still be writing on climate change for 538“ Email from Center for American Progress editor to billionaire donor Tom Steyer and John Podesta, after getting me fired from Nate Silver’s FiveThirtyEight
- 4. slide 4 A campaign of personal destruction
- 6. slide 6 Questions NOT addressed in this talk Is human-caused climate change real and/or significant? – Me: Yes it is What policies makes sense in response? – Me: Read my books!
- 7. slide 7 I have studied extreme events & climate policy since 1993
- 8. slide 8 The Apex – March 15, 2006
- 9. slide 9 Two months later, May 2006 …
- 10. slide 10 Hohenkammer workshop in May, 2006
- 11. slide 11 Source: Munich Re 2007 Increasing global losses
- 12. slide 12 •Co-sponsors: US NSF, Munich Re, GKSS Institute for Coastal Research, Tyndall Centre for Climate Change Research •32 participants from 16 countries •24 background “white papers” •Summary consensus report •Consistent with IPCC WGI Hohenkammer Workshop May, 2006
- 13. slide 13 •Analyses of long-term records of disaster losses indicate that societal change and economic development are the principal factors responsible for the documented increasing losses to date. •Because of issues related to data quality, the stochastic nature of extreme event impacts, length of time series, and various societal factors present in the disaster loss record, it is still not possible to determine the portion of the increase in damages that might be attributed to climate change due to GHG emissions •In the near future the quantitative link (attribution) of trends in storm and flood losses to climate changes related to GHG emissions is unlikely to be answered unequivocally. Hohenkammer Workshop May, 2006
- 14. slide 14 IPCC AR4 2007
- 15. slide 15 IPCC 2007: Reliance on “one study”
- 16. slide 16 Relies on “one study” -- What is that ”one study”?
- 17. slide 17 The “one study” was a 2006 workshop paper
- 18. slide 18 Hey look! I co-organized that workshop!
- 19. slide 19 •The graph from the IPCC AR4 does not appear in Muir-Wood 2006, nor does the underlying data! •In early 2010 during a public debate at the Royal Institution in London, Robert Muir-Wood revealed that he had created the graph, included it in the IPCC and then intentionally miscited it in order to circumvent the IPCC deadline for inclusion of published material. •IPCC Lead Author Muir-Wood (and RMS in a press release) said that the graph should never have been included in the report •In 2006 Risk Management Solutions (the company that employs RM-W) predicted that the risk of US hurricane damages had increased by 40%, necessitating much higher insurance and reinsurance premiums ($82 billion according to Sarasota Herald Tribune) Guess what?
- 20. slide 20 “We find insufficient evidence to claim a statistical relationship between global temperature increase and normalized catastrophe losses.“ Miller et al. 2008 (RM-W was a co-author) What the mis-cited source for the IPCC graph actually said when finally published in 2008
- 21. slide 21 26 February 2010 FROM THE ARTICLE: “Chief beef: Hurricanes and the bottom line Telling quote: "We cannot make a causal link between increase in greenhouse gases and the costs of damage associated with hurricanes, floods, and extreme weather phenomena." —interview with FP . . . For his work questioning certain graphs presented in IPCC reports, Pielke has been accused by some of being a climate change "denier.””
- 22. slide 22 “Long-term trends in economic disaster losses adjusted for wealth and population increases have not been attributed to climate change, but a role for climate change has not been excluded (medium evidence, high agreement).” IPCC SREX 2012 IPCC 2012 SREX on disaster losses
- 23. slide 23 The “investigation” of me 2015
- 24. slide 24 Media coverage …
- 25. slide 25 Representative Grijalva’s letter
- 26. slide 26 My 2013 Senate EPW testimony
- 27. slide 27 February 2014 – John Holdren, Science Advisor
- 28. slide 28 2014 Holdren Testimony Before Same Committee
- 29. slide 29 John Holdren: 6 Pages on 15 Words (!) The entirety of my 2013 Senate Testimony on Drought John Holdren’s wrote 6 pages in response
- 30. slide 30 One more . . .
- 31. slide 31
- 32. slide 32
- 33. slide 33 “Long-term trends in economic disaster losses adjusted for wealth and population increases have not been attributed to climate change, but a role for climate change has not been excluded (medium evidence, high agreement).” IPCC SREX 2012 IPCC SREX on disaster losses
- 34. slide 34 The beginning of the end
- 35. slide 35 Disaster costs in the global economy
- 36. slide 36 When journalists attack … The online magazine Salon explained that I was “the target of a furious campaign of criticism from other journalists in the field, many of whom say he presents data in a manipulative and misleading way.” Salon called for me to be fired, and labeled me a “climate change denialist.” Paul Krugman, a Nobel Prize winning economist and New York Times columnist labeled me a “known irresponsible skeptic.”
- 38. slide 38 So I lost my job
- 39. slide 39 A campaign of destruction “You should come with a warning label: Quoting Roger Pielke will bring a hail storm down on your work from the London Guardian, Mother Jones and Media Matters.” Paige St. John Los Angeles Times & Pulitzer Prize winning reporter 20 October 2015
- 40. slide 40 Let’s look at some data The latest science on trends in extreme events – Hurricanes (tropical cyclones) – Tornadoes – Floods – Drought – Other (temps, extreme precip)
- 41. slide 41 June 29, 2013 “W]hile we know no single weather event is caused solely by climate change, we also know that in a world that’s getting warmer than it used to be, all weather events are affected by it – more extreme droughts, floods, wildfires, and hurricanes. . . And Americans across the country are already paying the price of inaction in higher food costs, insurance premiums, and the tab for rebuilding.”
- 42. slide 42 A note on references IPCC = Intergovernmental Panel on Climate Change IPCC AR5 = 5th assessment report in 2013/14 IPCC SREX = Special Report on Extreme Events in 2012 IPCC AR5 IPCC SREX
- 43. slide 43 IPCC AR5 – Extreme temperatures “[T]here is medium confidence that globally the length and frequency of warm spells, including heat waves, has increased since the middle of the 20th century although it is likely that heatwave frequency has increased during this period in large parts of Europe, Asia and Australia.” “Medium confidence: increases in more regions than decreases but 1930s dominates longer term trends in the USA.”
- 44. slide 44 IPCC AR5 – Extreme precipitation “[I]t is likely that since 1951 there have been statistically significant increases in the number of heavy precipitation events (e.g., above the 95th percentile) in more regions than there have been statistically significant decreases, but there are strong regional and subregional variations in the trends.” Note: “Likely” = >66% “[T]here is medium confidence that anthropogenic forcing has contributed to a global scale intensification of heavy precipitation over the second half of the 20th century in land regions where observational coverage is sufficient for assessment.”
- 45. slide 45 Normalized losses 1900-2013
- 46. slide 46 Use climate data as a check on normalization results With no upwards trends in hurricane landfall frequency or intensity, there is simply no reason to expect to see an upwards trend in normalized losses.
- 47. slide 47 Where did they go? Source: P. Klotzbach
- 48. slide 48 A global view of tropical cyclone trends Source: Ryan Maue, after Maue (2011) http://models.weatherbell.com/global_major_freq.png
- 49. slide 49 Global landfalls updated through 2016 . . . Source: Weikn;e et al., updated
- 50. slide 50 IPCC AR5 – Tropical cyclones “Current datasets indicate no significant observed trends in global tropical cyclone frequency over the past century .” “[No robust trends in annual numbers of tropical storms, hurricanes and major hurricanes counts have been identified over the past 100 years in the North Atlantic basin.”
- 51. slide 51 IPCC AR5 – Floods “In summary, there continues to be a lack of evidence and thus low confidence regarding the sign of trend in the magnitude and/or frequency of floods on a global scale.”
- 52. slide 52 IPCC SREX co-authors – Floods “a direct statistical link between anthropogenic climate change and trends in the magnitude/frequency of floods has not been established... There is such a furore of concern about the linkage between greenhouse forcing and floods that it causes society to lose focus on the things we already know for certain about floods and how to mitigate and adapt to them.” Zbigniew et al. 2014 Hydrological Sciences Jopurnal
- 53. slide 53 More decreases than increases
- 55. slide 55 FEMA agrees …
- 56. slide 56 IPCC SREX – Tornadoes “There is low confidence in observed trends in small spatial-scale phenomena such as tornadoes and hail.”
- 57. slide 57 Normalized Tornado Losses in the US
- 58. slide 58 2016 Tornadoes –record low
- 59. slide 59 IPCC AR5 – Drought “There is not enough evidence to support medium or high confidence of attribution of increasing trends to anthropogenic forcings as a result of observational uncertainties and variable results from region to region. . . we conclude consistent with SREX that there is low confidence in detection and attribution of changes in drought over global land areas since the mid-20th century.” “Recent long-term droughts in western North America cannot definitively be shown to lie outside the very large envelope of natural precipitation variability in this region”
- 60. slide 60 Via EPA 2016 …
- 61. slide 61 Fraction of the earth in drought: 1982-2012 Hao et al. 2014 Scientific Data http://www.nature.com/articles/sdata20141
- 62. slide 62 Summary Have disasters in the US or globally become more costly because of human-caused climate change? Only one answer to this question is strongly supported by the available data, the broad scientific literature and the assessments of the IPCC: No. There is exceedingly little evidence to support claims that disasters have become more costly because of human caused climate change. But be careful saying that because you can lose your career
- 63. slide 63 All’s well that ends well …
- 64. slide 64 Thank you pielke@colorado.edu Blogs: – http://leastthing.blogspot.com – httP://thehonestbroker.org About me: http://rogerpielkejr.com/ 2007 2010 2011 2014 2016