Comparison of wood, gaines,
•
1 like•720 views

This document compares six nonlinear models (Wood, Gaines, Parabolic, Hayashi, Dhanno, and polynomial) for modeling the lactation curve of Simmental cows based on monthly milk yield records from 777 cows. Parameters for each model were estimated using nonlinear regression. Model performance was evaluated based on critical lactation points, residual plots, runs tests, adjusted R-squared, mean squared prediction error, and Bayesian Information Criteria. The polynomial model provided the best fit overall compared to other models.

Recommended
Recommended
More Related Content
What's hot
What's hot (9)
Viewers also liked
Viewers also liked (8)
Similar to Comparison of wood, gaines,
Similar to Comparison of wood, gaines, (20)
Recently uploaded
Recently uploaded (20)
Comparison of wood, gaines,
- 1. Korkmaz et al., The Journal of Animal & Plant Sciences, 21(3): 2011, Page: J. Anim. Plant Sci. 21(3):2011 448-458 ISSN: 1018-7081 COMPARISON OF WOOD, GAINES, PARABOLIC, HAYASHI, DHANNO AND POLYNOMIAL MODELS FOR LACTATION SEASON CURVE OF SIMMENTAL COWS M. Korkmaz, F. Üçkardeş* and A. Kaygisiz** Department of Mathematics, Faculty of Sciences and Arts, Kahramanmaras Sutcu Imam University, 46100 Kahramanmaras –Türkiye * Department of Animal Science, Agriculture Faculty, Ordu University, 52200 Ordu ––Türkiye, ** Department of Animal Science, Agriculture Faculty, Kahramanmaras Sutcu Imam University, 46100 Kahramanmaras Türkiye Corresponding author e-mail: alikaygisiz@ksu.edu.tr ABSTRACT The aim of this study was to determine a suitable nonlinear model explaining the lactation season curve of Simmental cows. Monthly milk yield records representing the test days milk yield of 777 Simmental cows were used to estimate lactation curve parameters by using Wood, Gaines, Parabolic, Hayashi, Dhanno and (second degree) polynomial models and to compare the shape of lactation season curves resulted from fitting all of these models. These models were given in explanation of the parameters and according to the lactation season, the parameters a, b and c for these models at all the periods were estimated. Secondly, the formula of some criteria, such as time to peak, peak production, turning point time and turning point production, are presented in mathematical procedure and then t the criteria values are calculated for all of the examined models. Furthermore, partial derivatives of the models according to the parameters were given in mathematical procedure. For the season, winter, spring, summer, fall and without season the lactation curve graphs for all the nonlinear models were drawn, respectively. Moreover, the best nonlinear model was used to determine the 2 adjusted coefficient determination ( R adj ) , mean square prediction error (MSPE) and Bayesian Information Criteria (BIC). The runs test was used for determining whether data differ systematically according theoretical curves. Generally, polynomial model gave the best nonlinearmodel to the data compared to the other models. Key words: Simmental cows, wood, gaines, parabolic, hayashi, dhanno and polynomial modelling, lactation curve. INTRODUCTION milk yield-time (Landete-Castillejos and Gallego, 2000; Orhan and Kaygisiz, 2002; Cagan and Ozyurt, 2008; Milk yield, fertility, and health are the most Ozyurt and Ozkan, 2009; Kucuk and Eyduran, 2010). substantial traits affecting performance in dairy Determination of the most suitable nonlinear model in a production (Kucuk and Eyduran, 2010). Bulls and cows herd is very important for developing more effective have been genetically evaluated on the basis of the 305-d- selection strategies and regulating management practices. milk yield in selection programs (Yilmaz et al., 2011). Hence, the aims of this study were to estimate lactation The best way to provide desirable genetic improvement curve parameters of the nonlinearmodels, and to compare of these animals in milk yield is to predict lactation shape performances of the nonlinear models used to explain parameters, used as selection criteria in breeding program relationship between milk yield-time in Simmental cows. and influenced by genetic and environmental factors..The monthly milk yield – lactation time data must be MATERIALS AND METHODS provided for estimating these shape parameters of several nonlinearmodels (Nelder, 1966; Wood, 1967; Rook et al., Data on monthly milk yield recordsfor the 1993). Cagan and Ozyurt, (2008) mentioned significant season representing the test days milk yield of 777 genetic correlation between milk yield and persistency, Simmental cows were collected from a herd maintained which is known as a cow’s ability to maintain milk at the Farm Production Research Institute of Kazova, production after peak point in a lactation curve. during the period from 1989 to 1996. Knowledge of the Although there were limited number of different study material was provided by Kaygisiz, (1996). complex modeling studies on the definition of lactation For a nonlinear regression model; shape in dairy cattle were very few (Yılmaz et al., 2011), yi f (ti , p ) i there were a great number of studies on comparison of (1) differerent nonlinearmodels with the aim of determining i 1, 2,..., n where y is the found independent the best nonlinearmodel explaining relationship between variable, t is the dependent variable, p is the vector of the 448
- 2. Korkmaz et al., J. Anim. Plant Sci. 21(3):2011 unknown parameters and n is the number of observation. and plot of residuals against predicted values and lack-of- The estimators of the vector of the unknown parameters fit test are “goodness of fit” criteria used to determine the are found by minimizing the sum of squares error best nonlinearmodel. (SSerr ) model as below, In assessing goodness of fit, it is essential to first examine a graph of a curve superimposed on the data n points. Many potential problems are easiest to spot SSerr ( yi f (ti , p )) 2 graphically. It is inappropriate to use the results of a i 1 (2) nonlinear regression program without first examining a Under the assumption that the i is the normal graph of the data together with the fit curve. In addition and independent with mean zero and common variance to viewing the graph, several statistical methods can be used for quantitating goodness of fit. 2 . Since yi and ti are fixed observations, the sum of The runs test is a simple and robust method, is squares residual is a model of p. Least squares estimates used to determine whether data differ systematically from of p are values which, when substituted into Eq. 2, will a theoretical curve. A run is a series of consecutive points make the SSerr minimum and are found by first with a residual of the same sign (positive or negative). The runs test statistic is calculated from the number of differentiating Eq. 2 with respect to each parameter and runs associated with a particular fit of the data (Motulsky then setting the result to zero. This provides the normal and Ransnas, 1987). equations. These normal equations take the form, The parameters of the nonlinear lactation season n f (ti , p ) curves were estimated using the NLIN procedure of SAS. ( y f (t , p)) i i 0 An assessment of the error of predicted relative to i 1 p j (3) observed values was made by calculation of the mean for j = 1, 2,.., k where k is the the number of the square prediction error (MSPE): n parameter. MSPE (Oi Pi ) 2 / n An iterative method must be employed to i 1 minimize the SSerr . Here the Levenberg-Marquards where i = 1, 2, . . , n n is the number of experimental observations, iterative method is an estimator method, which represent and Oi and Pi are the observed and predicted values, a compromise between the Gauss-Newton method and respectively (Bibby and Toutenburg, 1977). the steepest descent method. It is a method that combines 2 the best features of both while avoiding their most serious The adjusted coefficient determination (R adj ) is limitations. Due this characteristic we decided to use the a rescaling of R2 by the degrees of fredom so that it method described by Ismail et al., (2003). Lactation involves a ratio of mean squares rather than sums of curves were described by the following formulas in Table squares. Similar to R2, it should be computed from the 1. residual mean squares: All of the examined models were fitted by the MSPE 2 Levenberg-Marquards algorithm using NLIN of SAS R adj 1 (SAS, 2000). Starting grids were specified such that all MS(corrected total) solutions fell within the outer limits of the search grids. The adjusted coefficient determination is more Time to peak, peak production, turning point time and comparable than R2 for models that involve different turning point production over the whole period of 2 lactation were calculated and compared with statistics numbers of parameters. A model with large R adj is more obtained from the actual data. favourable. The numerical value of 2 R adj the closer to The examined parameters were calculated by using the following formulas in Table 2. The partial one is indicates a better fit when the models are compared derivatives of the models with respect to each parameter (Sit and Melanie, 1994). (a, b and c) are given in Table 3. The partial derivatives Comparison of models was based on Bayesian of the nonlinear models must be required for the Information Criteria (BIC), which are model order Levenberg- Marquardt algorithm using NLIN procedure selection criteria based on parsimony and impose a of SAS package. penalty on more complicated models for inclusion of additional parameters. For that reason, BIC criteria is Statistical Evaluation: There are different statistical 2 better than R adj . BIC combines maximum likelihood tests for ranking and evaluating models. Sometimes results from these different tests seem contradictory, so (data fitting) and choice of model by penalizing the (log) an overall assessment is needed in this situation. The maximum likelihood with a term related to model 2 complexity as follows: number of runs of sign of residuals, MSPE, R adj , BIC 449
- 3. Korkmaz et al., J. Anim. Plant Sci. 21(3):2011 RSS According to these results, the residuals of all BIC nL n KLn(n) n seasons and overall indicates that the curves do not where RSS is the residual sum of squares, K is the deviate systematically from the points (P>0.05) in Table number of free parameters in the model and n is the 4. In a similar study, Şahin and Efe, (2010) used Durbin sample size. A smaller numerical value of either BIC and Watson test instead of runs test in their studies. Also MSPE indicates a better fit when comparing models autocorelation was not observed in this study. (Schwarz, 1978; AlZahal et al., 2007). The critical points and their values (Time to 2 Peak, Maximum Yield, Turning Point Time and Turning The BIC and R adj are useful for comparing Point Production) of all of the modelling for each season models with different numbers of parameters. They have are given in Table 5. For all season, by examining Table therefore more advantageous than MSPE. 5, Wood and Dhanno models were explained many important parameters in terms of dairy cattle. In addition, RESULTS AND DISCUSSION the results of Wood and Dhanno models were close to each other. In addition, the results of Wood and Dhanno To identify the lactation curves, the models models were close to each other. Gaines model did not which have many different structures have been reported have any critical point and moreover this model was in the literature. Six different models were evaluated simplistic and did not provide a physiological basis for using data collected in different seasons of Simmental the lactation curve (Val-Areeola et al., 2004). For dairy cows. Comparison of their predictive ability allows Hayashi and polynomial models, the critical points could identification of a mathematical model capable of not be accounted because of the structures of the curves. describing and providing a better perspective on the Parabolic model has only turning point and its production shape of the lactation curve of Simmental dairy cows. for all season except summer. The Figures 1-10 illustrates the estimated lactation season, winter, spring, summer and fall, curve Table 1. Models used to describe the lactation curve of for all of the modelling, respectively. All of the dairy cows nonlinearmodels gave fit well for each season. However, the only Wood and Dhanno modelling had the peak Models Functional form points. Similar result was also reported by Aziz et al., Wood y (t ) at b e ct (Wood, 1967) (2006). But the only Wood and Dhanno modelling have the peak points. Several studies have shown differences Gaines y (t ) ae bt (Thornley and France, 2005) in the general shape of the lactation curve (Ferris et al., 1985; Perochon et al., 1996; Ramirez-Valverde et al., y (t ) b(e c / t e t / ac ) (Hayashi et al., Hayashi 1998; Orman and Ertuğrul, 1999; Landete-Castillejos and 1986) Gallego, 2000; Orhan and Kaygisiz, 2002), the most y (t ) a bt ct 2 (Dave, 1971) Polynomial common shape being a rapid increase after calving to a peak a few weeks later followed by a gradual decline y (t ) at bc e ct (Dhanoa and Le Du, until the cow is dried off. The models that shows the best Dhanoa this kind of curve are Wood and Dhanno models. 1982) 2 On the other hand, the residual plots show how Parabolic y (t ) ae(bt ct ) (Sikka, 1950) far each point is from the curve. The residuals of all where y is the milk yield (kg/day), t is time of lactation (month), models except fall season are randomly above and below e is the base of natural logarithm, a, b and c are the parameters zero. The residuals from the Hayashi and Gaines models, which characterize the shape of the curve. however, show a systematic pattern, with negative residual for the first and last point and positive residuals The least squares estimates of the parameters for the middle points. Such systematic deviations indicate and the goodness of fit of the nonlinear models for daily that the data are not well-described by those equations. mean milk production-month of lactation relationship are Similarly, the researchers such as Motulsky and Ransnas given in Table 6. All models were seamlessly fit to the (1987) reported that these systematic deviations for the data set. According to the meanings, the parameter data set were not appropriate. values of the models were in aggreement with each other The runs test statistic is calculated from the and did not indicate an extreme deviation. These results number of runs associated with a particular fit of the data. were in agreement with results reported by the The number of runs of sign of the residuals and significance values are given in table 4. 450
- 4. Korkmaz et al., J. Anim. Plant Sci. 21(3):2011 Table 2. Critical points and their formulas for all of the models Critical Points and Their Formulas Models Time to Peak Maximum Yield Turning Point Turning Point (Month) (Kg) Time (Month) Production (Kg) b b b b b ( b b) a( ) e 1. Wood b/c a (b / c) e b b c , c , b b b b b ( b b) a( ) e c c 2. Gaines - - - - ln( a )ac ( a ) ( 1 ) 2 ln( a )ac ( 2a ) ( 2 ) 3. Hayashi a 1 b( a 1 a a 1 a ) a 1 b( a 1 a a 1 a ) 2 b 4. Polynomial b / 2c a - - 4c bc bc b c b c bc ( bc bc ) a( ) e c , c , 5. Dhanoa b abbc e bc bc bc bc bc bc ( bc bc ) a( ) e c c b 2c ( b 2 c )( b 2 c ) b2 2c ( ) , 6. Parabolic b / 2c ae ( ) 4c b 2c ae 4c 2c -:does not have any critical points. Table 3. Partial derivatives of all of the models Partial derivatives of the models Partial derivatives of the models Used models Used models according to the parameters according to the parameters y b ct y t e 1 a a 1. Wood y 4. Polynomial y at b ln(t )e ct t b b y y 2 at bte ct t c c y y bc ct e bt t e a a 2. Gaines y y ate bt 5. Dhanoa at bc c ln(t )e ct b b t y bte ac ( ) y 2 at bc b ln(t )e ct at bc te ct a ac c t t y ( ) ( ) y 2 e c e ac e(bt ct ) 3. Hayashi b a 6. Parabolic y 2 ( t ) ( t ) ate ( bt ct ) y te te c ac b b( 2 ) y c c ac 2 2 at 2e ( bt ct ) c 451
- 5. Korkmaz et al., J. Anim. Plant Sci. 21(3):2011 Table 4. The Runs Test for each season and overall Overall Winter Spring Summer Fall Models season Runs Sig. Runs Sig. Runs Sig. Runs Sig. Runs Sig. 1. Wood 4 0.314 4 0.361 4 0.314 4 0.314 7 0.737 2. Gaines 3 0.094 5 0.737 4 0.314 3 0.094 7 0.737 3. Hayashi 3 0.094 5 0.737 4 0.314 3 0.094 7 0.737 4. Polynomial 4 0.314 4 0.314 4 0.314 4 0.314 7 0.737 5. Dhanoa 4 0.314 4 0.314 3 0.094 4 0.314 4 0.314 6. Parabolic 4 0.314 4 0.314 4 0.314 4 0.314 7 0.737 Table 5. For all of the models the critical points and their values for each season used models WINTER Wood Gaines Hayashi Polynomial Dhanoa Parabolic Time to Peak (Month) 1.216 - * * 1.165 * Maximum Yield (Kg) 14.910 - * * 14.948 * Turning Point Time (Month) 4.668 - * * 4.578 8.400 Turning Point Production (Kg) 12.388 - * * 12.462 9.347 SPRING Time to Peak (Month) 0.864 - * * 1.208 * Maximum Yield (Kg) 14.437 - * * 14.231 * Turning Point Time (Month) 3.996 - * * 4.684 7.410 Turning Point Production (Kg) 12.312 - * * 11.841 9.929 SUMMER Time to Peak (Month) * - * * 1.275 * Maximum Yield (Kg) * - * * 14.648 * Turning Point Time (Month) * - * * 4.846 * Turning Point Production (Kg) * - * * 12.151 * FALL Time to Peak (Month) 1.216 - * * 1.529 * Maximum Yield (Kg) 14.910 - * * 15.631 * Turning Point Time (Month) 4.668 - * * 5.439 8.430 Turning Point Production (Kg) 12.388 - * * 12.836 10.150 OVERALL Time to Peak (Month) 0.747 - * * 1.318 * Maximum Yield (Kg) 14.930 - * * 14.525 * Turning Point Time (Month) 3.747 - * * 4.948 6.743 Turning Point Production (Kg) 12.863 - * * 12.027 10.520 *: unavailable values because of the curve -:does not have any critical points. researchers such as Yılmaz and Kaygisiz, (1999); Orhan all seasons and all models. The value of the adjusted and Kaygisiz, (2002). In addition, the standard errors of coefficient determination estimated in this study were parameter values of the models were quite small. higher than the reported values by Kitpipit et al., (2008), Occuring the small errors increases the confidence of the Orman and Okan, (1999). model used in the study. Similar result was also reported The results of the other criteria of goodness of fit by Olori et al., (1999), Cilek and Keskin, (2008), are in harmony with the adjusted coefficient Silvestre et al., (2009), Gantner (2010). The results determination. In this context, by examining adjusted obtained by examining in terms of goodness of fit is quite coefficient determination and the values of MSPE and satisfactory. The highest 2 R adj value, the lowest MSPE BIC, the polynomial model compared to the other models shown the best consistency except in the summer season. and BIC value represents the best consistency (Motulsky In the summer seson, wood model shown the best and Ransnas, 1987). Firstly, The adjusted coefficient consistency. According to the result of criteria of determination changed in the range of 0.8980-0.9945 for goodness of fit, Hayashi model shown the lowest 452
- 6. Korkmaz et al., J. Anim. Plant Sci. 21(3):2011 consistency except in the summer season. In this study, Wood and Gaines models were consistent in our study. the values of MSPE and BIC changed in the range of However, the value of MSPE was small in our study. As 0.031-0.580 and -31,214 - -0,764, respectively. These a result in this study, it has been mentioned that a few values were quite small according to the reports of the lactation models was to be fit the data of Simmental cows researchers such as Aziz et al., (2006). A similar study and some of the criteria to be followed. was done by Val-Areeola et al., (2004). The results of Table 6. Parameter estimates with standart error and Goodness of fit measurements for all lactation season curve models. Standard errors are given in parentheses Parameters Goodness of fit WINTER 2 R adj A B C MSPE BIC 1. Wood 16.474 (0.467) 0.124 (0.062) 0.102 (0.017) 0.9575 0.280 -9.424 2. Gaines 16.738 (0.526) 0.070 (0.006) - 0.9475 0.389 -4.759 3. Hayashi 0.130 - -16.667 (0.526) 0.009 - 0.9407 0.391 -4.727 4. Polynomial 15.378 (0.399) -0.424 (0.167) -0.038 (0.015) 0.9824 0.116 -15.935 5. Dhanoa (16.499 1.087) 1.165 (0.780) 0.100 - 0.9628 0.245 -7.096 6. Parabolic 15.215 (0.541) -0.016 (0.017) 0.005 (0.002) 0.9745 0.168 -12.203 SPRING 1. Wood 15.752 (0.377) 0.076 (0.050) 0.088 (0.014) 0.9672 0.184 -13.549 2. Gaines 15.904 (0.386) 0.069 (0.005) - 0.9624 0.211 -13.156 3. Hayashi 0.130 - -15.904 (0.388) 0.009 - 0.9621 0.213 -10.812 4. Polynomial 15.005 (0.386) -0.593 (0.161) -0.017 (0.014) 0.9809 0.107 -18.968 5. Dhanoa 15.696 (0.937) 1.208 (0.676) 0.100 - 0.9681 0.179 -12.520 6. Parabolic 14.950 (0.494) -0.033 (0.016) 0.003 (0.002) 0.9760 0.135 -16.705 SUMMER 1. Wood 16.196 (0.026) -0.051 (0.035) 0.051 (0.009) 0.9821 0.089 -20.837 2. Gaines 16.090 (0.264) 0.064 (0.003) - 0.9795 0.102 -20.442 3. Hayashi 0.130 - -16.486 (0.317) 0.009 - 0.9714 0.142 -14.817 4. Polynomial 16.112 (0.411 -1.021 (0.172) 0.027 (0.015) 0.9755 0.122 -17.673 5. Dhanoa 16.132 (1.403) 1.275 (1.021) 0.100 - 0.9211 0.392 -4.692 6. Parabolic 16.331 (0.464) -0.072 (0.013) 0.001 (0.001) 0.9779 0.110 -18.719 FALL 1. Wood 16.474 (0.467) 0.124 (0.062) 0.102 (0.017) 0.9575 0.279 -9,424 2. Gaines 17.189 (0.355) 0.061 (0.004) - 0.9671 0.187 -14.413 3. Hayashi 0.130 - -17.363 (0.641) 0.009 - 0.8980 0.580 -0.764 4. Polynomial 16.368 (0.209) -0.500 (0.087) -0.026 (0.008) 0.9945 0.031 -31.214 5. Dhanoa 17.068 (0.894) 1.529 (0.672) 0.100 - 0.9747 0.144 -14.690 6. Parabolic 16.236 (0.295) -0.022 (0.008) 0.004 (0.000) 0.9912 0.050 -26.531 OVERALL SEASON 1. Wood 16.175 (0.330) 0.062 (0.045) 0.083 (0.012) 0.9743 0.144 -16.068 2. Gaines 16.305 (0.335) 0.067 (0.004) - 0.9713 0.161 -15,875 3. Hayashi 0.130 (0.000) -16.300 (0.367) 0.009 - 0.9661 0.190 -11,913 4. Polynomial 15.498 (0.329) -0.639 (0.138) -0.013 (0.012) 0.9860 0.078 -22,116 5. Dhanoa 15.979 (0.931) 1.318 (0.681) 0.100 (0.000) 0.9697 0.170 -13,045 6. Parabolic 15.475 (0.425) -0.037 (0.425) 0.003 (0.001) 0.9823 0.100 -19,734 a, b and c are parameters that define the scale and shape of the curve. 2 R adj = The adjusted coefficient determination MSPE= Mean Square Prediction Error BIC = Bayesian information criteria. 453
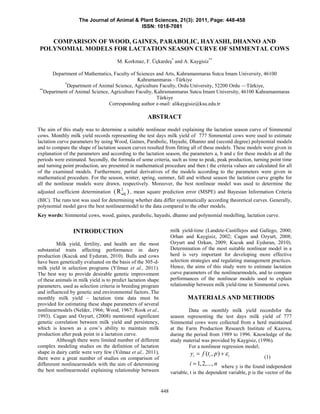
- 7. Korkmaz et al., J. Anim. Plant Sci. 21(3):2011 Daily Mean Milk Production Month of Lactation Figure 1: Estimated Lactation Curve for Winter Daily Mean Milk Production Month of Lactation Figure 2: Estimated Lactation Curve for Spring Daily Mean Milk Production Month of Lactation Figure 3: Estimated Lactation Curve for Summer 454
- 8. Korkmaz et al., J. Anim. Plant Sci. 21(3):2011 Daily Mean Milk Production Month of Lactation Figure 4: Estimated Lactation Curve for Fall Daily Mean Milk Production Month of Lactation Figure 5: Estimated Lactation Curve for all lactation Overall W in t e r 1 ,0 0 ,5 R e s id u a l 0 ,0 0 1 2 3 4 5 6 7 8 9 10 -0 ,5 -1 ,0 -1 ,5 Mo o n Figure 6: The Residual Plots for Winter 455
- 9. Korkmaz et al., J. Anim. Plant Sci. 21(3):2011 Spring 1.0 0.5 0.0 Residual 0 1 2 3 4 5 6 7 8 9 10 -0.5 -1.0 -1.5 Moon Figure 7: The Residual Plots for Spring Summer 1.0 0.5 Residual 0.0 0 1 2 3 4 5 6 7 8 9 10 -0.5 -1.0 Moon Figure 8: The Residual Plots for Summer Fall 1.5 1.0 0.5 Residual 0.0 0 1 2 3 4 5 6 7 8 9 10 -0.5 -1.0 Moon Figure 9: The Residual Plots for Fall 456
- 10. Korkmaz et al., J. Anim. Plant Sci. 21(3):2011 without season 1.0 0.5 0.0 Residual 0 1 2 3 4 5 6 7 8 9 10 -0.5 -1.0 -1.5 -2.0 Moon Figure 10: The Residual Plots for Overall Acknowledgments: The authors wish to thank Dr. Ecevit Predıctıon. Bulgarian J. Agric. Sci., 16(6): 794- EYDURAN for his valuable suggestions. 800. Ismail, Z., A. Khamis and Y. Jaafar (2003). Fitting REFERENCES Nonlinear Gompertz Curve to Tobacco Growth Data. Pakistan J. Agron. 2 (4): 223-236. AlZahal, O., E. Kebreab, J. France, and B.W.A. McBride Kaygisiz, A. (1996). Lactation Curve Traits of Simmental (2007). Mathematical Approach to Predicting Cattle. Tr. J. Vet. and Anim. Sci., 23 (1): 15-23. Biological Values from Ruminal pH Kitpipit, W., P. Sopannarath, S. Buaban and S. Measurements. J. Dairy Sci. 90 : 3777–3785. Tumwasorn (2008). Comparison of five Aziz M. A., N. A. Shalaby, O. M. El-Shafie, A. T. Mahdy mathematical functions for prediction of and A. Nishida (2006). Comparison between the monthly yield in thai multibreed dairy cattle shapes of lactation curve of Egyptian buffalo population. Kasetsart J. (Nat. Sci.) 42 : 246 – milk yield estimated by the incomplete gamma 255. function and a new model. Livestock Research Kucuk, M. and E. Eyduran (2010). Determination of the for Rural Development. 18: Article #59. best nonlinear model for describing complete Bibby, J., and H. Toutenburg (1977). Prediction and lactation of Akkaraman and German Improved Estimation in Linear Models. John Blackheaded Mutton x Akkaraman crossbreed Wiley and Sons, London. UK. (F1) sheep. Bulg. J. Agric. Sci., 16(2): 247-251. Cagan, V. and A. Ozyurt (2008). Parameter estimates for Landete-Castillejos, T., and L. Gallego (2000). The lactation curve of Holstein Friesian in Polatlı ability of mathematical models to describe the Agriculture Administration. Anim. Prod. shape of lactation curves. J. Anim. Sci. 78:3010– 49(1):5-12. 3013. Cilek, S. and I. Keskin (2008). Comparison of Six Motulsky, H. J., and L. A. Ransnas (1987). Fitting curves Different Mathematical Models to the Lactation to data using nonlinear regression: a practical Curve of Simmental Cows Reared in Kazova and nonmathematical review. FASEB J. 1: 365– State Farm. J. Anim. and Vet. Advances. 7 (10) : 374. 1316-1319. Olori, V. E., S. Brotherstone, W. G. Hill and B. J. Ferris, T. A., I. L. Mao, and C. R. Anderson (1985). Mcguirk (1999). Fit of standard models of the Selecting for lactation curve and milk yield in lactation curve to weekly records of milk dairy cattle. J. Dairy Sci. 68:1438–1448. production of cows in a single herd. Livest. Gantner, V., S. Jovanovac, N. Raguz, D. Solıc, K. Prod. Sci., 58: 55–63. Kuterovac (2010). Nonlınear Vs. Lınear Orhan, H. and A. Kaygisiz (2002). Comparison of Regressıon Models In Lactatıon Curve different lactation curve models for Holstein cattle. J. Anim. Prod., 43: 94–99 457
- 11. Korkmaz et al., J. Anim. Plant Sci. 21(3):2011 Orman, M. N., E. Okan (1999). Investigation of three Silvestre A. D. M., A. M. Martins, M. M. Santos, J. A. different lactation models in milk yields of Ginja, J. A. Colaco (2009). Lactation curves for Holstein Cows. Turk J. Vet. Anim. Sci., 23 : milk, fat and protein in dairy cows: A full 605-614. approach. Livest Sci 122: 308-313. Ozyurt, A. and M. Ozkan (2009). The lactation shape and Sit, V., and P. C. Melanie (1994). Catalog of Curves for effecting factors lactation curves of Holstein Curve Fitting. Crown Publications, England, cows bred in Middle Anatolia. Animal 108p. Production, 50(1):31-37. Şahin M., E. Efe (2010). Use of Cubic Spline Perochon, L., J. B. Coulon, and F. Lescourret (1996). Regressions in Modeling Dairy Cattle Lactation Modelling lactation curves of dairy cows with Curves. KSU J. Nat. Sci., 13(2) : 17-22. emphasis on individual variability. Anim. Prod. Val-Arreola, D., E. Kebreab, J. Dijkstra, and J. France 63:189–200. (2004). Study of the Lactation Curve in Dairy Ramirez-Valverde, R., G. Ramirez-Valverde, R. Nunez- Cattle on Farms in Central Mexico. J. Dairy Sci., Dominguez, and A. Tewolde-Medhin (1998). 87:3789–3799. Lactation curves ofAngus, Brown Swiss and Wood, P. D. P. (1967). Algebraic model of the lactation crossbred cows: II. Comparison of equations. curve in cattle. Nature, 216: 164-165. Agrociencia 32:325–330. Yılmaz, I. and A. Kaygisiz (2000). Lactation Curve Traits Rook, A. J., F. France, and M. S. Dhanoa (1993). On the Of Holstein Cattle’s. J. Agri. Sci., 6 (4): 1-10. mathematical description of lactation curves. Yilmaz, I., E. Eyduran, A. Kaygisiz, and K. Javed (2011). Journal of Agriculture Science, Cambridge. 121: Estimates of genetic parameters for lactation 97-102. shape parameters with multivariate statistical SAS: SAS Institute Inc. SAS User's Guide, Statistics. technique in Brown-Swiss cattle. Int.J. Cary, NC. (2000). Agric.Biol.13(2):174-178. Schwarz, G. E. (1978). Estimating the dimension of a model. Annals of Statistics, 6(2): 461–464. 458