SlideShare a Scribd company logo
1 of 36
Download to read offline
1
Preliminary statement for the
year ended 31 March 2011
London – 18 May 2011
ICAP plc (IAP.L), the world’s premier interdealer broker and supplier of post trade risk and information services, today
announced its audited results for the year ended 31 March 2011.
Continuingoperations
Yearended
31March2011
£m
Yearended
31March2010
£m
Growth
Revenue 1,741 1,605 8%
Netoperatingexpenses
1,3
(1,366) (1,251) (9)%
Profit
2
350 335 4%
Profitbeforetax–statutory 233 247 (6)%
EPS(basic) 28.7p 18.0p 59%
EPS(adjustedbasic)
4
39.9p 32.6p 22%
EPS(continuingadjustedbasic)
4
39.9p 35.4p 13%
Dividendspershare 19.95p 17.55p 14%
Group financial highlights:
• Group revenue from continuing operations increased by 8% to £1,741m with profit
2
of £350m up 4%
• Electronic revenue of £302m increased by 20% produced operating profit
3
of £123m up 23% - a record high for our
electronic broking business
• Post trade risk and information revenue rose 30% to £184m and produced operating profit
3
of £79m up 14% - our
strongest performance to date
• Electronic broking and post trade risk and information contributed 54% of operating profit
3
• The Group's operating profit
3
margin was 22% (2010: 22%), unchanged on the prior year as a result of investment in new
businesses and one-off costs.
• EPS (basic) up 59% to 28.7p; EPS (adjusted basic) up 22% to 39.9p
• The directors recommend a final dividend per ICAP share of 14.68p, which will be paid on 19 August 2011. The full year
dividend will be 19.95p compared with 17.55p per share in 2009/10
Michael Spencer, Group Chief Executive Officer, said: “ICAP delivered a solid performance during the financial year, facilitated
by our global reach and diverse range of services. It has been another period of substantial progress for our electronic broking
and post trade risk services businesses. During the year we continued to increase our market share.
This past year we concentrated on organic growth, leveraging existing assets and further developing the collaborative
relationships we have with our bank customers. We invested successfully in a number of new products and services, most
notably our electronic interest rate swap platform, which has now transacted more than €360 billion in trades since its launch
last September.
In the first half of the year we saw generally quieter markets but delivered good revenue and earnings growth driven primarily
by our electronic broking. We benefited from the strength of our emerging markets businesses, continuing turbulence in the
world’s commodity markets, significant euro denominated bond issuance and rising concerns about higher inflation. More
recently, the political and economic uncertainties in the Middle East and North Africa have contributed to volatility in global
financial markets.
I am sorry to say that after six years at ICAP, our Group Operating Officer Mark Yallop has decided to leave the Group. During
his time with ICAP Mark has been heavily involved in the strategic development of our business and I would like to thank him for
the outstanding contribution he has made to the firm. Mark has agreed to remain with ICAP until we appoint a replacement.
We have made a good start to the new financial year and the short-term outlook is underpinned by macroeconomic stress and
continuing market volatility. We are confident we can continue to deliver growth as we continue to invest in the business.”
There will be a briefing for analysts and investors at 09:30 BST on Wednesday 18 May 2011 at 2 Broadgate, London EC2M
7UR. The presentation slides and an audiocast will be available on the website, www.icap.com at 17:00 BST on Wednesday 18
May 2011. The audiocast will remain on the website for six months. A further conference call will be held at 14:30 BST/09:30
EST for investors and analysts in North America. For dial in details and a copy of the presentation please contact Maitland on
+44 (0) 20 7379 5151.
Notes
1. Includes operatingexpenses net of other income.
2. Profitisdefined as pre-taxprofit from continuing operations before acquisitionand disposal costs and exceptionalitems.
3. Fromcontinuing operationsexcludingacquisitionanddisposal costs andexceptionalitems.
4. Adjusted basic EPS is based on total earnings beforeacquisition and disposalcosts andexceptional items (andtheir tax effects).Continuing adjustedbasic
EPS is based onearnings from continuing operations before acquisitionand disposal costs andexceptional items.
Contacts:
Michael Spencer Group Chief Executive Officer +44 (0) 20 7050 7400
Mike Sheard Director of Corporate Affairs +44 (0) 20 7050 7103
Alexandra Umpleby Head of Media Relations +44 (0) 20 7050 7104
Alex Dee Head of Investor Relations +44 (0) 20 7050 7123
Neil Bennett Maitland +44 (0) 20 7379 5151
Notes to editors:
About ICAP
ICAP is the world’s premier interdealer broker and provider of post trade risk and information services. The Group matches
buyers and sellers in the wholesale markets in interest rates, credit, commodities, foreign exchange, emerging markets,
equities and equity derivatives through voice and electronic networks. For more information go to www.icap.com
3
Preliminarystatementfortheyearended31March2011
Review of operations
The Group reports revenue of £1,741 million, 8% above the prior year reflecting substantial progress in ICAP’s electronic
broking and post trade risk and information businesses. We have seen increases in volumes on both our traditional fixed income
and FX electronic trading platforms together with the successful launch of our new euro IRS platform.
During the year, we moved closer to our strategic goal to have our operating profit generated evenly between voice broking,
electronic broking and post trade risk and information with a total of 54% generated by our non-voice broking businesses.
Strong volumes contributed to the percentage of operating profit* generated by the electronic broking platforms increasing
from 28% to 33%, while the acquisition of TriOptima in March 2010 and higher volumes in Traiana offset the impact of lower
activity levels in Reset, resulting in a two percentage point increase to 21% for post trade services share of Group operating
profit*.
The management of our cost base remains an area of substantial focus and, while we saw net operating expenses increase by
9% in the year to 31 March 2011, a substantial component of the rise relates to £17 million of non-recurring one-off costs
and the Group’s investment in businesses, systems and processes which will fuel future growth. The acquisition of TriOptima, as
well as investment in developing our newer voice businesses, including Brazil, accounted for £42 million of the total increase,
45% of the total if we exclude FX, with a further £22 million reflecting our increased spend on technology systems.
The Group reports an operating profit* from continuing operations of £375 million, up 6% on the prior year due to a strong
performance by our electronic broking and post trade risk and information businesses offset by continued investment and one-
off costs. The Group’s operating profit margin generated from its continuing operations for the year ended 31 March 2011
remained unchanged at 22%.
Profit before tax of £350 million was up 4% on the prior year and includes a full year contribution from TriOptima which was
previously accounted for as an associate. Profit before tax on a statutory basis reduced by £14 million to £223 million primarily
as a result of higher pre-tax trading profits being partially offset by an increase of £22 million in amortisation of intangibles
related to the acquisition of TriOptima.
Delivering on strategic objectives
Our goals are to be the leading global intermediary, the leading post trade risk services provider and the main infrastructure
provider to the world’s wholesale financial markets. We aim to have at least 35% of overall interdealer market revenues and to
generate operating profit evenly distributed between voice broking, electronic broking and post trade risk and information
services. In 2010/11, 54% of ICAP’s operating profit was generated from electronic broking and post trade risk and
information activities, their highest combined level in ICAP’s history.
There are three components to our strategy:
• the expansion of our leading voice broking business;
• the growth of our global electronic broking business both through increasing volumes of existing products and by developing
new markets; and
• the development of our post trade risk and information businesses to provide innovative services that enable our customers
to reduce their costs and risks and to increase their efficiency, return on capital and capacity to process trades.
A year ago we said that we would be concentrating on growing our business organically and working with our customers to
expand the use of the market infrastructure in which we had previously invested. We have consolidated our position as a leading
global intermediary in the wholesale financial markets by a clear margin with a further increase in our market share. Our leading
voice broking business has expanded in emerging markets and commodities. Lower levels of activity in credit and equity
derivatives slowed our business in those products.
We’ve taken electronic markets into new asset classes following the launch last September of ICAP’s electronic euro interest
rates swaps (IRS) platform. The platform which has market maker support, brings increased transparency and greater efficiency
as well as lower transaction costs to the world’s largest OTC derivative market. This platform has now transacted over €360
billion in volume involving more than 4,300 trades representing over 20% of our euro IRS activity since its launch. We continue
to see month-on-month increases in activity on this platform and, in March 2011, over 30% of our euro IRS trades were
transacted on the platform. We plan to expand the platform to include dollar IRS during 2011.
This is a prime example of how we work closely with our customers, aligning our interests with theirs and expanding their use of
ICAP’s developing market infrastructure.
The development of our post trade risk and information businesses in providing innovative services has continued apace.
Traiana’s Harmony FX product has continued to gain significant market share with higher levels of integration with our customer
base and the CLSAS joint venture with CLS Group in FX has seen a very large increase in volume. In addition, Traiana recently
launched real-time straight-through-processing connectivity for our customers to CME Clearing for OTC FX derivatives and
non-deliverable forwards (NDFs).
* From continuing operations excluding acquisition anddisposal costs and exceptionalitems.
Business drivers
ICAP continues to have the potential for further growth and we have invested ahead of our competitors. Factors that support this
growth include:
• instability in currencies, interest rate and credit markets leading to price volatility and forming the basis for further growth in
interest rate and credit derivatives, FX, commodities and listed financial markets;
• demand for improved operational and capital efficiency for bank and hedge fund traders in these markets;
• use of derivatives to manage efficiently and hedge risk exposure to changes in interest rates and FX, commodity and other price
fluctuations;
• continuing high levels of government and corporate bond issuance as structural change reduces bank lending to corporates;
• reallocation of capital to commoditised “flow” markets and the structural shift away from complex structured products;
• continuing regulatory pressure on financial market participants to overhaul OTC market infrastructure, reducing systemic and
operational risk by improving back office procedures and reducing systemic and counterparty risk;
• clearing of OTC derivatives trades to reduce risk, improve market efficiency and reduce costs;
• increased political pressure for new regulations requiring more electronic trading, improved transparency and higher capital
requirements for OTC trades that are not cleared; and
• continued liberalisation of emerging markets. Economic growth and increasing sophistication are driving growth in onshore and
offshore interest rate, FX and credit markets in these countries.
Competitive environment
We continue to benefit from greater scale and broader diversity than our competitors and have outperformed many of them in
terms of market share. When assessing our available market size we include interdealer broking markets in rates, FX, commodities
(including shipping), emerging markets, credit and equities – together with markets such as post trade risk. Markets like financial
futures remain separate from this broader definition, although ICAP does act as an executing broker in listed futures markets. By our
estimates, overall industry revenue was unchanged in 2010 at $11 billion. On this basis ICAP currently estimates its share of this
market has grown to 23%–25%. Our strategy remains to increase this share to 35%.
Financial markets reform
Significant progress is being made by regulators in proposing changes to financial regulation which aim to strengthen supervision and
market infrastructure. It is clear that there will be a long road to travel as, once the changes have been agreed, implementation of
some aspects is likely to be phased over several years.
Following the publication of the Basel III capital and liquidity reform package as well as the banks’ capital requirements, we expect a
clearer view will now emerge of the potential impact on the operations of banks and their customers as a result of the way their
trading operations (both proprietary and flow) are treated for risk and capital purposes.
Regulators want to lower operational and systemic risk through greater automation and increased transparency of trading
execution. The CFTC has not yet finalised the parameters that would define a Swap Execution Facility, a type of organised trading
venue in the US, but we believe ICAP is well placed to provide sophisticated technology platforms that are fully compliant with the
rules as they are finalised. In Europe, there are positive signs of the EU’s commitment to open, efficient and resilient markets in the
proposed European Market Infrastructure Regulations. The EU’s MiFID II consultation is underway and the proposals are expected to
be released in the second half of 2011.
The regulatory push towards more electronic or hybrid trading of derivatives and central clearing are positive drivers for our sector.
As a leading provider of OTC market infrastructure, ICAP is in a very strong position to work with market participants and lead new
initiatives to address regulatory concerns.
In addition to reducing counterparty risk through the extension of central clearing of eligible derivatives, we believe that there will be
significant continuing demand for bilateral clearing of the many OTC derivatives that are not suitable for central counterparty (CCP)
clearing. Regulators are increasingly aware of the need to build resilience in these markets and ICAP is continuing to work on the
development of automated collateral management networks to streamline the process for both banks and their customers. This
reduces cost, improves efficiency and mitigates risk.
Above all, however, we believe that the many changes proposed will stimulate the banks and market infrastructure providers,
including ICAP, to further technological innovation that will help achieve the objectives of the regulators for more resilient markets,
and thereby create opportunities for building new businesses.
5
Markets
ICAP reports on segments of its business in the same way externally as we manage and report the business internally. The major
segments are the three regions of core voice broking, electronic broking, post trade risk and information and new businesses. New
businesses, comprising new voice broking businesses, have been separated out to allow the appropriate focus given the very
substantial investment that has been undertaken in recent years.
ICAP provided services in a broad range of markets and the diversity of its market coverage is a key strength of the Group. The
revenue and growth rates per market from our continuing operations are given below.
Continuing operations
Markets
2011
Revenue*
£m
2010
Revenue*
£m
Growth
%
Rates 695 630 10
FX 321 292 10
Commodities 213 175 22
Emerging markets 191 141 35
Credit 185 204 (9)
Equities 136 163 (17)
Total 1,741 1,605 8
Segmentalperformance
Core voice broking
Revenue*
£m
Growth
%
Operating
profit*
£m
Growth
%
EMEA 578 1 114 (4)
The Americas 471 2 83 –
Asia Pacific 134 6 (3) n/m
Total 1,183 2 194 (7)
Our voice broking business is active in the wholesale markets in rates, FX, commodities, emerging markets, credit and equities. ICAP’s strategy is
to profitably expand our leading voice broking business by increasing market share.
Revenue* from ICAP’s core voice broking businesses was broadly in line with the prior year despite revenue from Asia Pacific being
adversely impacted by the loss of 38 brokers in September 2010. Revenue growth reflected strong performance of emerging
markets, commodities, and interest rate derivatives, which was offset by slower performances in credit and equity derivatives. In
addition revenue benefited from stronger dollar and euro exchange rates. Operating profit* decreased by 7% and operating profit
margin by 3 percentage points following a number of one-off costs across all segments. However, our continued focus on costs,
together with our new businesses reaching operational maturity, will support operating profit* margin for the voice broking business.
Rates
The interest rate markets have been active during 2010/11 with volume increases seen across the three main products: interest
rate derivatives, government bonds and particularly repurchase agreements (repos). Volatility remained high due to the sovereign
debt crisis in Europe and continuing global high levels of government debt issuance. Within the interest rate derivatives market, the
biggest component of our business in terms of revenue, the euro swaps business and the cross-currency swaps area were the best
performers and ICAP retained its position as the largest broker in these areas. Business was supported by high levels of corporate
bond issuance in EMEA in what is still a very low rate environment.
FX
FX markets remained volatile in both developed and emerging markets resulting in significantly increased volumes in forward
products. The spot FX business market has performed in line with the prior year. The strength of our FX business was evident during
the year as we grew both revenue and market share, particularly in the major currencies.
* From continuing operationsexcluding acquisitionanddisposalcosts andexceptional items.
Commodities
Economic uncertainty has substantially benefited our commodities business specifically trading in oils, coal and natural gas
contributing to record revenue in EMEA. In the US, our electricity and oil businesses continue to perform strongly. We continue to
develop our hybrid trading options for customers with momentum building for ICAPture, our US-focused platform designed to meet
the changing regulatory requirements of the Dodd-Frank Act. With a focus on oils, we are extending ICAP TrueQuote from a post
trade support engine to an interactive execution tool, providing screen-supported voice hybrid execution alongside straight-
through-processing to multiple clearing venues.
ICAP Shipping saw a general improvement in trading conditions and while it recorded a small operating loss we expect investments
made in the current year will position the business to respond to improvements in market conditions.
Emergingmarkets
We have seen a strong increase in both volume and market share in the emerging markets’ rates businesses, specifically central
European interest rate swaps, and have maintained our market leadership in Latin American businesses where we have deep
customer and exchange relationships.
In Asia, market conditions remained highly competitive, with a large number of brokers competing for business in all of our markets.
In September we lost 38 broking staff in Singapore to a competitor and, while we have been actively rehiring, revenue was
adversely impacted in the second half of the year. Over the medium term, we expect substantial growth in the region to come from
China, where we have recently expanded the scope of our joint venture with CFETS and commenced broking renminbi on an
offshore basis.
Credit
Revenue in credit as a whole was down on previous years and we saw a return to more normal markets. Although there was a
reduction in the risk appetite of some our customers, overall market volumes in corporate bond markets remained relatively high.
Tighter spreads however reduced ICAP’s revenue. Against this we saw an increase in CDS revenue driven in particular by strong
growth in index products with increased volumes and an improvement in market share. We expect that potential changes to the
market structure driven by further regulatory change are likely to impact these markets in the coming years. The introduction of
electronic platforms is well advanced in the CDS markets on both sides of the Atlantic.
Equities
Equity derivatives are the main focus of this segment. Proposed regulatory changes, with the threat of increased capital
requirements and reduced proprietary trading put our customers’ margins under pressure. This in turn had two effects; the first was
commission compression for brokers of 20% - 30% and the second, low market volumes, particularly in the first three quarters of
the year. In the first half, our US business performed better by increasing market share. We have successfully kept our teams intact
despite aggressive approaches to key staff by competitors. As a result we were in a good position to benefit in the last quarter of
the year when we saw an increase in market volumes.
Electronic broking
£m
Growth
%
Revenue 302 20
Operating profit* 123 23
ICAP operates the world’s leading electronic trading platforms in the OTC FX and fixed income markets. The platforms offer efficient and
effective trading solutions to customers in more than 50 countries in a range of instruments including spot FX, US Treasuries, European
government bonds and EU and US repo. The platforms are built on our unique networks connecting participants in wholesale financial markets.
ICAP’s strategy is to grow our global electronic broking business both through increasing volumes of existing products and by
developing new markets.
Combined average daily electronic broking volumes for the BrokerTec fixed income platform and EBS spot FX platform for the 12
months ended 31 March 2011 were $778 billion, up 24% from the previous year, with the highest average daily volume of $914.5
billion being achieved.
Electronic broking reported revenue of £302 million, an increase of 20% over the prior year. Operating profit increased by 23% to
£123 million. Despite the substantial revenue growth, operating profit margin increased marginally to 41% reflecting one-off costs
primarily related to the write-down of technology platforms.
ICAP’s demonstrated expertise developing and operating highly transparent and efficient electronic trading solutions positions it well
to benefit from impending regulatory changes in Europe and the US.
To further support its market leading position in a time of heightened competition in electronic trading, ICAP continues to invest in
product development, operations and technology.
* From continuing operations excluding acquisition and disposal costs and exceptional items.
7
Rates
Fixedincome
Trading on the BrokerTec platform was strong with total average daily volumes in US Treasury products, EU repo and US repo at
$627 billion, up 27% on the prior year. Growth in US Treasury products benefited from high levels of issuance and activity in the US
repo markets was particularly strong.
In Europe, electronic trading of European government bonds continued the growth seen in the previous year. From April 2011,
BrokerTec, an official platform in Portugal, secured primary dealer obligations from domestic market participants increasing the
number of EU governments that recognise the use of the BrokerTec platform.
In August 2010, having previously achieved the ability to submit overnight repos to the central clearer, LCH.Clearnet, BrokerTec EU
repo trading was launched in Spain, leading to considerable new customer participation and the capture of considerable business in
term secured funding.
Investment in the BrokerTec platform technology continued throughout the year and was focused on delivering performance
improvements and facilitating enhancements to EU and US trading capabilities. A capital expenditure programme to significantly
upgrade the platform is on track to be completed in the second quarter of 2012.
Interestrates
In September we launched an electronic platform for trading euro IRS with market maker support, bringing increased transparency
and greater efficiency, as well as lower transaction costs to the world’s largest OTC derivative market. This initiative will make a
substantial contribution towards further reducing operational and systemic risks in trading OTC derivatives. Our electronic IRS
platform takes ICAP’s established voice liquidity and combines it with a proven electronic platform to create a single liquidity pool in
a wide range of euro IRS instruments out to 30 years’ maturity. Since its launch, the platform has transacted over €360 billion in
volume involving more than 4,300 trades representing 20% of our euro IRS activity. We continue to see month-on-month increases
in activity and in March 2011, over 30% of our euro IRS trades were transacted on the platform. We plan to expand into dollar IRS
during 2011.
FX
We saw growth in FX activity over the course of the year. Average daily electronic broking volumes on the EBS platform were $151
billion, an 11% year-on-year increase.
The EBS platform continued to demonstrate its role as the FX market’s central source of pricing and liquidity, especially clear, in
moments of heightened volatility.
Over the past year several new order types designed to support manual traders, including the introduction of the first purely
electronic Fix Order were launched. Decimalised pricing on the EBS platform was launched in March 2011.
Increased activity in a diverse range of currency pairs continued and the EBS presence in emerging markets strengthened. In
September 2010, EBS was the first electronic platform to enable trading of Hong Kong cleared Chinese renminbi. March 2011 was
a record month for Commonwealth and emerging markets’ currencies overall, with record monthly trading of the Australian dollar,
Hong Kong cleared Chinese renminbi, Russian rouble and NDFs.
MyTreasury
My Treasury is an electronic money market trading platform for corporate treasury investors launched initially to offer AAA- rated
money market funds and currently being extended to cover term deposits and certificates of deposit.
During a period of fund sector consolidation, the value of funds invested via MyTreasury increased 270% from 2009/10. The
platform has achieved complete offshore fund provider coverage and now offers access to more than 160 fund accounts. The
number of investors using the platform increased by more than 40% year-on-year.
Credit
ICAP has a number of electronic platforms which have been developed to address different aspects of the credit derivatives
markets. ICAP launched the first hybrid electronic and voice platform in Europe in 2004 and the first purely electronic credit trading
application in the US in 2007. The product provides traders with real-time access to the full range of CDS markets, such as the on-
the-run and off-the-run investment grade and high yield CDX indices, including unique support for curves, switches and rolls. ICAP
recently introduced single name CDS instruments to the platform and is rolling out new single-name credit sectors weekly. The
BrokerTec credit platform offers both manual and automated trading to all major banking institutions and has consistently been in
the top three interdealer platforms. More recently, in the US we launched an additional hybrid platform for the credit default index
market.
Institutions in the US are anticipating the implementation of new regulatory requirements and accordingly have shown growing
interest in our electronic credit solutions. CDS trading activity on the BrokerTec platform continues to grow, with steady
participation in the market on a daily basis. It is expected that in the second quarter of 2011 total volumes since launch will surpass
$300 billion. We are well positioned to take advantage of regulatory changes within the credit market, and our trading platforms are
expected be fully compliant.
Post trade risk and information
£m
Growth
%
Revenue 184 30
Operating profit* 79 14
ICAP’s strategy is to develop our post trade risk and information businesses to provide innovative services that enable our customers to reduce
their costs and risks and to increase their efficiency, return on capital and capacity to process trades. The post trade risk and information
segment comprises Traiana and the Portfolio Risk Services businesses – TriOptima, ReMatch and Reset – and the information business.
The post trade risk and information business continued to perform strongly reporting revenue of £184 million, an increase of 30%
on the prior year, while operating profit increased 14% reflecting a combination of the acquisition of TriOptima and higher volumes
in Traiana. These improvements were offset by Reset which saw lower activity levels as a result of benign market conditions during
the first part of the year. A change in the revenue mix, together with the ongoing investment in Traiana and ReMatch, resulted in
operating profit* margin falling from 49% to 43%.
Reset
Reset is the market leading provider for interest rate reset risk management, accounts for the largest proportion of ICAP’s post
trade risk revenue and operating profit*. Reset are experts in short-end risk management and thereby help our customers to control
their fixing risk. The Reset matching engine allows for unilateral matching with hedging, therefore it is no longer necessary for our
customers to have an offsetting position for each trade to be executed. During the first part of the year, Reset saw some slowdown
as short-term interest rates remained low and stable although we saw a pick up in the final quarter as volatility returned to the
LIBOR market. In addition, Reset began to benefit from its newly launched inflation fixing and basis fixing services and will be
launching other new products, including bonds, over the next 12 months.
TriOptima
TriOptima is the provider of OTC derivatives infrastructure services including triReduce and triResolve. TriOptima’s services, aimed
at reducing risk and helping financial institutions to manage their OTC derivative portfolios more efficiently, continue to be well
utilised by the markets. The regulatory environment creates interesting opportunities for TriOptima as our customers focus
significant resources on their new regulatory obligations.
The business has faced a challenging operating environment as regulatory pressure on customers has been focused on maximising
submission to clearing rather than optimising their portfolios through compression. These conditions are expected to be temporary.
TriOptima’s portfolio compression service, triReduce, eliminated $45.8 trillion in IRS notionals in a record 53 cycles and $8.5 trillion
in CDS notionals in a record 95 compression cycles during 2010/11.
TriOptima’s counterparty exposure management service, triResolve, for OTC derivatives, including portfolio reconciliation, margin
call management and dispute resolution, also continued to expand. In October, TriOptima announced that the ‘Big Six’ Canadian
banks had joined the triResolve service. Currently, six million OTC derivative trades from 2,800 legal entities are regularly reconciled
through triResolve. This represents 75% of all non-cleared OTC derivative transactions
Traiana
Traiana, the post trade netting and aggregation service, operates the industry-standard platform, for electronically processing OTC
FX, futures, equities and equity derivatives. Traiana saw strong growth and has continued to expand its offering in new asset classes
to both the buy- and sell- side firms across FX, exchange trade derivatives, equities and equity derivatives. Traiana Harmony now
processes more than US$700 billion in trading volume each day, and connects more than 500 market participants including buy-
side, sell-side, execution venues and ISVs.
In FX, Traiana has continued to see strong revenue growth from existing services and the introduction of new products with daily
trades processed more than doubling year over year, driven by continued growth in volumes from banks and prime brokers,
increasing volumes from high-frequency trading and rising retail FX trading volumes. In addition, Traiana’s trade aggregation joint
venture with CLS Group, CLS Aggregation Service (CLSAS), continued to expand. In December, Traiana and the CLS Group
announced that all eight founding member banks of CLSAS had gone live with the service after adoption in just a year. On 15 March
2011 the CLSAS service processed the highest daily volume recorded so far with over 295,984 gross trades, aggregated to
11,788. Average daily volumes processed through CLSAS in March 2011 were 162,300 with an average compression ratio of
93.8%, from a standing start at the beginning of the year.
In a move to help customers address new regulations, Traiana announced in March that it had launched a new service for the
clearing of OTC FX derivatives, Harmony CCP Connect, with Citi as its first customer and CME Group its first clearing house.
Harmony CCP Connect links Banks and Prime Brokers to clearing houses to comply with global financial reforms in the wake of the
2008 financial crisis, easing the implementation of central clearing mandates for derivatives.
Traiana has also continued to expand the Harmony Network into new asset classes, including contract-for-difference (CFD) equity
swaps and exchange-traded derivatives. Harmony is now the largest CFD equity swap messaging network in the world, and is used
by 12 of the world’s largest equity swap counterparties and over 60 executing brokers. In March 2011, Traiana expanded
Harmony’s CFD equity swaps network to the buy-side and a growing group of buy-side firms have already connected to the
network.
* From continuing operationsexcluding acquisitionanddisposal costs and exceptional items.
9
ReMatch
ReMatch provides market risk mitigation and portfolio rebalancing services to address the problems derived from the build-up of
illiquid, calendar spread, net open positions in CDS portfolios. In the past year it expanded its services to include US financials and
western European sovereign CDS products. ReMatch addresses the problem of minimal or no exit liquidity at the ‘off the run’ points
in a trader’s CDS portfolio, and reduces the market risk created by the build-up of these illiquid positions. Since its launch in October
2009, ReMatch has helped the market reduce a total of $250 billion in CDS trades.
Information
ICAP information empowers customers to make trading decisions with authoritative, independent and consistent OTC market
information, across a range of asset classes. We provide real-time, end-of-day and historical data solutions across our brokered
product range from 32 contributing countries. Our data is the intelligence behind algo trading and research models for customers
and is a key source of mark-to-market data for the industry. This part of our post trade risk and information business is a profitable,
high margin cash generative business with a broad, loyal, global customer base. The business has exhibited strong performance year-
on-year with both revenue and profit growth and employs a subscription-based charging structure which provides a regular revenue
stream.
New businesses
2011
£m
2010
£m
Revenue 72 54
Operating profit* (21) (24)
For 2010/11 the new business segment included the Group’s investment in a number of new initiatives which have been started or acquired
over the past two years. These include Brazil, intellectual property and base metals.
This segment has been reviewed and as a result of the decreasing number of new businesses set-up or established over the past
two financial years, it is planned to discontinue this segment for the year ending 31 March2012.
Brazil
ICAP’s operations in Brazil, with more than 250 brokers and support staff, encompasses three core products: futures (BM&F),
equities (Bovespa) and a retail share trading platform (MyCAP). ICAP saw its market position improve with a near doubling of its
revenue year-on-year and the MyCAP customer base increased to 10,000 accounts.
As a result of our ongoing investment the business was loss making during 2010/11 and this is expected to continue in the year
ahead as we continue to invest albeit at a lower level. We are now the leading independent broker and in the top 10 across all key
product lines amidst a very competitive field of over 60 broker organisations. We have invested significantly in our systems and
infrastructure and have seen encouraging recent growth in direct market access which will provide a key driver for the future.
Basemetals
ICAP is a Category 2 broking member of the London Metals Exchange (LME). The LME business produced strong revenue growth
and is profitable. It gained access to new pools of liquidity by expanding geographically to offer a global service and by broadening its
product offering over the past 12 months, including the new futures mini contract which was launched on the Singapore Exchange
in February 2011, as well as opening a new office in Hong Kong. In future, base metals will be reported as part of the EMEA
commodities segment.
Intellectualproperty
Patents continue to build a strong pipeline of deals and has held a number of auctions making a modest profit. The market growth is
fuelled by smartphone patent wars, corporate bankruptcies and patent litigation risk. We have expanded the business beyond the
traditional markets into automotive and pharmaceutical asset classes both of which offer significant growth opportunities.
Outlook
We have made a good start to the new financial year and the short-term outlook is underpinned by macroeconomic stress and
market volatility. As the banks and our regulators seek to create more resilient, robust and orderly OTC derivatives markets we
believe that ICAP’s business model is well prepared for changes in the financial market infrastructure. Investments in previous years
have created a solid base for future growth and there are significant opportunities to expand the use of the market infrastructure
we have built. We are confident we can deliver sustainable long-term growth.
The Group remains focused on the disciplined execution of our strategy and we have positioned the business for sustained long-
term development. Once again, this year we are concentrating on organic growth and remain committed to developing collaborative
relationships with our bank customers.
* From continuing operationsexcluding acquisitionanddisposalcosts andexceptional items.
Profit for the year
Year ended
31 March
2011
£m
Year ended
31 March
2010
£m
Profit before tax* from continuing operations 350 335
Acquisition and disposal costs (94) (62)
Exceptional Items (23) (26)
Profit before tax from continuing operations (statutory) 233 247
Tax (50) (83)
Profit from continuing operations 183 164
The Group reports a solid performance with profit after tax, acquisition and disposal costs and exceptional items of £183 million from
continuing operations.
Acquisitionanddisposalcosts
For the year commencing 1 April 2010, the Group has redefined the column previously entitled ‘amortisation and impairment of
intangibles arising on consolidation’ having considered the impact of the adoption of IFRS3 (revised) ‘Business Combinations’ to the
consolidated income statement. The Group saw amortisation of intangibles increase by £22 million over the prior year related to the
acquisition of TriOptima.
Exceptionalitemsanddiscontinuedoperations
The Group’s policy is to separately disclose items in its income statement as exceptional which are non-recurring and, in terms of
both size and nature, material.
The Group has recognised an exceptional, pre-tax charge in its continuing business of £23 million in respect of the recoverability of
the loans made to a number of associates active in non-core agency voice markets (£20 million) and an adjustment to the 2010
SEC settlement-related costs (£3 million).
A post-tax credit of £4 million relating to a reversal of a prior year exceptional charge, disclosed as discontinued in 2010/11, was
recognised as an exceptional item relating to the decision to close the European and Asia Pacific full service agency cash equities
businesses in 2009/10.
Tax
The overall objective continues to be to plan and manage the tax affairs of the Group efficiently while complying with local
tax regulations. The Group’s effective tax rate, excluding acquisition and disposal costs, exceptional items and discontinued
operations is 26% (2010 – 32%) which represents maintenance of the underlying rate of 32% less a reduction of 6% in respect of
settling enquires with tax authorities.
A tax credit of £32 million (2010 – £20 million) has been recognised in the consolidated income statement column entitled
‘acquisition and disposal costs’ to reflect the impact of deferred tax on amortising intangible assets.
The Group’s tax charge is affected by the varying tax rates in different jurisdictions applied to taxable profits; the mix of those
profits; and the rules impacting deductibility of certain costs. The Group continues to take a prudent approach to the management
of its tax affairs and provisions are set to cover tax exposures. We expect the Group’s effective tax rate, excluding acquisition and
disposal costs, exceptional items and discontinued operations will be 31% for the financial year ending 31 March 2012.
Earningsandearningspershare(EPS)
We believe that the most appropriate EPS measurement ratio for the Group is adjusted basic EPS as this measure better reflects the
Group’s underlying cash earnings. Adjusted basic EPS from continuing operations excludes the impact of the performance of
acquisition and disposal costs, exceptional items and discontinued operations.
Adjusted basic EPS from continuing operations increased by 13% to 39.9p. The Group’s basic EPS from continuing operations
increased from 25.5p to 28.1p and total basic EPS, including discontinued operations, increased from 18.0p to 28.7p primarily as a
result of a tax credit recognised in the financial year.
Dividend
For the past four years, the Group has paid a dividend equal to 50% of adjusted basic EPS which reflects the board’s desire to
balance distributions to shareholders against the wider capital demands of the Group.
For the current year we propose, subject to shareholder approval, to continue to apply the same multiple which results in a final
dividend of 14.68p being proposed. This compares to 12.44p in the prior year and, when taken in conjunction with the interim
dividend of 5.27p per share, results in a full-year dividend of 19.95p which is an increase of 14% on the prior year.
Interim dividends are calculated as 30% of the previous year’s full-year dividend. This approach is expected to continue for the
2011/12 financial year.
Subject to approval at the annual general meeting, the final dividend will be paid on 19 August 2011 to shareholders on the register
at the close of business on 22 July 2011. The shares will be quoted ex-dividend from 20 July 2011.
* Profitbefore tax, acquisition and disposal costs and exceptional items.
11
Operatingprofit*/cashconversion
The Group continues to generate substantial free cash flow. Over the long term it is expected free cash and post-tax profit will
converge. At 31 March 2011 our free cash flow conversion was 80% against a three year average ongoing free cash conversion of
107% of post-tax profit. This compares to 118% in the prior year as a result of increasing working capital requirements.
Free cash flow
Year ended
31 March
2011
£m
Year ended
31 March
2010
£m
Cash from ongoing operations** 363 390
Interest and tax (86) (69)
Cash flow from ongoing operating activities 277 321
Capital expenditure (69) (66)
Dividends from associates and investments 2 9
Ongoing free cash flow 210 264
Discontinued and exceptional** (21) (46)
Free cash flow 189 218
Cash generated from ongoing operations decreased by £27 million in 2010/11 of which £8 million relates to the change in restricted funds,
£3 million related to higher trading levels, offset by the impact of initially unsettled trades of £38 million.
Net payments in respect of interest and tax have increased by £17 million to £86 million, primarily reflecting the full year impact of
the five-year senior notes.
The Group distributed £90 million of its free cash flow to shareholders through its dividend.
Eventsafterthebalancesheetdate
On 8 April 2011, the FSA approved the Group’s application to renew its waiver from investment firm consolidation for a further five
years.
* From continuing operationsexcludingacquisition anddisposal costs and exceptional items.
** Cash from operationsdisclosedin the consolidated cash flowstatement consists of cash from ongoing operationsplusdiscontinued andexceptional.
Consolidated income statement
Year ended 31 March 2011
1
Note
Before
acquisitionand
disposalcosts
andexceptional
items
£m
Acquisitionand
disposalcosts*
£m
Exceptionalitems
(note5)
£m
Total
£m
Continuingoperations
Revenue 1 1,741 – – 1,741
Operatingexpenses 6 (1,387) (88) (3) (1,478)
Otherincome 21 – – 21
Operatingprofit 1 375 (88) (3) 284
Financeincome 5 – – 5
Financecosts (33) – (20) (53)
Shareofprofit/(loss)ofassociatesaftertax 1 3 (6) – (3)
Profitbeforetaxfromcontinuingoperations 350 (94) (23) 233
Tax 4 (90) 32 8 (50)
Profitfortheyearfromcontinuingoperations 260 (62) (15) 183
Profitfortheyearfromdiscontinuedoperations – – 4 4
Profitfortheyear 260 (62) (11) 187
Attributableto:
OwnersoftheCompany 260 (62) (11) 187
Non-controllinginterests – – – –
260 (62) (11) 187
Earningsperordinarysharefromcontinuing
operations
–basic 2(b) 28.1
–diluted 2(b) 27.6
Earningsperordinarysharefromtotaloperations
–basic 2(a) 28.7
–diluted 2(a) 28.2
*Seebasisof preparationfor changeof definition to the column nowentitled‘acquisition anddisposal costs’.
Consolidated income statement
Year ended 31 March 2010
2
Note
Before
acquisitionand
disposalcosts
andexceptional
items*
£m
Acquisitionand
disposalcosts*
£m
Exceptionalitems
(note5)
£m
Total
£m
Continuingoperations
Revenue 1 1,605 – – 1,605
Operatingexpenses 6 (1,270) (61) (26) (1,357)
Otherincome 19 – – 19
Operatingprofit 1 354 (61) (26) 267
Financeincome 7 – – 7
Financecosts (33) (2) – (35)
Shareofprofitofassociatesaftertax 1 7 1 – 8
Profitbeforetaxfromcontinuingoperations 335 (62) (26) 247
Tax 4 (107) 20 4 (83)
Profitfortheyearfromcontinuingoperations 228 (42) (22) 164
Lossfortheyearfromdiscontinuedoperations (18) – (30) (48)
Profitfortheyear 210 (42) (52) 116
Attributableto:
OwnersoftheCompany 210 (42) (52) 116
Non-controllinginterests – – – –
210 (42) (52) 116
Earningsperordinarysharefromcontinuing
operations
–basic 2(b) 25.5p
–diluted 2(b) 25.1p
Earningsperordinarysharefromtotaloperations
–basic 2(a) 18.0p
–diluted 2(a) 17.7p
*The comparative resultshave beenre-presented for the change in the definitionof the column nowentitled ‘acquisition and disposal costs’. The net impactof thischange has been to
reallocate £2m from finance costs in the first column to ‘acquisitionand disposal costs’ (see basis of preparation fordetailsof change in definition).
Consolidated and Company balance sheet
3
Group Company
Note
Asat
31March
2011
£m
Asat
31March
2010
£m
Asat
31March
2011
£m
Asat
31March
2010
£m
Assets
Non-currentassets
Intangibleassetsarisingonconsolidation 1,358 1,489 – –
Intangibleassetsarisingfromdevelopment
expenditure 63 72 – –
Propertyandequipment 87 68 – –
Investmentinsubsidiaries – – 1,989 1,989
Investmentinjointventures – – 1 1
Investmentinassociates 31 30 – –
Deferredtaxassets 4 17 34 – –
Tradeandotherreceivables 14 35 – –
Available-for-saleinvestments 30 27 – –
1,600 1,755 1,990 1,990
Currentassets
Tradeandotherreceivables 74,693 60,101 40 36
Available-for-saleinvestments 1 1 – –
Restrictedfunds 7(c) 73 81 – –
Cashandcashequivalents 7(c) 404 423 – –
75,171 60,606 40 36
Totalassets 76,771 62,361 2,030 2,026
Liabilities
Currentliabilities
Tradeandotherpayables (74,634) (60,098) (89) (660)
Borrowings 8(b) (183) (257) – (40)
Taxpayable (119) (100) – –
Provisions (2) (36) – –
(74,938) (60,491) (89) (700)
Non-currentliabilities
Tradeandotherpayables (29) (30) (140) (140)
Borrowings 8(a) (382) (395) – –
Deferredtaxliabilities 4 (117) (174) – –
Retirementbenefitobligations (1) (1) – –
Provisions (53) (55) – –
(582) (655) (140) (140)
Totalliabilities (75,520) (61,146) (229) (840)
Netassets 1,251 1,215 1,801 1,186
Equity
Capitalandreserves
Calledupsharecapital 66 66 66 66
Sharepremiumaccount 452 425 452 425
Otherreserves 75 71 1 1
Translation 73 138 – –
Retainedearnings 565 498 1,282 694
EquityattributabletoownersoftheCompany 1,231 1,198 1,801 1,186
Non-controllinginterests 20 17 – –
Totalequity 1,251 1,215 1,801 1,186
Approved by the board on 18 May 2011 and signed on its behalf by:
MichaelSpencer IainTorrens
Group Chief Executive Officer Group Finance Director
Consolidated and Company statement of cash flow
4
Group Company
Note
Yearended
31March
2011
£m
Yearended
31March
2010
£m
Yearended
31March
2011
£m
Yearended
31March
2010
£m
Cashflowsfromoperatingactivities 7(a) 256 275 – –
Cashflowsfrominvestingactivities
Investmentsinsubsidiaries – – – (34)
Dividendsreceivedfromassociates – 7 – –
Otherequitydividendsreceived 2 2 – –
Paymentstoacquirepropertyandequipment (45) (17) – –
Intangibledevelopmentexpenditure (24) (49) – –
Net(payments)/receiptsonavailable-for-sale
investments (1) 14 – –
Acquisitionofinterestsinbusinessesnetofcash
acquired (27) (147) – –
Acquisitionofassociatesandjointventures (2) (2) – –
Netcashflowsfrominvestingactivities (97) (192) – (34)
Cashflowsfromfinancingactivities
Proceedsfromissueofordinaryshares – – – 3
Proceedsfromexerciseofshareoptions 2 – 2 5
Proceedsfromissuesofordinarysharestonon-
controllinginterest 1 – – –
DividendspaidtoownersoftheCompany (90) (92) (90) (92)
PaymentstoacquireTreasuryShares (8) – (8) –
Receipts/(payments)toacquireownsharesfor
employeesharetrusts* 4 (2) – –
Loanstoemployeebenefittrusttoacquirenew
shares – – – (7)
Repaymentofborrowings (377) (488) (40) –
Fundsreceivedfromborrowing,netoffees 305 591 – 40
Netreceiptsfromsubsidiaries – – 136 85
Netcashflowsfromfinancingactivities (163) 9 – 34
FXadjustments (15) (8) – –
Net(decrease)/increaseincashandcash
equivalents (19) 84 – –
Cashandcashequivalentsatbeginningoftheyear 7(c) 423 339 – –
Cashandcashequivalentsatendoftheyear 7(c) 404 423 – –
*Paymentsto acquireown sharesforemployee share trustsisshown net of£4m (2010 – £5m) of contributionsreceived from participants in the trusts.
Basis of preparation
5
Preparationoffinancialstatements
The financial statements have been prepared in accordance with IFRS adopted by the EU, IFRIC interpretations and with those parts of the
Companies Act applicable to companies reporting under IFRS and therefore comply with Article 4 of the EU IAS Regulation. The financial
statements have also been prepared under the historical cost convention, as modified to include the fair value of certain financial
instruments in accordance with IFRS. The financial statements are prepared in pound sterling, which is the functional currency of the
Company and presented in millions.
The significant accounting policies adopted by the Group and Company are included at the front of the notes to which they relate.
The preparation of financial statements requires management to make judgements, estimates and assumptions that affect the reported
amounts of assets, liabilities, income and expenses. Management consider goodwill and tax (note 4) to be the areas where increased
judgement is required. Due to the inherent uncertainty in making estimates, actual results reported in future periods may be based on
amounts which differ from those estimates. Judgements, estimates and assumptions are continuously evaluated and are based on
historical experience and other factors, including expectations of future events that are believed to be reasonable under the circumstances.
Revisions to accounting estimates are recognised in the period in which the estimate is revised and in any future periods affected.
This set of financial statements are the first in which the Group has presented the notes in an order that reflects management’s view of the
importance of information contained in the notes to the performance and position of the Group for the year ended 31 March 2011.
Presentationoftheincomestatement
The Group maintains a columnar format for the presentation of its consolidated income statement. The columnar format enables the
Group to continue its practice of improving the understanding of its results by presenting profit for the year before acquisition and disposal
costs and exceptional items. This is the profit measure used to calculate adjusted EPS (note 2) and is considered to be the most
appropriate as it better reflects the Group’s underlying cash earnings. Profit before acquisition and disposal costs and exceptional items are
reconciled to profit before tax on the face of the consolidated income statement.
For the financial year commencing 1 April 2010, and for future periods, the Group has redefined the column previously entitled
‘amortisation and impairment of intangibles arising on consolidation’ having considered the impact of the adoption of IFRS3 (revised)
‘Business Combinations’ (effective for the Group from 1 April 2010) to the consolidated income statement. This column has accordingly
been renamed as ‘acquisition and disposal costs’ and will include: any re-measurement after initial recognition of deferred contingent
consideration which has been classified as a liability; any gains or losses on the revaluation of previous interests; any gains or losses on the
disposal of investments, associates or subsidiaries; and costs associated with a combination that do not constitute fees relating to the
arrangement of financing. The column may also include items such as gains or losses on the settlement of pre-existing relationships with
acquired businesses and the re-measurement of liabilities that are above the value of indemnification. To take into account the
aforementioned changes the Group has also moved the impact of the unwind of the discounting of deferred contingent consideration into
this column. Accordingly, the comparative consolidated income statement has been re-presented within the financial statements. For the
year ending 31 March 2010 acquisition and disposal costs have increased by £2m from £40m to £42m. The column will continue to
include the amortisation and impairment of intangible assets arising on consolidation. Each of the items reported under the acquisition and
disposal column will be excluded from the calculation of adjusted basic EPS and adjusted diluted EPS (note 2). The Group believes this
change will help to improve users of the financial statements understanding of the underlying results.
Items which are of a non-recurring nature and material, when considering both size and nature, are disclosed separately to give a clearer
presentation of the Group’s results. These are shown as ‘exceptional items’ on the face of the consolidated income statement together
with any adjustments to prior period exceptional items.
On the face of the consolidated income statement, basic and diluted EPS from continuing operations have also been disclosed. This enables
the Group to provide clarity of the EPS of the continuing core business. The prior period basic and adjusted EPS have been re-presented to
reflect the change in definition of the column ‘acquisition and disposal costs’ resulting in an increase in the adjusted diluted EPS of 0.3p.
The Company has taken advantage of section 408 of the Companies Act not to present its own income statement and statement of
comprehensive income.
Presentationofthebalancesheet
As part of the Group’s brokerage activities in matched principal and exchange traded markets, the Group is required to hold a mix of cash,
cash equivalents and other securities with those institutions which provide it with clearing and settlement services. Balances represent
deposits held with a clearer. The Group has traditionally accounted for the cash elements of these balances as cash and cash equivalents on
the basis that the nature of the Group’s business model, which does not involve it taking proprietary positions, does not put the balances at
risk. However, following a review undertaken in 2010/11 it was determined that the balances could not be withdrawn on a same day basis
and, as such, failed to meet the definition contained in IAS7 ‘Statement of Cash Flows’ for cash and cash equivalents and it was therefore
concluded that these balances should be separately identified on the face of the consolidated balance sheet and separately identified within
the consolidated statement of cash flow under cash from operations. The impact of re-presenting the balance results in a decrease in cash
of £81m in the prior year and increased restricted funds by the same amount. There is no impact to total current assets.
Basis of preparation
continued
6
Basisofconsolidation
The Group’s consolidated financial statements include the results and net assets of the Company, its subsidiaries and the Group’s share of
joint ventures and associates.
An entity is regarded as a subsidiary if the Group has control over its strategic, operating and financial policies and intends to hold the
investment on a long-term basis for the purpose of securing a contribution to the Group’s activities.
The results of companies acquired during the year are included in the Group’s results from the effective date of acquisition. The results of
companies disposed of during the year are included up to the effective date of disposal.
The Group treats transactions with non-controlling interests as transactions with equity owners of the Group. For purchases from non-
controlling interests, the difference between any consideration paid and the relevant share acquired of the carrying value of net assets of
the subsidiary is recorded in equity. Gains or losses on disposals to non-controlling interests are also recorded in equity.
Intercompany transactions, balances and unrealised gains on transactions between Group companies (the Company and its subsidiaries)
are eliminated as part of the consolidation process. Unrealised losses are also eliminated unless the transaction provides evidence of an
impairment of the asset transferred.
A joint venture is an entity in which the Group has an interest and, in the opinion of the directors, exercises joint control over its operating
and financial policies. An interest exists where an investment is held on a long-term basis for the purpose of securing a contribution to the
Group’s activities. Joint ventures are proportionately consolidated, whereby the Group’s consolidated income statement and balance sheet
include the Group’s share of the income and assets on a line-by-line basis.
An associate is an entity in which the Group has an interest and, in the opinion of the directors, can exercise significant influence, but not
control, over its operating and financial policies. An interest exists where an investment is held on a long-term basis for the purpose of
securing a contribution to the Group’s activities. Significant influence generally exists where the Group holds more than 20% and less than
50% of the shareholders’ voting rights.
Associates are accounted for under the equity method whereby the Group’s consolidated income statement includes its share of their
profits and losses and the Group’s consolidated balance sheet includes its share of their net assets.
Foreigncurrencies
In individual entities, transactions denominated in foreign currencies are recorded at the prior month closing exchange rate between the
functional currency and the foreign currency. At each end of the reporting period, monetary assets and liabilities that are denominated in
foreign currencies are retranslated at the rates prevailing at the end of the reporting period. Exchange differences are recognised in the
consolidated income statement, except for exchange differences arising on non-monetary assets and liabilities where these form part of
the net investment of an overseas business or are designated as hedges of a net investment or cash flow and, therefore, the changes in
value are recognised directly in other comprehensive income. Non-monetary assets and liabilities carried at fair value that are denominated
in foreign currencies are translated at the rates prevailing at the date when the fair value was determined.
On consolidation, the results of businesses with non-pound sterling functional currencies are translated into the presentational currency of
the Group at the average exchange rates for the period where these approximate to the rate at the date of the transactions. Assets and
liabilities of overseas businesses are translated into the presentational currency of the Group at the exchange rate prevailing at the end of
the reporting period. Exchange differences arising are recognised within other comprehensive income. Cumulative translation differences
arising after the transition to IFRS are taken to the consolidated income statement on disposal of the net investment.
Goodwill and fair value adjustments arising onthe acquisition ofa non-poundsterling entityare treated asassets and liabilities ofthatentity and
translatedintothe presentationalcurrency ofthe Groupattheperiod closing rate.Whereapplicable, the Group haselected to treat goodwill
and fair valueadjustmentsarising beforethedate oftransitiontoIFRSas denominatedinthe presentationalcurrency oftheGroup.
In the consolidated statement of cash flows, cash flows denominated in foreign currencies are translated into the presentational currency
of the Group at the average exchange rate for the year or at the rate prevailing at the time of the transaction where more appropriate.
Recentaccountingdevelopments
The following new standards and amendments to standards are mandatory for the first time for the financial year beginning 1 April 2010
and are considered relevant to the Group.
− IFRS3 (revised), ‘Business Combinations’ and consequential amendments to IAS27, ‘Consolidated and Separate Financial
Statements’, IAS28, ‘Investments in Associates’, and IAS31, ‘Interests in Joint Ventures’. These changes apply to the Group
prospectively for business combinations enacted on or after 1 April 2010. The revised standard continues to apply the
acquisition method to business combinations, with some significant changes. For example, all payments to purchase a
business are recorded at fair value at the acquisition date, with contingent payments classed as debt subsequently
remeasured through the consolidated income statement. There is a choice on an acquisition-by-acquisition basis to measure
the non-controlling interest in the acquiree either at fair value or at the non-controlling interest’s proportionate share of the
acquiree’s net assets. All acquisition-related costs should be expensed. The Group expects that the impact on results will
depend on the nature of transactions undertaken by the Group. Contingent deferred consideration payable arising from
acquisitions enacted before 1 April 2010 will be remeasured in accordance with IFRS3 as movements to goodwill and not
through the consolidated income statement as required by IFRS3 (revised).
Basis of preparation
continued
7
Recentaccountingdevelopments-continued
− The amendments to IAS27 have also resulted in changes to the Group’s accounting policies. Previously transactions with non-
controlling interests were treated as transactions with parties external to the Group. Disposals therefore resulted in gains or
losses in the consolidated income statement and purchases resulted in the recognition of goodwill. On disposal or partial
disposal, a proportionate interest in reserves attributable to the subsidiary was reclassified to the consolidated income
statement or directly to retained earnings. Previously, when the Group ceased to have control or significant influence over an
entity, the carrying amount of the investment at the date control or date when significant influence was lost, became its cost
for the purposes of subsequently accounting for the retained interests as associates, jointly controlled entities or financial
assets. The Group has applied the new policy prospectively to transactions occurring on or after 1 April 2010. As a
consequence, no adjustments were necessary to any of the amounts previously recognised in the consolidated financial
statements.
A number of other interpretations and amendments to existing standards have been made by the IASB and IFRIC but are not considered
relevant to the Group’s operations.
The following new standards and amendments to standards and interpretations have been issued, but are not effective for the financial
year beginning 1 April 2010 and have not been early adopted:
− Revised IAS24 ‘Related Party Disclosures’ was issued in November 2009 and is required to be applied for accounting periods
on or after 1 January 2011. It supersedes IAS24 ‘Related Party Disclosures’ issued in 2003. The impact of the adoption of
the standard will result in minor changes to the disclosure.
− IFRS9 ‘Financial Instruments’ addresses clarification and measurement of financial assets, as the first phase of the
replacement of IAS39 ‘Financial Instruments: Recognition and Measurement’ and is effective for annual periods beginning
after 1 January 2013, subject to EU endorsement. The impact on the Group’s financial statements of the future adoption of
the standard is still under review.
Financialriskmanagement
The Group operates internationally and is exposed to a variety of financial risks including currency, interest rate, market price, liquidity and
credit.
The Group’s overall financial risk management programme focuses on the unpredictability of financial markets and seeks to minimise
potential adverse effects on the Group’s financial performance by using derivative instruments to lower funding costs, alter interest rate
exposures arising as a result of mismatches between assets and liabilities or to achieve greater certainty of future costs. The use of
derivatives forms part of the Group’s overall risk management framework as determined by the board through the Group risk and capital
committee (GRACC).
The Group’s funding and exposure to interest rate and FX rate risk are managed by the Group’s treasury function in accordance with a
policy framework approved by the GRACC. The framework lays out the Group’s appetite for risk and the steps to be taken to manage
these risks. The GRACC receives bi-monthly reports on the activities of the treasury function and is also responsible for approving
significant transactions such as new financing arrangements or changes to the Group’s hedging strategy. The GRACC sets and monitors
treasury’s counterparty limits in conjunction with the risk team.
The Group’s exposure to market price risk arises mainly through counterparties to matched principal and exchange traded transactions
failing to fulfil their obligations or through trade mismatches and other errors. In matched principal transactions, the Group acts as an
intermediary by serving as counterparty for identified buyers and sellers in matching, in whole or in part, reciprocal back-to-back trades. In
order to facilitate customer transactions and provide liquidity, the Group may participate in certain marketplaces by posting quotations. On
occasion, the act of posting quotations in pursuit of customer orders can result in the Group becoming principal to unmatched trades. In
exchange traded transactions, the Group executes the trade as principal and then novates the contract to its client. A failure by the client
to accept the trade would result in the Group becoming exposed to market price risk.
The market risk the Group faces in these situations is restricted to short-term price movements in the underlying instrument temporarily
held by the Group and movements in FX rates. Any such market price risk arising is identified, monitored and reported to senior
management on a daily basis and to the GRACC. Policies and procedures are in place to reduce the likelihood of such trade mismatches and,
in the event that they arise, the Group’s policy is to liquidate or hedge and liquidate these principal positions as soon as reasonably
practicable.
The Company is not exposed to market price risk as it holds no listed investments, and has no trading activity.
Notes to the financial statements
8
1 Segmentalinformation
The Group has determined its operating segments based on the management information reviewed on a regular basis by the Company’s
board. The Group considers the executive members of the Company’s board to be the Chief Operating Decision Maker (CODM).
The CODMcurrentlyconsiders the businessto consist ofcore and new business elements,although expects the new business segment tobe
incorporated into core next year. Thecorebusiness consists ofregional voicebrokerage businesses inEMEA, the Americasand AsiaPacific, a
globalelectronic brokeragebusiness active in fixedincome interest ratederivatives and FXmarkets anda globalposttrade risk and information
business. Eachofthese fivebusiness areasare managed and reviewedby the CODM ona stand-alone basisand,as such,are considered
segments. Inaddition,the CODMseparately manages and reviewsa portfolioof new business initiatives,currently comprising new voice
broking businesses,whichwere eitheracquired orstartedduring thecourse ofthe pasttwo financialyears. TheGroup reviewsthecomposition
ofthe operating segments at thebeginning of eachfiscalyearto determine whetherthey remainappropriate. Anychanges wouldresultin
restatement ofthe figures reported inthe prior year forcomparative purposes.
Revenue comprises commission from the Group’s core voice business, brokerage or access fees from its electronic business and fees from
the provision of post trade risk and information.
Corevoicebroking
Matched principal and stock lending business
Certain Group companies are involved in a non-advisory capacity as principals in the matched purchase and sale of securities and other
financial instruments between our customers. Revenue is generated from the difference between the purchase and sale proceeds and is
recognised in full at the time of the commitment by our customers to sell and purchase the security or financial instrument. The revenue
generated by the stock lending business is not material to the Group.
Agency business (name give-up transactions)
The Group acts in a non-advisory capacity to match buyers and sellers of financial instruments and raises invoices for the service provided.
The Group does not act as principal in name give-up transactions and only receives and transmits orders between counterparties. Revenue
is stated net of rebates and discounts, value added tax and other sales taxes and is recognised in full on the date of the trade. Amounts
receivable at the year end are reported as other trade receivables within trade and other receivables.
For the shipbroking business, the Group acts in a non-advisory capacity to match buyers and sellers of services and recognises revenue, net
of rebates and discounts, value added tax and other sales taxes when the Group has a contractual entitlement to commission, normally the
point at which there is a completion of contractual terms between the principals of a transaction. Amounts receivable at the year end are
reported as other trade receivables within trade and other receivables.
Execution on exchange business
TheGroupalsoactsasabrokerofexchangelistedproducts,wheretheGroupexecutescustomerordersasprincipalandthennovatesthetradeto
theunderlyingcustomers’respectiveclearingbrokerforsettlement.Revenueisgeneratedfromeitherthedifferencebetweenthepurchaseand
saleproceedsorbyinvoice,dependingontheproduct,marketandagreementsinplacewiththecustomerandisrecognisedonthetradedate.
Electronicbroking
The Group acts as a broker for FX, interest rate derivatives, fixed income products and CDS through the Group’s electronic platforms.
Revenue is generated from brokerage fees which are dependent on the customer's global coverage and average trading volumes. The
Group also charges fees to use the electronic trading platform for access to liquidity in the FX or precious metal markets.
Posttraderiskandinformation
The Group receives fees from the sale of financial information and provision of post trade risk and information to third parties. These are
stated net of value added tax, rebates and other sales taxes and recognised in revenue on an accruals basis to match the provision of the
service. Amounts receivable at the year end are reported as other trade receivables within trade and other receivables.
Reorganisationofportfolio
The new business segment principally consists of Brazil, intellectual property, base metals, UK and Asia financial futures. Fortheperiod
commencing1April2010,LinkandICAPShippinghavebeenmovedoutofthenewbusinesssegmentastheyarenolongernewtotheGroup.
Linkhasbeensplitbetweeneachofthethreecorevoicesegments.ICAPShippingisnowincludedwithinEMEAvoicebroking.Comparativeshave
beenre-presentedtoshowtheimpact.EachoftheoperatingsegmentsoftheGroupismanagedonaday-to-daybasisbyoneormoremembers
oftheGEMG,whichconsistsofbothmembersoftheboardandotherseniormanagement.Themanagementofnewbusinessesisdependenton
whichcoreareathebusinesswilleventuallybecomepartof.TriOptima,acquiredon24March2010,isincludedwithinposttraderiskand
informationandnotasanewbusiness,astheGroupheldaminorityinterestpriortotheacquisitionandhashadasignificantinfluenceoverthe
businesssinceinception.
As a result of the decreasing number of new businesses set-up or established over the past two financial years, it is planned to discontinue
the new business segment for the year ending 31 March 2012 and instead to combine the initiatives into the segment operated by the
appropriate member of the GEMG. The decision to no longer report the new business segment reflects management’s decision 12 months
ago to focus on organic expansion and developing partnerships with customers. This has resulted in a low level of new business initiatives
which do not otherwise meet the criteria to be reported under the core segments. No longer presenting new businesses separately will
result in the other segments initially showing lower margins while businesses such as Brazil move towards operational maturity.
Notes to the financial statements
continued
9
1 Segmentalinformationcontinued
The Group continues to disclose an operating segment for the voice broking business in Asia Pacific even though this segment does not meet
the quantitative thresholds to be mandatory under IFRS8 ‘Operating Segments’. This is to reflect the importance of the Asia Pacific region to the
Group and the way the segment is managed.
Yearended31March2011
Corevoicebroking
EMEA
£m
Americas
£m
AsiaPacific
£m
Electronic
broking
£m
Posttrade
riskand
information
£m
New
businesses
£m
Total
£m
Continuingoperations
Revenue 578 471 134 302 184 72 1,741
Operatingprofitbeforeacquisitionand
disposalcostsandexceptionalitems 114 83 (3) 123 79 (21) 375
Reconciliationtotheconsolidated
incomestatement:
Acquisitionanddisposalcosts (88)
Exceptionalitems (3)
Operatingprofit 284
Financeincome 5
Financecosts (53)
Shareoflossofassociatesaftertax (3)
Profitbeforetaxfromcontinuingoperations 233
Tax (50)
Profitfortheyearfromcontinuing
operations 183
Profitaftertaxfromdiscontinuedoperations 4
Profitfortheyear 187
Details of total gross debt and total cash reviewed by the CODM can be found in notes 8(c) and 7(c) respectively.
Yearended31March2010
Corevoicebroking
EMEA
£m
Americas
£m
AsiaPacific
£m
Electronic
broking
£m
Posttrade
riskand
information
£m
New
businesses
£m
Total
£m
Continuingoperations
Revenue 570 460 127 252 142 54 1,605
Operatingprofitbeforeacquisitionand
disposalcostsandexceptionalitems 119 83 7 100 69 (24) 354
Reconciliationtotheconsolidatedincome
statement:
Acquisitionanddisposalcosts (61)
Exceptionalitems (26)
Operatingprofit 267
Financeincome 7
Financecosts (35)
Shareofprofitofassociatesaftertax 8
Profitbeforetaxfromcontinuing
operations 247
Tax (83)
Profitfortheyearfromcontinuing
operations 164
Lossaftertaxfromdiscontinued
operations (48)
Profitfortheyear 116
Notes to the financial statements
continued
10
1 Segmentalinformationcontinued
Revenue earned by product type from continuing operations is disclosed below:
Yearended
31March
2011
£m
Yearended
31March
2010
£m
Rates 695 630
FX 321 292
Commodities 213 175
Emergingmarkets 191 141
Credit 185 204
Equities 136 163
Totalrevenue 1,741 1,605
The Group did not earn more than 10% of its total revenue from any individual customer.
The Group earned revenue of £602m (2010 – £581m) and £637m (2010 – £594m) from entities in the UK and US respectively. The
remainder of £502m (2010 – £430m) came from various entities from outside the UK and US.
The amortisation and impairment arising from development expenditure recognised by the Group on a segment basis is as follows: core
voice broking EMEA £7m (2010 – £6m), core voice broking the Americas £15m (2010 – £13m), core voice broking Asia Pacific £nil
(2010 – £nil), electronic broking £3m (2010 – £1m), post trade risk and information £4m (2010 – £2m) and new businesses £nil
(2010 – £1m).
The depreciation of property and equipment recognised by the Group on a segment basis is as follows: core voice broking EMEA £10m
(2010 – £7m), core voice broking the Americas £9m (2010 – £8m), core voice broking Asia Pacific £2m (2010 – £2m), electronic
broking £2m (2010 – £3m), post trade risk and information £1m (2010 – £1m) and new businesses £1m (2010 – £1m).
2 Earningspershare
The Group presents basic and diluted EPS data for its ordinary shares. Basic EPS is calculated by dividing the profit or loss attributable to
ordinary shareholders of the Company by the weighted average number of ordinary shares outstanding during the year, adjusted for own
shares held. The Group also calculates adjusted EPS from the adjusted profit which is defined as profit from operations before the effect of
acquisition and disposal costs and exceptional items. The Group believes that this is the most appropriate measurement since it better
reflects the business’s underlying cash earnings.
The Group is required to disclose basic and diluted EPS on the face of the consolidated income statement and has further analysed this to
show the adjusted EPS for continuing operations.
The weighted average number of ordinary shares in issue excludes the weighted average number of shares held as Treasury Shares of 4m
(2010 – 2m) and those owned by employee share trusts relating to employee share schemes on which dividends have been waived, being
6m shares (2010 – 9m).
The Group has also disclosed the impact of discontinued operations on the basic, diluted and adjusted EPS.
Notes to the financial statements
continued
11
2 Earningspersharecontinued
(a)EPSrelatingtotheGroup’stotaloperations
Yearended31March2011 Yearended31March2010
Basicanddiluted
Earnings
£m
Shares
millions
Earnings
pershare
pence
Earnings
£m
Shares
millions
Earnings
pershare
pence
Basic 187 652 28.7 116 643 18.0
Dilutiveeffectofshareoptions – 10 (0.5) – 11 (0.3)
Dilutedbasic 187 662 28.2 116 654 17.7
Yearended31March2011 Yearended31March2010*
Adjustedbasicanddiluted
Earnings
£m
Shares
millions
Earnings
pershare
pence
Earnings
£m
Shares
millions
Earnings
pershare
pence
Basic 187 652 28.7 116 643 18.0
Acquisitionanddisposalcosts 62 – 9.5 42 – 6.5
Exceptionalitemsnetoftax(note5) 11 – 1.7 52 – 8.1
Adjustedbasic 260 652 39.9 210 643 32.6
Dilutiveeffectofshareoptions – 10 (0.6) – 11 (0.5)
Adjusteddiluted 260 662 39.3 210 654 32.1
*Adjusted basic anddiluted EPS havebeen re-presentedto reflect the changein definitionofthe column‘acquisition and disposal costs’inthe consolidatedincome statement.
(b)EPSrelatingtotheGroup’scontinuingoperations
Yearended31March2011 Yearended31March2010
Basicanddiluted
Earnings
£m
Shares
millions
Earnings
pershare
pence
Earnings
£m
Shares
millions
Earnings
pershare
pence
Basic 183 652 28.1 164 643 25.5
Dilutiveeffectofshareoptions – 10 (0.5) – 11 (0.4)
Dilutedbasic 183 662 27.6 164 654 25.1
Yearended31March2011 Yearended31March2010*
Adjustedbasicanddiluted
Earnings
£m
Shares
millions
Earnings
pershare
pence
Earnings
£m
Shares
millions
Earnings
pershare
pence
Basic 183 652 28.1 164 643 25.5
Acquisitionanddisposalcosts 62 – 9.5 42 – 6.5
Exceptionalitemsnetoftax(note5) 15 – 2.3 22 – 3.4
Adjustedbasic 260 652 39.9 228 643 35.4
Dilutiveeffectofshareoptions – 10 (0.6) – 11 (0.5)
Adjusteddiluted 260 662 39.3 228 654 34.9
*Adjusted basic anddiluted EPS havebeen re-presentedto reflect the changein definitionofthe column‘acquisition and disposal costs’inthe consolidatedincome statement.
Notes to the financial statements
continued
12
2 Earningspersharecontinued
(c)EPSrelatingtotheGroup’sdiscontinuedoperations
Yearended31March2011 Yearended31March2010
Basicanddiluted
Earnings
£m
Shares
millions
Earnings
pershare
pence
Earnings
£m
Shares
millions
Earnings
pershare
pence
Basic 4 652 0.6 (48) 643 (7.5)
Dilutiveeffectofshareoptions – 10 – – 11 0.1
Dilutedbasic 4 662 0.6 (48) 654 (7.4)
Yearended31March2011 Yearended31March2010
Adjustedbasicanddiluted
Earnings
£m
Shares
millions
Earnings
pershare
pence
Earnings
£m
Shares
millions
Earnings
pershare
pence
Basic 4 652 0.6 (48) 643 (7.5)
Exceptionalitemsnetoftax(note5) (4) – (0.6) 30 – 4.7
Adjustedbasic – 652 – (18) 643 (2.8)
Dilutiveeffectofshareoptions – 10 – – 11 –
Adjusteddiluted – 662 – (18) 654 (2.8)
3 Dividendspayable
The Company recognises the final dividend payable only when it has been approved by the shareholders of the Company in a general
meeting. The interim dividend is recognised when the amount due has been paid.
Amountsrecognisedasdistributionstoequityholdersintheyear:
Yearended
31March
2011
£m
Yearended
31March
2010
£m
Finaldividendfortheyearended31March2010of12.44pperordinaryshare(2009–12.35p) 81 79
Interimdividendfortheyearended31March2011of5.27pperordinaryshare(2010–5.11p) 34 33
Totaldividendrecognisedinyear 115 112
The final dividend for the year ended 31 March 2010 was satisfied with a cash payment of £56m and a scrip dividend of 6,267,039 ICAP
ordinary shares issued at £3.985 (value £25m).
The directors have proposed a final dividend of 14.68p per share for the year ended 31 March 2011. This has not been recognised as a
liability of the Group at the year end as it has not yet been approved by shareholders. Based on the number of shares in issue at the year
end, the total amount payable would be £96m.
No scrip dividend alternative was offered in relation to the interim dividend for the year ended 31 March 2011.
The right to receive dividends has been waived in respect of the shares held in employee share trusts and no dividend is payable on
Treasury Shares.
Notes to the financial statements
continued
13
4 Tax
Tax on the profit for the year comprises both current and deferred tax as well as adjustments in respect of prior years. Tax is charged or
credited to the consolidated income statement, except when it relates to items charged or credited to other comprehensive income or
directly to equity, in which case the tax is also included in other comprehensive income or directly within equity, respectively.
Current tax is the expected tax payable on the taxable income for the period, using tax rates enacted, or substantively enacted by the end
of the reporting period.
Deferred tax is recognised using the liability method, in respect of temporary differences between the carrying value of assets and liabilities
for reporting purposes and the amounts charged or credited for tax purposes. Deferred tax is calculated at the rate of tax expected to
apply when the liability is settled or the asset is realised. A deferred tax asset is recognised only to the extent that it is probable that future
taxable profits will be available against which the asset can be utilised.
Deferred tax is provided on temporary differences arising on investments in subsidiaries, joint ventures, associates and intangibles arising
on consolidation, except where the timing of the reversal of the temporary difference is controlled by the Group and it is probable that the
temporary difference will not reverse in the foreseeable future. No provision is made in respect of any further tax liability that would arise
on the distribution of retained earnings of overseas joint ventures and associates.
Deferred tax liabilities are offset against deferred tax assets within the same taxable entity or qualifying local tax group where there is both
the legal right and the intention to settle on a net basis or to realise the asset and settle the liability simultaneously.
Significant judgement is required in determining the Group’s income tax liabilities. In arriving at the current and deferred tax liability the
Group has taken account of tax issues that are subject to ongoing discussions with the relevant tax authorities. Calculations of these
liabilities have been based on management’s assessment of legal and professional advice, case law and other relevant guidance. Where the
expected tax outcome of these matters is different from the amounts that were recorded initially, such differences will impact the current
and deferred tax amounts in the period in which such determination is made.
Taxchargedtotheconsolidatedincomestatementintheyear
Yearended
31March
2011
£m
Yearended
31March
2010
£m
Currenttax
–currentyear 111 98
–doubletaxrelief (1) (1)
–adjustmenttoprioryears (26) (5)
84 92
Deferredtax
–deferredtaxonoriginationandreversaloftimingdifferences (33) (9)
–deferredtaximpactofchangesintaxrates (1) -
(34) (9)
Totaltaxchargedtoconsolidatedincomestatement–continuingoperations 50 83
Taxcharge/(credited)totheconsolidatedincomestatementfordiscontinuedoperationscanbe
analysedasfollows:
Taxcreditondiscontinuedoperations,excludingexceptionalitems – (7)
Taxcharge/(credited)onexceptionalitems–discontinuedoperations 2 (11)
Totaltaxcharge/(credited)totheconsolidatedincomestatement–discontinuedoperations 2 (18)
Totaltaxchargedtotheconsolidatedincomestatement 52 65
Taxchargedtotheconsolidatedincomestatementforcontinuingoperationscanbeanalysedas
follows:
Totaltaxchargedtotheconsolidatedincomestatement–continuingoperations 50 83
Taxcreditonacquisitionanddisposalcosts 32 20
Taxcreditonexceptionalitems–continuingoperations 8 4
Taxonprofitbeforeacquisitionanddisposalcostsandexceptionalitems 90 107
The Group’s share of profit of associates in the consolidated income statement is shown net of tax of £2m (2010 – £3m).
The Group’s effective tax rate is reduced by 6% to 26% (2010 – 32%), due to a one-off settlement reached with tax authorities.
Notes to the financial statements
continued
14
4 Taxcontinued
Taxcharged/(credited)toequityintheyear
Yearended
31March
2011
£m
Yearended
31March
2010
£m
Currenttaxcreditonshare-basedpayments (3) (9)
Currenttaxchargeonexchangeadjustments 2 2
Currenttaxchargeonhedginginstruments 2 12
Netcurrenttaxonitemsrecognisedinequity 1 5
Deferredtaxchargeonshare-basedpayments – 1
Netdeferredtaxonitemsrecognisedinequity – 1
The Group’s tax charge was lower than the UK statutory rate and can be reconciled as follows:
Yearended
31March
2011
£m
Yearended
31March
2010
£m
Profitbeforetaxfromcontinuingoperations 233 247
TaxonprofitatthestandardrateofCorporationTaxintheUKof28%(2010–28%) 65 69
Expensesnotdeductiblefortaxpurposes 14 12
Adjustmentstodeferredtaxinrespectofprioryears (9) (1)
Adjustmentsinrespectofforeigntaxrates 7 10
Adjustmentstocurrenttaxinrespectofprioryears (26) (5)
Adjustmentsinrespectofassociates (1) (2)
Taxchargefromcontinuingoperations 50 83
Previously unrecognised losses with a tax value of £1m (2010 - £1m) have been utilised against German profits in the year.
In addition to the changes in rates of Corporation Tax that were announced in the Finance Act 2010 which saw the main rate of
Corporation Tax reduced to 27% from 1 April 2011, a number of further changes to the UK Corporation Tax system were announced in
the March 2011 UK Budget Statement. A resolution passed by Parliament on 29 March 2011 reduced the main rate of Corporation Tax
to 26% from 1 April 2011. As a result of this change, the Group's deferred tax liability has been reduced by £2m.
Legislation to reduce the main rate of Corporation Tax from 26% to 25% from 1 April 2012 is expected to be included in the Finance Act
2011. Further reductions to the main rate are proposed to reduce the rate by a further 1% per annum to 23% by 1 April 2014. These
changes had not been substantively enacted at the balance sheet date and are not included in the tax charge for the period. The reduction
to 23% is not expected to have a material impact on the deferred tax balances.
Notes to the financial statements
continued
15
4 Taxcontinued
Deferredtax–Group
The movement in deferred tax balance is as follows:
Goodwill
£m
Intangible
assets
arisingon
consolidation
£m
Employee-
related
items
£m
Deferred
incomeand
accrued
expenses
£m
Losses
carried
forward
£m
Other
£m
Total
£m
Netbalancesat31March2009 (11) (139) 18 8 8 (8) (124)
Tax(charge)/credit (23) 19 (1) 2 (6) 18 9
Acquisition – (31) – – – – (31)
Reserves (1) – – – – – (1)
FX (1) 7 (1) 2 – – 7
(36) (144) 16 12 2 10 (140)
Deferredtaxassetsat31March2010 7 – 28 18 2 10 65
Deferredtaxliabilitiesat31March2010 (43) (144) (12) (6) – – (205)
Netbalancesat31March2010 (36) (144) 16 12 2 10 (140)
Tax(charge)/credit (8) 32 4 (5) 8 3 34
Reserves – – 4 1 – (5) –
FX 2 5 – (1) – – 6
(42) (107) 24 7 10 8 (100)
Deferredtaxassetsat31March2011 13 1 44 10 10 21 99
Deferredtaxliabilitiesat31March2011 (55) (108) (20) (3) – (13) (199)
Netbalancesasat31March2011 (42) (107) 24 7 10 8 (100)
Deferredtaxbalancesafteroffsetofbalanceswithincountries
Yearended
31March
2011
£m
Yearended
31March
2010
£m
Deferredtaxassets 17 34
Deferredtaxliabilities (117) (174)
Netbalances (100) (140)
Deferred tax assets of £5m have been re-instated in respect of German losses remaining unutilised at the year end.
Deferred tax assets of £8m (2010 – £6m) have not been recognised in respect of certain trading losses because it is not probable that
future profit will be available against which the Group can utilise the benefits.
The principal movement in deferred tax relates to the ongoing release of the deferred tax liability on the amortisation of intangibles arising
on consolidation.
Notes to the financial statements
continued
16
5 Exceptionalitems
Exceptional items are significant items of a non-recurring nature and considered material in both size and nature. These are disclosed
separately to enable a full understanding of the Group’s financial performance. Transactions which may give rise to exceptional items are
principally gains and losses on disposal of investments and other large gains and losses not attributable to the normal course of the Group’s
activities. These are shown as ‘exceptional items’ on the face of the consolidated income statement.
Yearended
31March
2011
£m
Yearended
31March
2010
£m
Exceptionalitems–continuingbusinesses
Totalexceptionalitemsbeforetax–continuingbusiness (23) (26)
Tax 8 4
Totalexceptionalitemsaftertax–continuingbusinesses (15) (22)
Exceptionalitems–discontinuedbusiness
Totalexceptionalitemsbeforetax-discontinuedbusiness 6 (41)
Tax (2) 11
Totalexceptionalitemsaftertax–discontinuedbusiness 4 (30)
For the year ended 31 March 2011, the Group recognised an exceptional pre-tax charge in its continuing business of £23m in respect of
the recoverability of the loans made to a number of associates active in non-core agency voice markets (£20m) and SEC settlement-
related costs (£3m). During the twelve months to 31 March 2010, the Group recognised a pre-tax exceptional charge of £26 million in
respect of settling the SEC matter (£21m) and the continuing cash equities business (£5m).
A post-tax credit of £4m relating to a reversal of a prior year exceptional charge (2010 – £nil) was also recognised for the year ended 31
March 2011. For the 12 months to 31 March 2010, the Group recognised a post-tax exceptional charge of £30m in respect of the
closure of its European and Asia Pacific full service agency cash equities businesses.
Notes to the financial statements
continued
17
6 Operatingexpenses
Profitbeforetaxfromcontinuingoperationsisstatedaftercharging:
Yearended
31March
2011
£m
Yearended
31March
2010
£m
Employeecosts 1,001 950
Informationtechnologycosts 163 141
Amortisationandimpairmentofintangibleassetsarisingonconsolidation 84 61
Professionalandlegalfees(includingauditors’remuneration) 20 20
Amortisationandimpairmentofintangibleassetsarisingfromdevelopmentexpenditure 29 23
Depreciationofpropertyandequipment 25 22
Governancecosts* 13 8
Clearingandsettlementfees 19 18
Operatingleaserentals–minimumleasepayments 23 23
Exchangeadjustments 6 7
Other** 95 84
Total 1,478 1,357
Auditors’remuneration
FeespayabletotheCompany’sauditorfortheauditoftheCompany’sannualfinancialstatements 0.4 0.5
FeespayabletotheCompany’sauditorforotherservices:
–fortheauditoftheCompany’ssubsidiaries 3.2 2.6
–regulatory 1.4 0.3
–taxservices 0.7 0.5
–corporatefinanceservices 0.1 0.2
–other 0.3 0.1
6.1 4.2
* Governance costs include feesassociated with risk, compliance, internal audit andlegal.
** Other includes exceptional costs(note5)of £3m (2010 –£26m).
Contractualarrangements
The Group places reliance on a number of key suppliers to carry out its business effectively and has procedures to ensure that purchasing
decisions balance cost against other factors including service quality, global reach and resilience.
The success of ICAP’s core voice broking business is reliant on its ability to attract and retain highly qualified staff. Staff costs represent
approximately 68% of total costs. A number of legal arrangements, including rolling term contracts and non-compete arrangements, are
employed to mitigate the risk of key staff being lost to competitors.
Information technology costs which represent approximately 11% of total costs are key to the delivery of both voice and electronic
products. The Group seeks to ensure that its systems have full redundancy and are capable of operating from business continuity sites.
The balance of costs represent premises, governance, clearing and other costs. These represent 21% of total costs.
The settlement of matched principal and exchange traded businesses requires access to clearing houses either directly or through third
party providers of clearing and settlement services. In North America the Group is a member of the FICC and NSCC through which it clears
US Treasury products, agency, mortgage and equity trades for its customer base. In Europe and Asia Pacific, with the exception of base
metal clearing on LCH.Clearnet Group Ltd, the majority of the Group’s clearing activities are outsourced to third parties where ICAP seeks
to partner with one of the leading clearing providers in each market.
Notes to the financial statements
continued
18
7 Cash
Cash and cash equivalents comprise cash on hand, demand deposits and other short-term highly liquid investments which are subject to
insignificant risk of change in fair value and are readily convertible into a known amount of cash with less than three months maturity.
The Group holds money, and occasionally financial instruments, on behalf of customers (client monies) in accordance with local regulatory
rules. Since the Group is not beneficially entitled to these amounts, they are excluded from the consolidated balance sheet along with the
corresponding liabilities to customers.
Restricted funds are comprised of cash held with a CCP clearing house, or a financial institution providing ICAP with access to a CCP, and
funds set aside for regulatory purposes, but excluding client money. The funds represent cash for which the Group does not have
immediate and direct access or for which regulatory requirements restrict the use of the cash.
(a)ReconciliationofGroupprofitbeforetaxtonetcashflowfromoperatingactivities
Group
Yearended
31March
2011
£m
Group
Yearended
31March
2010
£m
Profitbeforetaxfromcontinuingoperations 233 247
Profit/(loss)beforetaxfromdiscontinuedoperations 6 (66)
Discontinuedoperationsexceptionalitem(note5) (6) 41
Operatingexceptionalitems 23 26
Shareofoperatingprofitsofassociatesaftertax (3) (7)
Amortisationandimpairmentofintangibleassetsarisingonconsolidation 84 61
Amortisationandimpairmentofintangibleassetsarisingfromdevelopmentexpenditure 29 23
Depreciationofpropertyandequipment 25 22
Otheramortisationandimpairments 10 4
Share-basedpayments 8 10
Netfinanceexpense 28 28
Operatingcashflowsbeforemovementsinworkingcapital 437 389
(Increase)/decreaseintradeandotherreceivables (66) 26
Decrease/(increase)inrestrictedfunds 6 (1)
Decreaseintradeandotherpayables (14) (53)
Netreceiptsinrespectoffinancialassetsheldatfairvalue – 4
Cashgeneratedbyoperationsbeforeexceptionalitems 363 365
Operatingexceptionalitemspaid (21) (21)
Cashgeneratedbyoperations 342 344
Interestreceived 3 3
Interestpaid (30) (17)
Taxpaid (59) (55)
Netcashflowfromoperatingactivities 256 275
The movement in trade and other receivables and trade and other payables excludes the impact of the gross-up of matched principal
trades as permitted by IAS7 ‘Statement of Cash Flows’. The gross-up has no impact on the cash flow or net assets of the Group. The cash
flow movement in trade and other receivables includes the net movement on matched principal transactions and deposits for securities
borrowed/loaned. The movement for the year ended 31 March 2011, after accounting for acquisitions, is an outflow of £18m (2010
inflow of £20m).
ICAP - Preliminary statement for the year ended 31 March 2011

More Related Content

What's hot

Исследование ADEX BENCHMARK 2015
Исследование ADEX BENCHMARK 2015Исследование ADEX BENCHMARK 2015
Исследование ADEX BENCHMARK 2015Игорь Назаров
 
Tele2 Q2 2017 Presentation
Tele2 Q2 2017 PresentationTele2 Q2 2017 Presentation
Tele2 Q2 2017 PresentationTele2
 
International Comparative Study of telecom operators' taxation and tax optimi...
International Comparative Study of telecom operators' taxation and tax optimi...International Comparative Study of telecom operators' taxation and tax optimi...
International Comparative Study of telecom operators' taxation and tax optimi...Fédération Française des Télécoms
 
Tim meeting with investors - june 2018
Tim   meeting with investors - june 2018Tim   meeting with investors - june 2018
Tim meeting with investors - june 2018TIM RI
 
FiberCop and TIM CPD equity lol
FiberCop and TIM CPD equity lolFiberCop and TIM CPD equity lol
FiberCop and TIM CPD equity lolGruppo TIM
 
Q4 2015 Investor Factbook
Q4 2015 Investor FactbookQ4 2015 Investor Factbook
Q4 2015 Investor FactbookTMUS_IR
 
Roberto Volpe - SMAU Berlino 2017
Roberto Volpe - SMAU Berlino 2017Roberto Volpe - SMAU Berlino 2017
Roberto Volpe - SMAU Berlino 2017SMAU
 
Q4 2015 presentation
Q4 2015 presentationQ4 2015 presentation
Q4 2015 presentationTele2
 
PT\'s 4Q10 earnings presentation
PT\'s 4Q10 earnings presentationPT\'s 4Q10 earnings presentation
PT\'s 4Q10 earnings presentationNuno Vieira
 
Tele2 Q3 2016 presentation
Tele2 Q3 2016 presentationTele2 Q3 2016 presentation
Tele2 Q3 2016 presentationTele2
 
Tele2 Update Investment Markets 2017-06-01
Tele2 Update Investment Markets 2017-06-01Tele2 Update Investment Markets 2017-06-01
Tele2 Update Investment Markets 2017-06-01Tele2
 
alltel 4q05rel
alltel  4q05relalltel  4q05rel
alltel 4q05relfinance27
 
Full Year 2020 results and 2021-23 plan
Full Year 2020 results and 2021-23 planFull Year 2020 results and 2021-23 plan
Full Year 2020 results and 2021-23 planGruppo TIM
 
Way to win in KZ
Way to win in KZWay to win in KZ
Way to win in KZTele2
 
Tele2 Q3 2017 Presentation
Tele2 Q3 2017 PresentationTele2 Q3 2017 Presentation
Tele2 Q3 2017 PresentationTele2
 
2i Rete Gas - Infrastructure Day 2014
2i Rete Gas - Infrastructure Day 20142i Rete Gas - Infrastructure Day 2014
2i Rete Gas - Infrastructure Day 20142i Rete Gas
 
liberty global Q3_2008__Presentation
liberty global Q3_2008__Presentationliberty global Q3_2008__Presentation
liberty global Q3_2008__Presentationfinance43
 
2Q 2018 Results
2Q 2018 Results2Q 2018 Results
2Q 2018 ResultsGruppo TIM
 

What's hot (20)

Tka q3 2015_presentation
Tka q3 2015_presentationTka q3 2015_presentation
Tka q3 2015_presentation
 
Исследование ADEX BENCHMARK 2015
Исследование ADEX BENCHMARK 2015Исследование ADEX BENCHMARK 2015
Исследование ADEX BENCHMARK 2015
 
Tele2 Q2 2017 Presentation
Tele2 Q2 2017 PresentationTele2 Q2 2017 Presentation
Tele2 Q2 2017 Presentation
 
International Comparative Study of telecom operators' taxation and tax optimi...
International Comparative Study of telecom operators' taxation and tax optimi...International Comparative Study of telecom operators' taxation and tax optimi...
International Comparative Study of telecom operators' taxation and tax optimi...
 
Tim meeting with investors - june 2018
Tim   meeting with investors - june 2018Tim   meeting with investors - june 2018
Tim meeting with investors - june 2018
 
FiberCop and TIM CPD equity lol
FiberCop and TIM CPD equity lolFiberCop and TIM CPD equity lol
FiberCop and TIM CPD equity lol
 
Q4 2015 Investor Factbook
Q4 2015 Investor FactbookQ4 2015 Investor Factbook
Q4 2015 Investor Factbook
 
Roberto Volpe - SMAU Berlino 2017
Roberto Volpe - SMAU Berlino 2017Roberto Volpe - SMAU Berlino 2017
Roberto Volpe - SMAU Berlino 2017
 
Q4 2015 presentation
Q4 2015 presentationQ4 2015 presentation
Q4 2015 presentation
 
PT\'s 4Q10 earnings presentation
PT\'s 4Q10 earnings presentationPT\'s 4Q10 earnings presentation
PT\'s 4Q10 earnings presentation
 
Tele2 Q3 2016 presentation
Tele2 Q3 2016 presentationTele2 Q3 2016 presentation
Tele2 Q3 2016 presentation
 
Tele2 Update Investment Markets 2017-06-01
Tele2 Update Investment Markets 2017-06-01Tele2 Update Investment Markets 2017-06-01
Tele2 Update Investment Markets 2017-06-01
 
alltel 4q05rel
alltel  4q05relalltel  4q05rel
alltel 4q05rel
 
Full Year 2020 results and 2021-23 plan
Full Year 2020 results and 2021-23 planFull Year 2020 results and 2021-23 plan
Full Year 2020 results and 2021-23 plan
 
Way to win in KZ
Way to win in KZWay to win in KZ
Way to win in KZ
 
Portugal telecom
Portugal telecomPortugal telecom
Portugal telecom
 
Tele2 Q3 2017 Presentation
Tele2 Q3 2017 PresentationTele2 Q3 2017 Presentation
Tele2 Q3 2017 Presentation
 
2i Rete Gas - Infrastructure Day 2014
2i Rete Gas - Infrastructure Day 20142i Rete Gas - Infrastructure Day 2014
2i Rete Gas - Infrastructure Day 2014
 
liberty global Q3_2008__Presentation
liberty global Q3_2008__Presentationliberty global Q3_2008__Presentation
liberty global Q3_2008__Presentation
 
2Q 2018 Results
2Q 2018 Results2Q 2018 Results
2Q 2018 Results
 

Viewers also liked

Design chicanery 4x3
Design chicanery 4x3Design chicanery 4x3
Design chicanery 4x3Jason Kunesh
 
Week 1 discussion 2 presentation
Week 1 discussion 2 presentationWeek 1 discussion 2 presentation
Week 1 discussion 2 presentationrottengirl1106
 
TGoold CISI certificates 16-2-15
TGoold CISI certificates 16-2-15TGoold CISI certificates 16-2-15
TGoold CISI certificates 16-2-15Tom Goold
 
Trabajo5.tania villacismarin.didacticayped
Trabajo5.tania villacismarin.didacticaypedTrabajo5.tania villacismarin.didacticayped
Trabajo5.tania villacismarin.didacticaypedTanisole Villacis Marin
 
Cuco present on cumi felix
Cuco present on cumi felixCuco present on cumi felix
Cuco present on cumi felixFelix Serano
 
Soccer Free Kick Pp
Soccer Free Kick PpSoccer Free Kick Pp
Soccer Free Kick Ppmdil
 
Dr S Kaplan
Dr S KaplanDr S Kaplan
Dr S KaplanPeter F
 
Casa White O de Toyo Ito
Casa White O de Toyo ItoCasa White O de Toyo Ito
Casa White O de Toyo ItoMarcela Gallo
 
Objetivo, Instrucciones, Normas de la Convencion JAS Mision Antofagasta 2013
Objetivo, Instrucciones, Normas de la Convencion JAS Mision Antofagasta 2013Objetivo, Instrucciones, Normas de la Convencion JAS Mision Antofagasta 2013
Objetivo, Instrucciones, Normas de la Convencion JAS Mision Antofagasta 2013Convención Jas Misión Antofagasta
 

Viewers also liked (12)

Design chicanery 4x3
Design chicanery 4x3Design chicanery 4x3
Design chicanery 4x3
 
Week 1 discussion 2 presentation
Week 1 discussion 2 presentationWeek 1 discussion 2 presentation
Week 1 discussion 2 presentation
 
TGoold CISI certificates 16-2-15
TGoold CISI certificates 16-2-15TGoold CISI certificates 16-2-15
TGoold CISI certificates 16-2-15
 
Trabajo5.tania villacismarin.didacticayped
Trabajo5.tania villacismarin.didacticaypedTrabajo5.tania villacismarin.didacticayped
Trabajo5.tania villacismarin.didacticayped
 
Cuco present on cumi felix
Cuco present on cumi felixCuco present on cumi felix
Cuco present on cumi felix
 
Soccer Free Kick Pp
Soccer Free Kick PpSoccer Free Kick Pp
Soccer Free Kick Pp
 
Dr S Kaplan
Dr S KaplanDr S Kaplan
Dr S Kaplan
 
Casa White O de Toyo Ito
Casa White O de Toyo ItoCasa White O de Toyo Ito
Casa White O de Toyo Ito
 
Objetivo, Instrucciones, Normas de la Convencion JAS Mision Antofagasta 2013
Objetivo, Instrucciones, Normas de la Convencion JAS Mision Antofagasta 2013Objetivo, Instrucciones, Normas de la Convencion JAS Mision Antofagasta 2013
Objetivo, Instrucciones, Normas de la Convencion JAS Mision Antofagasta 2013
 
Euro 2016
Euro 2016Euro 2016
Euro 2016
 
LA LIBERTAD PERSONAL
LA LIBERTAD PERSONALLA LIBERTAD PERSONAL
LA LIBERTAD PERSONAL
 
Syllabus
SyllabusSyllabus
Syllabus
 

Similar to ICAP - Preliminary statement for the year ended 31 March 2011

I-Bytes Telecommunication, Media and Technology Industry
I-Bytes Telecommunication, Media and Technology IndustryI-Bytes Telecommunication, Media and Technology Industry
I-Bytes Telecommunication, Media and Technology IndustryEGBG Services
 
Sopra Group India- Annual Results 2013
Sopra Group India- Annual Results 2013Sopra Group India- Annual Results 2013
Sopra Group India- Annual Results 2013Sopra Steria India
 
2Q 2015 RESULTS Financial Report
2Q 2015 RESULTS Financial Report2Q 2015 RESULTS Financial Report
2Q 2015 RESULTS Financial ReportBANCO SANTANDER
 
I-Bytes Utilities Industry
I-Bytes Utilities IndustryI-Bytes Utilities Industry
I-Bytes Utilities IndustryEGBG Services
 
deloitte-uk-defining-fast-tech-growth-fast-50-2015
deloitte-uk-defining-fast-tech-growth-fast-50-2015deloitte-uk-defining-fast-tech-growth-fast-50-2015
deloitte-uk-defining-fast-tech-growth-fast-50-2015Thomas Rees
 
1Q 2018 Results
1Q 2018 Results1Q 2018 Results
1Q 2018 ResultsGruppo TIM
 
Tim meeting with investors - july
Tim   meeting with investors - julyTim   meeting with investors - july
Tim meeting with investors - julyTIM RI
 
Sopra Steria Group generated revenue of €845.8 million in the third quarter o...
Sopra Steria Group generated revenue of €845.8 million in the third quarter o...Sopra Steria Group generated revenue of €845.8 million in the third quarter o...
Sopra Steria Group generated revenue of €845.8 million in the third quarter o...Sopra Steria India
 
Tim meeting with investors - september
Tim   meeting with investors - septemberTim   meeting with investors - september
Tim meeting with investors - septemberTIM RI
 
I-Bytes Telecommunication & Media Industry
I-Bytes Telecommunication & Media IndustryI-Bytes Telecommunication & Media Industry
I-Bytes Telecommunication & Media IndustryEGBG Services
 
Suominen Corporation results Q3/2018
Suominen Corporation results Q3/2018Suominen Corporation results Q3/2018
Suominen Corporation results Q3/2018Suominen Corporation
 
Xing ag results_9_m_2014
Xing ag results_9_m_2014Xing ag results_9_m_2014
Xing ag results_9_m_2014XING SE
 
Nokia q3 2018_slides
Nokia q3 2018_slidesNokia q3 2018_slides
Nokia q3 2018_slidesAqeel Ahmad
 
Merrill lynchHistorical Earnings Announcements 2005 1st
Merrill lynchHistorical Earnings Announcements 2005 1st Merrill lynchHistorical Earnings Announcements 2005 1st
Merrill lynchHistorical Earnings Announcements 2005 1st finance3
 

Similar to ICAP - Preliminary statement for the year ended 31 March 2011 (20)

Besiq12015
Besiq12015Besiq12015
Besiq12015
 
ICAP Annual Report
ICAP Annual ReportICAP Annual Report
ICAP Annual Report
 
I-Bytes Telecommunication, Media and Technology Industry
I-Bytes Telecommunication, Media and Technology IndustryI-Bytes Telecommunication, Media and Technology Industry
I-Bytes Telecommunication, Media and Technology Industry
 
Sopra Group India- Annual Results 2013
Sopra Group India- Annual Results 2013Sopra Group India- Annual Results 2013
Sopra Group India- Annual Results 2013
 
2Q 2015 RESULTS Financial Report
2Q 2015 RESULTS Financial Report2Q 2015 RESULTS Financial Report
2Q 2015 RESULTS Financial Report
 
I-Bytes Utilities Industry
I-Bytes Utilities IndustryI-Bytes Utilities Industry
I-Bytes Utilities Industry
 
Sopra Steria First-half 2015
Sopra Steria First-half 2015Sopra Steria First-half 2015
Sopra Steria First-half 2015
 
deloitte-uk-defining-fast-tech-growth-fast-50-2015
deloitte-uk-defining-fast-tech-growth-fast-50-2015deloitte-uk-defining-fast-tech-growth-fast-50-2015
deloitte-uk-defining-fast-tech-growth-fast-50-2015
 
1Q 2018 Results
1Q 2018 Results1Q 2018 Results
1Q 2018 Results
 
Tim meeting with investors - july
Tim   meeting with investors - julyTim   meeting with investors - july
Tim meeting with investors - july
 
Sopra Steria Group generated revenue of €845.8 million in the third quarter o...
Sopra Steria Group generated revenue of €845.8 million in the third quarter o...Sopra Steria Group generated revenue of €845.8 million in the third quarter o...
Sopra Steria Group generated revenue of €845.8 million in the third quarter o...
 
Tim meeting with investors - september
Tim   meeting with investors - septemberTim   meeting with investors - september
Tim meeting with investors - september
 
I-Bytes Telecommunication & Media Industry
I-Bytes Telecommunication & Media IndustryI-Bytes Telecommunication & Media Industry
I-Bytes Telecommunication & Media Industry
 
Suominen Corporation results Q3/2018
Suominen Corporation results Q3/2018Suominen Corporation results Q3/2018
Suominen Corporation results Q3/2018
 
Xing ag results_9_m_2014
Xing ag results_9_m_2014Xing ag results_9_m_2014
Xing ag results_9_m_2014
 
Q2 2009 Earning Report of Unify Corporation
Q2 2009 Earning Report of Unify CorporationQ2 2009 Earning Report of Unify Corporation
Q2 2009 Earning Report of Unify Corporation
 
Nokia q3 2018_slides
Nokia q3 2018_slidesNokia q3 2018_slides
Nokia q3 2018_slides
 
Speech Francioni AGM12_EN
Speech Francioni AGM12_ENSpeech Francioni AGM12_EN
Speech Francioni AGM12_EN
 
IMAP closes 54 M&A deals worth more than $3.6bn in Q1 2021
IMAP closes 54 M&A deals worth more than $3.6bn in Q1 2021IMAP closes 54 M&A deals worth more than $3.6bn in Q1 2021
IMAP closes 54 M&A deals worth more than $3.6bn in Q1 2021
 
Merrill lynchHistorical Earnings Announcements 2005 1st
Merrill lynchHistorical Earnings Announcements 2005 1st Merrill lynchHistorical Earnings Announcements 2005 1st
Merrill lynchHistorical Earnings Announcements 2005 1st
 

More from Finance Magnates

FXC - Foreign Exchange Committee Releases FX Volume Survey Results
FXC - Foreign Exchange Committee Releases FX Volume Survey ResultsFXC - Foreign Exchange Committee Releases FX Volume Survey Results
FXC - Foreign Exchange Committee Releases FX Volume Survey ResultsFinance Magnates
 
Saxo bank - half-year report 2010
Saxo bank - half-year report 2010Saxo bank - half-year report 2010
Saxo bank - half-year report 2010Finance Magnates
 
Saxo bank - Annual report 2009
Saxo bank - Annual report 2009Saxo bank - Annual report 2009
Saxo bank - Annual report 2009Finance Magnates
 
Triennial Central Bank Survey Foreign exchange and derivatives market activit...
Triennial Central Bank Survey Foreign exchange and derivatives market activit...Triennial Central Bank Survey Foreign exchange and derivatives market activit...
Triennial Central Bank Survey Foreign exchange and derivatives market activit...Finance Magnates
 
Public Report on the Registration Program of the National Futures Association
Public Report on the Registration Program of the National Futures AssociationPublic Report on the Registration Program of the National Futures Association
Public Report on the Registration Program of the National Futures AssociationFinance Magnates
 
Hugo cruz v. fxdd complaint 2 11-11 doc 68
Hugo cruz v. fxdd complaint 2 11-11 doc 68Hugo cruz v. fxdd complaint 2 11-11 doc 68
Hugo cruz v. fxdd complaint 2 11-11 doc 68Finance Magnates
 
The Foreign Exchange Committee
The Foreign Exchange CommitteeThe Foreign Exchange Committee
The Foreign Exchange CommitteeFinance Magnates
 
Questions and Answers Regarding Final Retail Foreign Exchange Rule
Questions and Answers Regarding Final Retail Foreign Exchange RuleQuestions and Answers Regarding Final Retail Foreign Exchange Rule
Questions and Answers Regarding Final Retail Foreign Exchange RuleFinance Magnates
 
FOREX MAGNATES RETAIL FOREX MARKET QUARTERLY REPORT FOR Q2 2011
FOREX MAGNATES RETAIL FOREX MARKET QUARTERLY REPORT FOR Q2 2011FOREX MAGNATES RETAIL FOREX MARKET QUARTERLY REPORT FOR Q2 2011
FOREX MAGNATES RETAIL FOREX MARKET QUARTERLY REPORT FOR Q2 2011Finance Magnates
 
Trading Forex - What Investors Need to Know
Trading Forex - What Investors Need to KnowTrading Forex - What Investors Need to Know
Trading Forex - What Investors Need to KnowFinance Magnates
 

More from Finance Magnates (20)

Federal 11 may10no6
 Federal 11 may10no6 Federal 11 may10no6
Federal 11 may10no6
 
White paper tradologic
White paper tradologicWhite paper tradologic
White paper tradologic
 
Gain Capital
Gain CapitalGain Capital
Gain Capital
 
FXC - Foreign Exchange Committee Releases FX Volume Survey Results
FXC - Foreign Exchange Committee Releases FX Volume Survey ResultsFXC - Foreign Exchange Committee Releases FX Volume Survey Results
FXC - Foreign Exchange Committee Releases FX Volume Survey Results
 
Swissquote h1 2011
Swissquote h1 2011Swissquote h1 2011
Swissquote h1 2011
 
Shrader fxcm
Shrader fxcmShrader fxcm
Shrader fxcm
 
Saxo bank - half-year report 2010
Saxo bank - half-year report 2010Saxo bank - half-year report 2010
Saxo bank - half-year report 2010
 
Saxo bank - Annual report 2009
Saxo bank - Annual report 2009Saxo bank - Annual report 2009
Saxo bank - Annual report 2009
 
Saxo - Annual report 2010
Saxo - Annual report 2010Saxo - Annual report 2010
Saxo - Annual report 2010
 
Triennial Central Bank Survey Foreign exchange and derivatives market activit...
Triennial Central Bank Survey Foreign exchange and derivatives market activit...Triennial Central Bank Survey Foreign exchange and derivatives market activit...
Triennial Central Bank Survey Foreign exchange and derivatives market activit...
 
FXCM - ANNUAL REPORT 2010
FXCM - ANNUAL REPORT 2010FXCM - ANNUAL REPORT 2010
FXCM - ANNUAL REPORT 2010
 
Olintusinformation8 18-10
Olintusinformation8 18-10Olintusinformation8 18-10
Olintusinformation8 18-10
 
Public Report on the Registration Program of the National Futures Association
Public Report on the Registration Program of the National Futures AssociationPublic Report on the Registration Program of the National Futures Association
Public Report on the Registration Program of the National Futures Association
 
IG Group Imsq1 sep10
IG Group Imsq1 sep10IG Group Imsq1 sep10
IG Group Imsq1 sep10
 
Hugo cruz v. fxdd complaint 2 11-11 doc 68
Hugo cruz v. fxdd complaint 2 11-11 doc 68Hugo cruz v. fxdd complaint 2 11-11 doc 68
Hugo cruz v. fxdd complaint 2 11-11 doc 68
 
The Foreign Exchange Committee
The Foreign Exchange CommitteeThe Foreign Exchange Committee
The Foreign Exchange Committee
 
Questions and Answers Regarding Final Retail Foreign Exchange Rule
Questions and Answers Regarding Final Retail Foreign Exchange RuleQuestions and Answers Regarding Final Retail Foreign Exchange Rule
Questions and Answers Regarding Final Retail Foreign Exchange Rule
 
FOREX MAGNATES RETAIL FOREX MARKET QUARTERLY REPORT FOR Q2 2011
FOREX MAGNATES RETAIL FOREX MARKET QUARTERLY REPORT FOR Q2 2011FOREX MAGNATES RETAIL FOREX MARKET QUARTERLY REPORT FOR Q2 2011
FOREX MAGNATES RETAIL FOREX MARKET QUARTERLY REPORT FOR Q2 2011
 
Trading Forex - What Investors Need to Know
Trading Forex - What Investors Need to KnowTrading Forex - What Investors Need to Know
Trading Forex - What Investors Need to Know
 
Forex executed complaint
Forex executed complaintForex executed complaint
Forex executed complaint
 

Recently uploaded

Fundamentals Welcome and Inclusive DEIB
Fundamentals Welcome and  Inclusive DEIBFundamentals Welcome and  Inclusive DEIB
Fundamentals Welcome and Inclusive DEIBGregory DeShields
 
Send Files | Sendbig.comSend Files | Sendbig.com
Send Files | Sendbig.comSend Files | Sendbig.comSend Files | Sendbig.comSend Files | Sendbig.com
Send Files | Sendbig.comSend Files | Sendbig.comSendBig4
 
Customizable Contents Restoration Training
Customizable Contents Restoration TrainingCustomizable Contents Restoration Training
Customizable Contents Restoration TrainingCalvinarnold843
 
Entrepreneurial ecosystem- Wider context
Entrepreneurial ecosystem- Wider contextEntrepreneurial ecosystem- Wider context
Entrepreneurial ecosystem- Wider contextP&CO
 
Data Analytics Strategy Toolkit and Templates
Data Analytics Strategy Toolkit and TemplatesData Analytics Strategy Toolkit and Templates
Data Analytics Strategy Toolkit and TemplatesAurelien Domont, MBA
 
How To Simplify Your Scheduling with AI Calendarfly The Hassle-Free Online Bo...
How To Simplify Your Scheduling with AI Calendarfly The Hassle-Free Online Bo...How To Simplify Your Scheduling with AI Calendarfly The Hassle-Free Online Bo...
How To Simplify Your Scheduling with AI Calendarfly The Hassle-Free Online Bo...SOFTTECHHUB
 
Planetary and Vedic Yagyas Bring Positive Impacts in Life
Planetary and Vedic Yagyas Bring Positive Impacts in LifePlanetary and Vedic Yagyas Bring Positive Impacts in Life
Planetary and Vedic Yagyas Bring Positive Impacts in LifeBhavana Pujan Kendra
 
GUIDELINES ON USEFUL FORMS IN FREIGHT FORWARDING (F) Danny Diep Toh MBA.pdf
GUIDELINES ON USEFUL FORMS IN FREIGHT FORWARDING (F) Danny Diep Toh MBA.pdfGUIDELINES ON USEFUL FORMS IN FREIGHT FORWARDING (F) Danny Diep Toh MBA.pdf
GUIDELINES ON USEFUL FORMS IN FREIGHT FORWARDING (F) Danny Diep Toh MBA.pdfDanny Diep To
 
Psychic Reading | Spiritual Guidance – Astro Ganesh Ji
Psychic Reading | Spiritual Guidance – Astro Ganesh JiPsychic Reading | Spiritual Guidance – Astro Ganesh Ji
Psychic Reading | Spiritual Guidance – Astro Ganesh Jiastral oracle
 
Interoperability and ecosystems: Assembling the industrial metaverse
Interoperability and ecosystems:  Assembling the industrial metaverseInteroperability and ecosystems:  Assembling the industrial metaverse
Interoperability and ecosystems: Assembling the industrial metaverseSiemens
 
1911 Gold Corporate Presentation Apr 2024.pdf
1911 Gold Corporate Presentation Apr 2024.pdf1911 Gold Corporate Presentation Apr 2024.pdf
1911 Gold Corporate Presentation Apr 2024.pdfShaun Heinrichs
 
The McKinsey 7S Framework: A Holistic Approach to Harmonizing All Parts of th...
The McKinsey 7S Framework: A Holistic Approach to Harmonizing All Parts of th...The McKinsey 7S Framework: A Holistic Approach to Harmonizing All Parts of th...
The McKinsey 7S Framework: A Holistic Approach to Harmonizing All Parts of th...Operational Excellence Consulting
 
How to Conduct a Service Gap Analysis for Your Business
How to Conduct a Service Gap Analysis for Your BusinessHow to Conduct a Service Gap Analysis for Your Business
How to Conduct a Service Gap Analysis for Your BusinessHelp Desk Migration
 
Go for Rakhi Bazaar and Pick the Latest Bhaiya Bhabhi Rakhi.pptx
Go for Rakhi Bazaar and Pick the Latest Bhaiya Bhabhi Rakhi.pptxGo for Rakhi Bazaar and Pick the Latest Bhaiya Bhabhi Rakhi.pptx
Go for Rakhi Bazaar and Pick the Latest Bhaiya Bhabhi Rakhi.pptxRakhi Bazaar
 
Roman Kyslyi: Використання та побудова LLM агентів (UA)
Roman Kyslyi: Використання та побудова LLM агентів (UA)Roman Kyslyi: Використання та побудова LLM агентів (UA)
Roman Kyslyi: Використання та побудова LLM агентів (UA)Lviv Startup Club
 
Introducing the AI ShillText Generator A New Era for Cryptocurrency Marketing...
Introducing the AI ShillText Generator A New Era for Cryptocurrency Marketing...Introducing the AI ShillText Generator A New Era for Cryptocurrency Marketing...
Introducing the AI ShillText Generator A New Era for Cryptocurrency Marketing...PRnews2
 
MEP Plans in Construction of Building and Industrial Projects 2024
MEP Plans in Construction of Building and Industrial Projects 2024MEP Plans in Construction of Building and Industrial Projects 2024
MEP Plans in Construction of Building and Industrial Projects 2024Chandresh Chudasama
 
Paul Turovsky - Real Estate Professional
Paul Turovsky - Real Estate ProfessionalPaul Turovsky - Real Estate Professional
Paul Turovsky - Real Estate ProfessionalPaul Turovsky
 
Implementing Exponential Accelerators.pptx
Implementing Exponential Accelerators.pptxImplementing Exponential Accelerators.pptx
Implementing Exponential Accelerators.pptxRich Reba
 

Recently uploaded (20)

Fundamentals Welcome and Inclusive DEIB
Fundamentals Welcome and  Inclusive DEIBFundamentals Welcome and  Inclusive DEIB
Fundamentals Welcome and Inclusive DEIB
 
Send Files | Sendbig.comSend Files | Sendbig.com
Send Files | Sendbig.comSend Files | Sendbig.comSend Files | Sendbig.comSend Files | Sendbig.com
Send Files | Sendbig.comSend Files | Sendbig.com
 
Customizable Contents Restoration Training
Customizable Contents Restoration TrainingCustomizable Contents Restoration Training
Customizable Contents Restoration Training
 
Entrepreneurial ecosystem- Wider context
Entrepreneurial ecosystem- Wider contextEntrepreneurial ecosystem- Wider context
Entrepreneurial ecosystem- Wider context
 
Data Analytics Strategy Toolkit and Templates
Data Analytics Strategy Toolkit and TemplatesData Analytics Strategy Toolkit and Templates
Data Analytics Strategy Toolkit and Templates
 
How To Simplify Your Scheduling with AI Calendarfly The Hassle-Free Online Bo...
How To Simplify Your Scheduling with AI Calendarfly The Hassle-Free Online Bo...How To Simplify Your Scheduling with AI Calendarfly The Hassle-Free Online Bo...
How To Simplify Your Scheduling with AI Calendarfly The Hassle-Free Online Bo...
 
Planetary and Vedic Yagyas Bring Positive Impacts in Life
Planetary and Vedic Yagyas Bring Positive Impacts in LifePlanetary and Vedic Yagyas Bring Positive Impacts in Life
Planetary and Vedic Yagyas Bring Positive Impacts in Life
 
GUIDELINES ON USEFUL FORMS IN FREIGHT FORWARDING (F) Danny Diep Toh MBA.pdf
GUIDELINES ON USEFUL FORMS IN FREIGHT FORWARDING (F) Danny Diep Toh MBA.pdfGUIDELINES ON USEFUL FORMS IN FREIGHT FORWARDING (F) Danny Diep Toh MBA.pdf
GUIDELINES ON USEFUL FORMS IN FREIGHT FORWARDING (F) Danny Diep Toh MBA.pdf
 
Psychic Reading | Spiritual Guidance – Astro Ganesh Ji
Psychic Reading | Spiritual Guidance – Astro Ganesh JiPsychic Reading | Spiritual Guidance – Astro Ganesh Ji
Psychic Reading | Spiritual Guidance – Astro Ganesh Ji
 
Interoperability and ecosystems: Assembling the industrial metaverse
Interoperability and ecosystems:  Assembling the industrial metaverseInteroperability and ecosystems:  Assembling the industrial metaverse
Interoperability and ecosystems: Assembling the industrial metaverse
 
1911 Gold Corporate Presentation Apr 2024.pdf
1911 Gold Corporate Presentation Apr 2024.pdf1911 Gold Corporate Presentation Apr 2024.pdf
1911 Gold Corporate Presentation Apr 2024.pdf
 
The McKinsey 7S Framework: A Holistic Approach to Harmonizing All Parts of th...
The McKinsey 7S Framework: A Holistic Approach to Harmonizing All Parts of th...The McKinsey 7S Framework: A Holistic Approach to Harmonizing All Parts of th...
The McKinsey 7S Framework: A Holistic Approach to Harmonizing All Parts of th...
 
How to Conduct a Service Gap Analysis for Your Business
How to Conduct a Service Gap Analysis for Your BusinessHow to Conduct a Service Gap Analysis for Your Business
How to Conduct a Service Gap Analysis for Your Business
 
WAM Corporate Presentation April 12 2024.pdf
WAM Corporate Presentation April 12 2024.pdfWAM Corporate Presentation April 12 2024.pdf
WAM Corporate Presentation April 12 2024.pdf
 
Go for Rakhi Bazaar and Pick the Latest Bhaiya Bhabhi Rakhi.pptx
Go for Rakhi Bazaar and Pick the Latest Bhaiya Bhabhi Rakhi.pptxGo for Rakhi Bazaar and Pick the Latest Bhaiya Bhabhi Rakhi.pptx
Go for Rakhi Bazaar and Pick the Latest Bhaiya Bhabhi Rakhi.pptx
 
Roman Kyslyi: Використання та побудова LLM агентів (UA)
Roman Kyslyi: Використання та побудова LLM агентів (UA)Roman Kyslyi: Використання та побудова LLM агентів (UA)
Roman Kyslyi: Використання та побудова LLM агентів (UA)
 
Introducing the AI ShillText Generator A New Era for Cryptocurrency Marketing...
Introducing the AI ShillText Generator A New Era for Cryptocurrency Marketing...Introducing the AI ShillText Generator A New Era for Cryptocurrency Marketing...
Introducing the AI ShillText Generator A New Era for Cryptocurrency Marketing...
 
MEP Plans in Construction of Building and Industrial Projects 2024
MEP Plans in Construction of Building and Industrial Projects 2024MEP Plans in Construction of Building and Industrial Projects 2024
MEP Plans in Construction of Building and Industrial Projects 2024
 
Paul Turovsky - Real Estate Professional
Paul Turovsky - Real Estate ProfessionalPaul Turovsky - Real Estate Professional
Paul Turovsky - Real Estate Professional
 
Implementing Exponential Accelerators.pptx
Implementing Exponential Accelerators.pptxImplementing Exponential Accelerators.pptx
Implementing Exponential Accelerators.pptx
 

ICAP - Preliminary statement for the year ended 31 March 2011

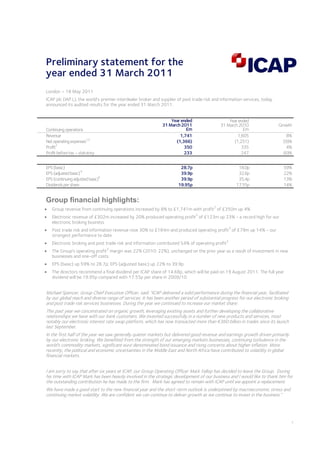
  • 1. 1 Preliminary statement for the year ended 31 March 2011 London – 18 May 2011 ICAP plc (IAP.L), the world’s premier interdealer broker and supplier of post trade risk and information services, today announced its audited results for the year ended 31 March 2011. Continuingoperations Yearended 31March2011 £m Yearended 31March2010 £m Growth Revenue 1,741 1,605 8% Netoperatingexpenses 1,3 (1,366) (1,251) (9)% Profit 2 350 335 4% Profitbeforetax–statutory 233 247 (6)% EPS(basic) 28.7p 18.0p 59% EPS(adjustedbasic) 4 39.9p 32.6p 22% EPS(continuingadjustedbasic) 4 39.9p 35.4p 13% Dividendspershare 19.95p 17.55p 14% Group financial highlights: • Group revenue from continuing operations increased by 8% to £1,741m with profit 2 of £350m up 4% • Electronic revenue of £302m increased by 20% produced operating profit 3 of £123m up 23% - a record high for our electronic broking business • Post trade risk and information revenue rose 30% to £184m and produced operating profit 3 of £79m up 14% - our strongest performance to date • Electronic broking and post trade risk and information contributed 54% of operating profit 3 • The Group's operating profit 3 margin was 22% (2010: 22%), unchanged on the prior year as a result of investment in new businesses and one-off costs. • EPS (basic) up 59% to 28.7p; EPS (adjusted basic) up 22% to 39.9p • The directors recommend a final dividend per ICAP share of 14.68p, which will be paid on 19 August 2011. The full year dividend will be 19.95p compared with 17.55p per share in 2009/10 Michael Spencer, Group Chief Executive Officer, said: “ICAP delivered a solid performance during the financial year, facilitated by our global reach and diverse range of services. It has been another period of substantial progress for our electronic broking and post trade risk services businesses. During the year we continued to increase our market share. This past year we concentrated on organic growth, leveraging existing assets and further developing the collaborative relationships we have with our bank customers. We invested successfully in a number of new products and services, most notably our electronic interest rate swap platform, which has now transacted more than €360 billion in trades since its launch last September. In the first half of the year we saw generally quieter markets but delivered good revenue and earnings growth driven primarily by our electronic broking. We benefited from the strength of our emerging markets businesses, continuing turbulence in the world’s commodity markets, significant euro denominated bond issuance and rising concerns about higher inflation. More recently, the political and economic uncertainties in the Middle East and North Africa have contributed to volatility in global financial markets. I am sorry to say that after six years at ICAP, our Group Operating Officer Mark Yallop has decided to leave the Group. During his time with ICAP Mark has been heavily involved in the strategic development of our business and I would like to thank him for the outstanding contribution he has made to the firm. Mark has agreed to remain with ICAP until we appoint a replacement. We have made a good start to the new financial year and the short-term outlook is underpinned by macroeconomic stress and continuing market volatility. We are confident we can continue to deliver growth as we continue to invest in the business.”
  • 2. There will be a briefing for analysts and investors at 09:30 BST on Wednesday 18 May 2011 at 2 Broadgate, London EC2M 7UR. The presentation slides and an audiocast will be available on the website, www.icap.com at 17:00 BST on Wednesday 18 May 2011. The audiocast will remain on the website for six months. A further conference call will be held at 14:30 BST/09:30 EST for investors and analysts in North America. For dial in details and a copy of the presentation please contact Maitland on +44 (0) 20 7379 5151. Notes 1. Includes operatingexpenses net of other income. 2. Profitisdefined as pre-taxprofit from continuing operations before acquisitionand disposal costs and exceptionalitems. 3. Fromcontinuing operationsexcludingacquisitionanddisposal costs andexceptionalitems. 4. Adjusted basic EPS is based on total earnings beforeacquisition and disposalcosts andexceptional items (andtheir tax effects).Continuing adjustedbasic EPS is based onearnings from continuing operations before acquisitionand disposal costs andexceptional items. Contacts: Michael Spencer Group Chief Executive Officer +44 (0) 20 7050 7400 Mike Sheard Director of Corporate Affairs +44 (0) 20 7050 7103 Alexandra Umpleby Head of Media Relations +44 (0) 20 7050 7104 Alex Dee Head of Investor Relations +44 (0) 20 7050 7123 Neil Bennett Maitland +44 (0) 20 7379 5151 Notes to editors: About ICAP ICAP is the world’s premier interdealer broker and provider of post trade risk and information services. The Group matches buyers and sellers in the wholesale markets in interest rates, credit, commodities, foreign exchange, emerging markets, equities and equity derivatives through voice and electronic networks. For more information go to www.icap.com
  • 3. 3 Preliminarystatementfortheyearended31March2011 Review of operations The Group reports revenue of £1,741 million, 8% above the prior year reflecting substantial progress in ICAP’s electronic broking and post trade risk and information businesses. We have seen increases in volumes on both our traditional fixed income and FX electronic trading platforms together with the successful launch of our new euro IRS platform. During the year, we moved closer to our strategic goal to have our operating profit generated evenly between voice broking, electronic broking and post trade risk and information with a total of 54% generated by our non-voice broking businesses. Strong volumes contributed to the percentage of operating profit* generated by the electronic broking platforms increasing from 28% to 33%, while the acquisition of TriOptima in March 2010 and higher volumes in Traiana offset the impact of lower activity levels in Reset, resulting in a two percentage point increase to 21% for post trade services share of Group operating profit*. The management of our cost base remains an area of substantial focus and, while we saw net operating expenses increase by 9% in the year to 31 March 2011, a substantial component of the rise relates to £17 million of non-recurring one-off costs and the Group’s investment in businesses, systems and processes which will fuel future growth. The acquisition of TriOptima, as well as investment in developing our newer voice businesses, including Brazil, accounted for £42 million of the total increase, 45% of the total if we exclude FX, with a further £22 million reflecting our increased spend on technology systems. The Group reports an operating profit* from continuing operations of £375 million, up 6% on the prior year due to a strong performance by our electronic broking and post trade risk and information businesses offset by continued investment and one- off costs. The Group’s operating profit margin generated from its continuing operations for the year ended 31 March 2011 remained unchanged at 22%. Profit before tax of £350 million was up 4% on the prior year and includes a full year contribution from TriOptima which was previously accounted for as an associate. Profit before tax on a statutory basis reduced by £14 million to £223 million primarily as a result of higher pre-tax trading profits being partially offset by an increase of £22 million in amortisation of intangibles related to the acquisition of TriOptima. Delivering on strategic objectives Our goals are to be the leading global intermediary, the leading post trade risk services provider and the main infrastructure provider to the world’s wholesale financial markets. We aim to have at least 35% of overall interdealer market revenues and to generate operating profit evenly distributed between voice broking, electronic broking and post trade risk and information services. In 2010/11, 54% of ICAP’s operating profit was generated from electronic broking and post trade risk and information activities, their highest combined level in ICAP’s history. There are three components to our strategy: • the expansion of our leading voice broking business; • the growth of our global electronic broking business both through increasing volumes of existing products and by developing new markets; and • the development of our post trade risk and information businesses to provide innovative services that enable our customers to reduce their costs and risks and to increase their efficiency, return on capital and capacity to process trades. A year ago we said that we would be concentrating on growing our business organically and working with our customers to expand the use of the market infrastructure in which we had previously invested. We have consolidated our position as a leading global intermediary in the wholesale financial markets by a clear margin with a further increase in our market share. Our leading voice broking business has expanded in emerging markets and commodities. Lower levels of activity in credit and equity derivatives slowed our business in those products. We’ve taken electronic markets into new asset classes following the launch last September of ICAP’s electronic euro interest rates swaps (IRS) platform. The platform which has market maker support, brings increased transparency and greater efficiency as well as lower transaction costs to the world’s largest OTC derivative market. This platform has now transacted over €360 billion in volume involving more than 4,300 trades representing over 20% of our euro IRS activity since its launch. We continue to see month-on-month increases in activity on this platform and, in March 2011, over 30% of our euro IRS trades were transacted on the platform. We plan to expand the platform to include dollar IRS during 2011. This is a prime example of how we work closely with our customers, aligning our interests with theirs and expanding their use of ICAP’s developing market infrastructure. The development of our post trade risk and information businesses in providing innovative services has continued apace. Traiana’s Harmony FX product has continued to gain significant market share with higher levels of integration with our customer base and the CLSAS joint venture with CLS Group in FX has seen a very large increase in volume. In addition, Traiana recently launched real-time straight-through-processing connectivity for our customers to CME Clearing for OTC FX derivatives and non-deliverable forwards (NDFs). * From continuing operations excluding acquisition anddisposal costs and exceptionalitems.
  • 4. Business drivers ICAP continues to have the potential for further growth and we have invested ahead of our competitors. Factors that support this growth include: • instability in currencies, interest rate and credit markets leading to price volatility and forming the basis for further growth in interest rate and credit derivatives, FX, commodities and listed financial markets; • demand for improved operational and capital efficiency for bank and hedge fund traders in these markets; • use of derivatives to manage efficiently and hedge risk exposure to changes in interest rates and FX, commodity and other price fluctuations; • continuing high levels of government and corporate bond issuance as structural change reduces bank lending to corporates; • reallocation of capital to commoditised “flow” markets and the structural shift away from complex structured products; • continuing regulatory pressure on financial market participants to overhaul OTC market infrastructure, reducing systemic and operational risk by improving back office procedures and reducing systemic and counterparty risk; • clearing of OTC derivatives trades to reduce risk, improve market efficiency and reduce costs; • increased political pressure for new regulations requiring more electronic trading, improved transparency and higher capital requirements for OTC trades that are not cleared; and • continued liberalisation of emerging markets. Economic growth and increasing sophistication are driving growth in onshore and offshore interest rate, FX and credit markets in these countries. Competitive environment We continue to benefit from greater scale and broader diversity than our competitors and have outperformed many of them in terms of market share. When assessing our available market size we include interdealer broking markets in rates, FX, commodities (including shipping), emerging markets, credit and equities – together with markets such as post trade risk. Markets like financial futures remain separate from this broader definition, although ICAP does act as an executing broker in listed futures markets. By our estimates, overall industry revenue was unchanged in 2010 at $11 billion. On this basis ICAP currently estimates its share of this market has grown to 23%–25%. Our strategy remains to increase this share to 35%. Financial markets reform Significant progress is being made by regulators in proposing changes to financial regulation which aim to strengthen supervision and market infrastructure. It is clear that there will be a long road to travel as, once the changes have been agreed, implementation of some aspects is likely to be phased over several years. Following the publication of the Basel III capital and liquidity reform package as well as the banks’ capital requirements, we expect a clearer view will now emerge of the potential impact on the operations of banks and their customers as a result of the way their trading operations (both proprietary and flow) are treated for risk and capital purposes. Regulators want to lower operational and systemic risk through greater automation and increased transparency of trading execution. The CFTC has not yet finalised the parameters that would define a Swap Execution Facility, a type of organised trading venue in the US, but we believe ICAP is well placed to provide sophisticated technology platforms that are fully compliant with the rules as they are finalised. In Europe, there are positive signs of the EU’s commitment to open, efficient and resilient markets in the proposed European Market Infrastructure Regulations. The EU’s MiFID II consultation is underway and the proposals are expected to be released in the second half of 2011. The regulatory push towards more electronic or hybrid trading of derivatives and central clearing are positive drivers for our sector. As a leading provider of OTC market infrastructure, ICAP is in a very strong position to work with market participants and lead new initiatives to address regulatory concerns. In addition to reducing counterparty risk through the extension of central clearing of eligible derivatives, we believe that there will be significant continuing demand for bilateral clearing of the many OTC derivatives that are not suitable for central counterparty (CCP) clearing. Regulators are increasingly aware of the need to build resilience in these markets and ICAP is continuing to work on the development of automated collateral management networks to streamline the process for both banks and their customers. This reduces cost, improves efficiency and mitigates risk. Above all, however, we believe that the many changes proposed will stimulate the banks and market infrastructure providers, including ICAP, to further technological innovation that will help achieve the objectives of the regulators for more resilient markets, and thereby create opportunities for building new businesses.
  • 5. 5 Markets ICAP reports on segments of its business in the same way externally as we manage and report the business internally. The major segments are the three regions of core voice broking, electronic broking, post trade risk and information and new businesses. New businesses, comprising new voice broking businesses, have been separated out to allow the appropriate focus given the very substantial investment that has been undertaken in recent years. ICAP provided services in a broad range of markets and the diversity of its market coverage is a key strength of the Group. The revenue and growth rates per market from our continuing operations are given below. Continuing operations Markets 2011 Revenue* £m 2010 Revenue* £m Growth % Rates 695 630 10 FX 321 292 10 Commodities 213 175 22 Emerging markets 191 141 35 Credit 185 204 (9) Equities 136 163 (17) Total 1,741 1,605 8 Segmentalperformance Core voice broking Revenue* £m Growth % Operating profit* £m Growth % EMEA 578 1 114 (4) The Americas 471 2 83 – Asia Pacific 134 6 (3) n/m Total 1,183 2 194 (7) Our voice broking business is active in the wholesale markets in rates, FX, commodities, emerging markets, credit and equities. ICAP’s strategy is to profitably expand our leading voice broking business by increasing market share. Revenue* from ICAP’s core voice broking businesses was broadly in line with the prior year despite revenue from Asia Pacific being adversely impacted by the loss of 38 brokers in September 2010. Revenue growth reflected strong performance of emerging markets, commodities, and interest rate derivatives, which was offset by slower performances in credit and equity derivatives. In addition revenue benefited from stronger dollar and euro exchange rates. Operating profit* decreased by 7% and operating profit margin by 3 percentage points following a number of one-off costs across all segments. However, our continued focus on costs, together with our new businesses reaching operational maturity, will support operating profit* margin for the voice broking business. Rates The interest rate markets have been active during 2010/11 with volume increases seen across the three main products: interest rate derivatives, government bonds and particularly repurchase agreements (repos). Volatility remained high due to the sovereign debt crisis in Europe and continuing global high levels of government debt issuance. Within the interest rate derivatives market, the biggest component of our business in terms of revenue, the euro swaps business and the cross-currency swaps area were the best performers and ICAP retained its position as the largest broker in these areas. Business was supported by high levels of corporate bond issuance in EMEA in what is still a very low rate environment. FX FX markets remained volatile in both developed and emerging markets resulting in significantly increased volumes in forward products. The spot FX business market has performed in line with the prior year. The strength of our FX business was evident during the year as we grew both revenue and market share, particularly in the major currencies. * From continuing operationsexcluding acquisitionanddisposalcosts andexceptional items.
  • 6. Commodities Economic uncertainty has substantially benefited our commodities business specifically trading in oils, coal and natural gas contributing to record revenue in EMEA. In the US, our electricity and oil businesses continue to perform strongly. We continue to develop our hybrid trading options for customers with momentum building for ICAPture, our US-focused platform designed to meet the changing regulatory requirements of the Dodd-Frank Act. With a focus on oils, we are extending ICAP TrueQuote from a post trade support engine to an interactive execution tool, providing screen-supported voice hybrid execution alongside straight- through-processing to multiple clearing venues. ICAP Shipping saw a general improvement in trading conditions and while it recorded a small operating loss we expect investments made in the current year will position the business to respond to improvements in market conditions. Emergingmarkets We have seen a strong increase in both volume and market share in the emerging markets’ rates businesses, specifically central European interest rate swaps, and have maintained our market leadership in Latin American businesses where we have deep customer and exchange relationships. In Asia, market conditions remained highly competitive, with a large number of brokers competing for business in all of our markets. In September we lost 38 broking staff in Singapore to a competitor and, while we have been actively rehiring, revenue was adversely impacted in the second half of the year. Over the medium term, we expect substantial growth in the region to come from China, where we have recently expanded the scope of our joint venture with CFETS and commenced broking renminbi on an offshore basis. Credit Revenue in credit as a whole was down on previous years and we saw a return to more normal markets. Although there was a reduction in the risk appetite of some our customers, overall market volumes in corporate bond markets remained relatively high. Tighter spreads however reduced ICAP’s revenue. Against this we saw an increase in CDS revenue driven in particular by strong growth in index products with increased volumes and an improvement in market share. We expect that potential changes to the market structure driven by further regulatory change are likely to impact these markets in the coming years. The introduction of electronic platforms is well advanced in the CDS markets on both sides of the Atlantic. Equities Equity derivatives are the main focus of this segment. Proposed regulatory changes, with the threat of increased capital requirements and reduced proprietary trading put our customers’ margins under pressure. This in turn had two effects; the first was commission compression for brokers of 20% - 30% and the second, low market volumes, particularly in the first three quarters of the year. In the first half, our US business performed better by increasing market share. We have successfully kept our teams intact despite aggressive approaches to key staff by competitors. As a result we were in a good position to benefit in the last quarter of the year when we saw an increase in market volumes. Electronic broking £m Growth % Revenue 302 20 Operating profit* 123 23 ICAP operates the world’s leading electronic trading platforms in the OTC FX and fixed income markets. The platforms offer efficient and effective trading solutions to customers in more than 50 countries in a range of instruments including spot FX, US Treasuries, European government bonds and EU and US repo. The platforms are built on our unique networks connecting participants in wholesale financial markets. ICAP’s strategy is to grow our global electronic broking business both through increasing volumes of existing products and by developing new markets. Combined average daily electronic broking volumes for the BrokerTec fixed income platform and EBS spot FX platform for the 12 months ended 31 March 2011 were $778 billion, up 24% from the previous year, with the highest average daily volume of $914.5 billion being achieved. Electronic broking reported revenue of £302 million, an increase of 20% over the prior year. Operating profit increased by 23% to £123 million. Despite the substantial revenue growth, operating profit margin increased marginally to 41% reflecting one-off costs primarily related to the write-down of technology platforms. ICAP’s demonstrated expertise developing and operating highly transparent and efficient electronic trading solutions positions it well to benefit from impending regulatory changes in Europe and the US. To further support its market leading position in a time of heightened competition in electronic trading, ICAP continues to invest in product development, operations and technology. * From continuing operations excluding acquisition and disposal costs and exceptional items.
  • 7. 7 Rates Fixedincome Trading on the BrokerTec platform was strong with total average daily volumes in US Treasury products, EU repo and US repo at $627 billion, up 27% on the prior year. Growth in US Treasury products benefited from high levels of issuance and activity in the US repo markets was particularly strong. In Europe, electronic trading of European government bonds continued the growth seen in the previous year. From April 2011, BrokerTec, an official platform in Portugal, secured primary dealer obligations from domestic market participants increasing the number of EU governments that recognise the use of the BrokerTec platform. In August 2010, having previously achieved the ability to submit overnight repos to the central clearer, LCH.Clearnet, BrokerTec EU repo trading was launched in Spain, leading to considerable new customer participation and the capture of considerable business in term secured funding. Investment in the BrokerTec platform technology continued throughout the year and was focused on delivering performance improvements and facilitating enhancements to EU and US trading capabilities. A capital expenditure programme to significantly upgrade the platform is on track to be completed in the second quarter of 2012. Interestrates In September we launched an electronic platform for trading euro IRS with market maker support, bringing increased transparency and greater efficiency, as well as lower transaction costs to the world’s largest OTC derivative market. This initiative will make a substantial contribution towards further reducing operational and systemic risks in trading OTC derivatives. Our electronic IRS platform takes ICAP’s established voice liquidity and combines it with a proven electronic platform to create a single liquidity pool in a wide range of euro IRS instruments out to 30 years’ maturity. Since its launch, the platform has transacted over €360 billion in volume involving more than 4,300 trades representing 20% of our euro IRS activity. We continue to see month-on-month increases in activity and in March 2011, over 30% of our euro IRS trades were transacted on the platform. We plan to expand into dollar IRS during 2011. FX We saw growth in FX activity over the course of the year. Average daily electronic broking volumes on the EBS platform were $151 billion, an 11% year-on-year increase. The EBS platform continued to demonstrate its role as the FX market’s central source of pricing and liquidity, especially clear, in moments of heightened volatility. Over the past year several new order types designed to support manual traders, including the introduction of the first purely electronic Fix Order were launched. Decimalised pricing on the EBS platform was launched in March 2011. Increased activity in a diverse range of currency pairs continued and the EBS presence in emerging markets strengthened. In September 2010, EBS was the first electronic platform to enable trading of Hong Kong cleared Chinese renminbi. March 2011 was a record month for Commonwealth and emerging markets’ currencies overall, with record monthly trading of the Australian dollar, Hong Kong cleared Chinese renminbi, Russian rouble and NDFs. MyTreasury My Treasury is an electronic money market trading platform for corporate treasury investors launched initially to offer AAA- rated money market funds and currently being extended to cover term deposits and certificates of deposit. During a period of fund sector consolidation, the value of funds invested via MyTreasury increased 270% from 2009/10. The platform has achieved complete offshore fund provider coverage and now offers access to more than 160 fund accounts. The number of investors using the platform increased by more than 40% year-on-year. Credit ICAP has a number of electronic platforms which have been developed to address different aspects of the credit derivatives markets. ICAP launched the first hybrid electronic and voice platform in Europe in 2004 and the first purely electronic credit trading application in the US in 2007. The product provides traders with real-time access to the full range of CDS markets, such as the on- the-run and off-the-run investment grade and high yield CDX indices, including unique support for curves, switches and rolls. ICAP recently introduced single name CDS instruments to the platform and is rolling out new single-name credit sectors weekly. The BrokerTec credit platform offers both manual and automated trading to all major banking institutions and has consistently been in the top three interdealer platforms. More recently, in the US we launched an additional hybrid platform for the credit default index market. Institutions in the US are anticipating the implementation of new regulatory requirements and accordingly have shown growing interest in our electronic credit solutions. CDS trading activity on the BrokerTec platform continues to grow, with steady participation in the market on a daily basis. It is expected that in the second quarter of 2011 total volumes since launch will surpass $300 billion. We are well positioned to take advantage of regulatory changes within the credit market, and our trading platforms are expected be fully compliant.
  • 8. Post trade risk and information £m Growth % Revenue 184 30 Operating profit* 79 14 ICAP’s strategy is to develop our post trade risk and information businesses to provide innovative services that enable our customers to reduce their costs and risks and to increase their efficiency, return on capital and capacity to process trades. The post trade risk and information segment comprises Traiana and the Portfolio Risk Services businesses – TriOptima, ReMatch and Reset – and the information business. The post trade risk and information business continued to perform strongly reporting revenue of £184 million, an increase of 30% on the prior year, while operating profit increased 14% reflecting a combination of the acquisition of TriOptima and higher volumes in Traiana. These improvements were offset by Reset which saw lower activity levels as a result of benign market conditions during the first part of the year. A change in the revenue mix, together with the ongoing investment in Traiana and ReMatch, resulted in operating profit* margin falling from 49% to 43%. Reset Reset is the market leading provider for interest rate reset risk management, accounts for the largest proportion of ICAP’s post trade risk revenue and operating profit*. Reset are experts in short-end risk management and thereby help our customers to control their fixing risk. The Reset matching engine allows for unilateral matching with hedging, therefore it is no longer necessary for our customers to have an offsetting position for each trade to be executed. During the first part of the year, Reset saw some slowdown as short-term interest rates remained low and stable although we saw a pick up in the final quarter as volatility returned to the LIBOR market. In addition, Reset began to benefit from its newly launched inflation fixing and basis fixing services and will be launching other new products, including bonds, over the next 12 months. TriOptima TriOptima is the provider of OTC derivatives infrastructure services including triReduce and triResolve. TriOptima’s services, aimed at reducing risk and helping financial institutions to manage their OTC derivative portfolios more efficiently, continue to be well utilised by the markets. The regulatory environment creates interesting opportunities for TriOptima as our customers focus significant resources on their new regulatory obligations. The business has faced a challenging operating environment as regulatory pressure on customers has been focused on maximising submission to clearing rather than optimising their portfolios through compression. These conditions are expected to be temporary. TriOptima’s portfolio compression service, triReduce, eliminated $45.8 trillion in IRS notionals in a record 53 cycles and $8.5 trillion in CDS notionals in a record 95 compression cycles during 2010/11. TriOptima’s counterparty exposure management service, triResolve, for OTC derivatives, including portfolio reconciliation, margin call management and dispute resolution, also continued to expand. In October, TriOptima announced that the ‘Big Six’ Canadian banks had joined the triResolve service. Currently, six million OTC derivative trades from 2,800 legal entities are regularly reconciled through triResolve. This represents 75% of all non-cleared OTC derivative transactions Traiana Traiana, the post trade netting and aggregation service, operates the industry-standard platform, for electronically processing OTC FX, futures, equities and equity derivatives. Traiana saw strong growth and has continued to expand its offering in new asset classes to both the buy- and sell- side firms across FX, exchange trade derivatives, equities and equity derivatives. Traiana Harmony now processes more than US$700 billion in trading volume each day, and connects more than 500 market participants including buy- side, sell-side, execution venues and ISVs. In FX, Traiana has continued to see strong revenue growth from existing services and the introduction of new products with daily trades processed more than doubling year over year, driven by continued growth in volumes from banks and prime brokers, increasing volumes from high-frequency trading and rising retail FX trading volumes. In addition, Traiana’s trade aggregation joint venture with CLS Group, CLS Aggregation Service (CLSAS), continued to expand. In December, Traiana and the CLS Group announced that all eight founding member banks of CLSAS had gone live with the service after adoption in just a year. On 15 March 2011 the CLSAS service processed the highest daily volume recorded so far with over 295,984 gross trades, aggregated to 11,788. Average daily volumes processed through CLSAS in March 2011 were 162,300 with an average compression ratio of 93.8%, from a standing start at the beginning of the year. In a move to help customers address new regulations, Traiana announced in March that it had launched a new service for the clearing of OTC FX derivatives, Harmony CCP Connect, with Citi as its first customer and CME Group its first clearing house. Harmony CCP Connect links Banks and Prime Brokers to clearing houses to comply with global financial reforms in the wake of the 2008 financial crisis, easing the implementation of central clearing mandates for derivatives. Traiana has also continued to expand the Harmony Network into new asset classes, including contract-for-difference (CFD) equity swaps and exchange-traded derivatives. Harmony is now the largest CFD equity swap messaging network in the world, and is used by 12 of the world’s largest equity swap counterparties and over 60 executing brokers. In March 2011, Traiana expanded Harmony’s CFD equity swaps network to the buy-side and a growing group of buy-side firms have already connected to the network. * From continuing operationsexcluding acquisitionanddisposal costs and exceptional items.
  • 9. 9 ReMatch ReMatch provides market risk mitigation and portfolio rebalancing services to address the problems derived from the build-up of illiquid, calendar spread, net open positions in CDS portfolios. In the past year it expanded its services to include US financials and western European sovereign CDS products. ReMatch addresses the problem of minimal or no exit liquidity at the ‘off the run’ points in a trader’s CDS portfolio, and reduces the market risk created by the build-up of these illiquid positions. Since its launch in October 2009, ReMatch has helped the market reduce a total of $250 billion in CDS trades. Information ICAP information empowers customers to make trading decisions with authoritative, independent and consistent OTC market information, across a range of asset classes. We provide real-time, end-of-day and historical data solutions across our brokered product range from 32 contributing countries. Our data is the intelligence behind algo trading and research models for customers and is a key source of mark-to-market data for the industry. This part of our post trade risk and information business is a profitable, high margin cash generative business with a broad, loyal, global customer base. The business has exhibited strong performance year- on-year with both revenue and profit growth and employs a subscription-based charging structure which provides a regular revenue stream. New businesses 2011 £m 2010 £m Revenue 72 54 Operating profit* (21) (24) For 2010/11 the new business segment included the Group’s investment in a number of new initiatives which have been started or acquired over the past two years. These include Brazil, intellectual property and base metals. This segment has been reviewed and as a result of the decreasing number of new businesses set-up or established over the past two financial years, it is planned to discontinue this segment for the year ending 31 March2012. Brazil ICAP’s operations in Brazil, with more than 250 brokers and support staff, encompasses three core products: futures (BM&F), equities (Bovespa) and a retail share trading platform (MyCAP). ICAP saw its market position improve with a near doubling of its revenue year-on-year and the MyCAP customer base increased to 10,000 accounts. As a result of our ongoing investment the business was loss making during 2010/11 and this is expected to continue in the year ahead as we continue to invest albeit at a lower level. We are now the leading independent broker and in the top 10 across all key product lines amidst a very competitive field of over 60 broker organisations. We have invested significantly in our systems and infrastructure and have seen encouraging recent growth in direct market access which will provide a key driver for the future. Basemetals ICAP is a Category 2 broking member of the London Metals Exchange (LME). The LME business produced strong revenue growth and is profitable. It gained access to new pools of liquidity by expanding geographically to offer a global service and by broadening its product offering over the past 12 months, including the new futures mini contract which was launched on the Singapore Exchange in February 2011, as well as opening a new office in Hong Kong. In future, base metals will be reported as part of the EMEA commodities segment. Intellectualproperty Patents continue to build a strong pipeline of deals and has held a number of auctions making a modest profit. The market growth is fuelled by smartphone patent wars, corporate bankruptcies and patent litigation risk. We have expanded the business beyond the traditional markets into automotive and pharmaceutical asset classes both of which offer significant growth opportunities. Outlook We have made a good start to the new financial year and the short-term outlook is underpinned by macroeconomic stress and market volatility. As the banks and our regulators seek to create more resilient, robust and orderly OTC derivatives markets we believe that ICAP’s business model is well prepared for changes in the financial market infrastructure. Investments in previous years have created a solid base for future growth and there are significant opportunities to expand the use of the market infrastructure we have built. We are confident we can deliver sustainable long-term growth. The Group remains focused on the disciplined execution of our strategy and we have positioned the business for sustained long- term development. Once again, this year we are concentrating on organic growth and remain committed to developing collaborative relationships with our bank customers. * From continuing operationsexcluding acquisitionanddisposalcosts andexceptional items.
  • 10. Profit for the year Year ended 31 March 2011 £m Year ended 31 March 2010 £m Profit before tax* from continuing operations 350 335 Acquisition and disposal costs (94) (62) Exceptional Items (23) (26) Profit before tax from continuing operations (statutory) 233 247 Tax (50) (83) Profit from continuing operations 183 164 The Group reports a solid performance with profit after tax, acquisition and disposal costs and exceptional items of £183 million from continuing operations. Acquisitionanddisposalcosts For the year commencing 1 April 2010, the Group has redefined the column previously entitled ‘amortisation and impairment of intangibles arising on consolidation’ having considered the impact of the adoption of IFRS3 (revised) ‘Business Combinations’ to the consolidated income statement. The Group saw amortisation of intangibles increase by £22 million over the prior year related to the acquisition of TriOptima. Exceptionalitemsanddiscontinuedoperations The Group’s policy is to separately disclose items in its income statement as exceptional which are non-recurring and, in terms of both size and nature, material. The Group has recognised an exceptional, pre-tax charge in its continuing business of £23 million in respect of the recoverability of the loans made to a number of associates active in non-core agency voice markets (£20 million) and an adjustment to the 2010 SEC settlement-related costs (£3 million). A post-tax credit of £4 million relating to a reversal of a prior year exceptional charge, disclosed as discontinued in 2010/11, was recognised as an exceptional item relating to the decision to close the European and Asia Pacific full service agency cash equities businesses in 2009/10. Tax The overall objective continues to be to plan and manage the tax affairs of the Group efficiently while complying with local tax regulations. The Group’s effective tax rate, excluding acquisition and disposal costs, exceptional items and discontinued operations is 26% (2010 – 32%) which represents maintenance of the underlying rate of 32% less a reduction of 6% in respect of settling enquires with tax authorities. A tax credit of £32 million (2010 – £20 million) has been recognised in the consolidated income statement column entitled ‘acquisition and disposal costs’ to reflect the impact of deferred tax on amortising intangible assets. The Group’s tax charge is affected by the varying tax rates in different jurisdictions applied to taxable profits; the mix of those profits; and the rules impacting deductibility of certain costs. The Group continues to take a prudent approach to the management of its tax affairs and provisions are set to cover tax exposures. We expect the Group’s effective tax rate, excluding acquisition and disposal costs, exceptional items and discontinued operations will be 31% for the financial year ending 31 March 2012. Earningsandearningspershare(EPS) We believe that the most appropriate EPS measurement ratio for the Group is adjusted basic EPS as this measure better reflects the Group’s underlying cash earnings. Adjusted basic EPS from continuing operations excludes the impact of the performance of acquisition and disposal costs, exceptional items and discontinued operations. Adjusted basic EPS from continuing operations increased by 13% to 39.9p. The Group’s basic EPS from continuing operations increased from 25.5p to 28.1p and total basic EPS, including discontinued operations, increased from 18.0p to 28.7p primarily as a result of a tax credit recognised in the financial year. Dividend For the past four years, the Group has paid a dividend equal to 50% of adjusted basic EPS which reflects the board’s desire to balance distributions to shareholders against the wider capital demands of the Group. For the current year we propose, subject to shareholder approval, to continue to apply the same multiple which results in a final dividend of 14.68p being proposed. This compares to 12.44p in the prior year and, when taken in conjunction with the interim dividend of 5.27p per share, results in a full-year dividend of 19.95p which is an increase of 14% on the prior year. Interim dividends are calculated as 30% of the previous year’s full-year dividend. This approach is expected to continue for the 2011/12 financial year. Subject to approval at the annual general meeting, the final dividend will be paid on 19 August 2011 to shareholders on the register at the close of business on 22 July 2011. The shares will be quoted ex-dividend from 20 July 2011. * Profitbefore tax, acquisition and disposal costs and exceptional items.
  • 11. 11 Operatingprofit*/cashconversion The Group continues to generate substantial free cash flow. Over the long term it is expected free cash and post-tax profit will converge. At 31 March 2011 our free cash flow conversion was 80% against a three year average ongoing free cash conversion of 107% of post-tax profit. This compares to 118% in the prior year as a result of increasing working capital requirements. Free cash flow Year ended 31 March 2011 £m Year ended 31 March 2010 £m Cash from ongoing operations** 363 390 Interest and tax (86) (69) Cash flow from ongoing operating activities 277 321 Capital expenditure (69) (66) Dividends from associates and investments 2 9 Ongoing free cash flow 210 264 Discontinued and exceptional** (21) (46) Free cash flow 189 218 Cash generated from ongoing operations decreased by £27 million in 2010/11 of which £8 million relates to the change in restricted funds, £3 million related to higher trading levels, offset by the impact of initially unsettled trades of £38 million. Net payments in respect of interest and tax have increased by £17 million to £86 million, primarily reflecting the full year impact of the five-year senior notes. The Group distributed £90 million of its free cash flow to shareholders through its dividend. Eventsafterthebalancesheetdate On 8 April 2011, the FSA approved the Group’s application to renew its waiver from investment firm consolidation for a further five years. * From continuing operationsexcludingacquisition anddisposal costs and exceptional items. ** Cash from operationsdisclosedin the consolidated cash flowstatement consists of cash from ongoing operationsplusdiscontinued andexceptional.
  • 12.
  • 13. Consolidated income statement Year ended 31 March 2011 1 Note Before acquisitionand disposalcosts andexceptional items £m Acquisitionand disposalcosts* £m Exceptionalitems (note5) £m Total £m Continuingoperations Revenue 1 1,741 – – 1,741 Operatingexpenses 6 (1,387) (88) (3) (1,478) Otherincome 21 – – 21 Operatingprofit 1 375 (88) (3) 284 Financeincome 5 – – 5 Financecosts (33) – (20) (53) Shareofprofit/(loss)ofassociatesaftertax 1 3 (6) – (3) Profitbeforetaxfromcontinuingoperations 350 (94) (23) 233 Tax 4 (90) 32 8 (50) Profitfortheyearfromcontinuingoperations 260 (62) (15) 183 Profitfortheyearfromdiscontinuedoperations – – 4 4 Profitfortheyear 260 (62) (11) 187 Attributableto: OwnersoftheCompany 260 (62) (11) 187 Non-controllinginterests – – – – 260 (62) (11) 187 Earningsperordinarysharefromcontinuing operations –basic 2(b) 28.1 –diluted 2(b) 27.6 Earningsperordinarysharefromtotaloperations –basic 2(a) 28.7 –diluted 2(a) 28.2 *Seebasisof preparationfor changeof definition to the column nowentitled‘acquisition anddisposal costs’.
  • 14. Consolidated income statement Year ended 31 March 2010 2 Note Before acquisitionand disposalcosts andexceptional items* £m Acquisitionand disposalcosts* £m Exceptionalitems (note5) £m Total £m Continuingoperations Revenue 1 1,605 – – 1,605 Operatingexpenses 6 (1,270) (61) (26) (1,357) Otherincome 19 – – 19 Operatingprofit 1 354 (61) (26) 267 Financeincome 7 – – 7 Financecosts (33) (2) – (35) Shareofprofitofassociatesaftertax 1 7 1 – 8 Profitbeforetaxfromcontinuingoperations 335 (62) (26) 247 Tax 4 (107) 20 4 (83) Profitfortheyearfromcontinuingoperations 228 (42) (22) 164 Lossfortheyearfromdiscontinuedoperations (18) – (30) (48) Profitfortheyear 210 (42) (52) 116 Attributableto: OwnersoftheCompany 210 (42) (52) 116 Non-controllinginterests – – – – 210 (42) (52) 116 Earningsperordinarysharefromcontinuing operations –basic 2(b) 25.5p –diluted 2(b) 25.1p Earningsperordinarysharefromtotaloperations –basic 2(a) 18.0p –diluted 2(a) 17.7p *The comparative resultshave beenre-presented for the change in the definitionof the column nowentitled ‘acquisition and disposal costs’. The net impactof thischange has been to reallocate £2m from finance costs in the first column to ‘acquisitionand disposal costs’ (see basis of preparation fordetailsof change in definition).
  • 15. Consolidated and Company balance sheet 3 Group Company Note Asat 31March 2011 £m Asat 31March 2010 £m Asat 31March 2011 £m Asat 31March 2010 £m Assets Non-currentassets Intangibleassetsarisingonconsolidation 1,358 1,489 – – Intangibleassetsarisingfromdevelopment expenditure 63 72 – – Propertyandequipment 87 68 – – Investmentinsubsidiaries – – 1,989 1,989 Investmentinjointventures – – 1 1 Investmentinassociates 31 30 – – Deferredtaxassets 4 17 34 – – Tradeandotherreceivables 14 35 – – Available-for-saleinvestments 30 27 – – 1,600 1,755 1,990 1,990 Currentassets Tradeandotherreceivables 74,693 60,101 40 36 Available-for-saleinvestments 1 1 – – Restrictedfunds 7(c) 73 81 – – Cashandcashequivalents 7(c) 404 423 – – 75,171 60,606 40 36 Totalassets 76,771 62,361 2,030 2,026 Liabilities Currentliabilities Tradeandotherpayables (74,634) (60,098) (89) (660) Borrowings 8(b) (183) (257) – (40) Taxpayable (119) (100) – – Provisions (2) (36) – – (74,938) (60,491) (89) (700) Non-currentliabilities Tradeandotherpayables (29) (30) (140) (140) Borrowings 8(a) (382) (395) – – Deferredtaxliabilities 4 (117) (174) – – Retirementbenefitobligations (1) (1) – – Provisions (53) (55) – – (582) (655) (140) (140) Totalliabilities (75,520) (61,146) (229) (840) Netassets 1,251 1,215 1,801 1,186 Equity Capitalandreserves Calledupsharecapital 66 66 66 66 Sharepremiumaccount 452 425 452 425 Otherreserves 75 71 1 1 Translation 73 138 – – Retainedearnings 565 498 1,282 694 EquityattributabletoownersoftheCompany 1,231 1,198 1,801 1,186 Non-controllinginterests 20 17 – – Totalequity 1,251 1,215 1,801 1,186 Approved by the board on 18 May 2011 and signed on its behalf by: MichaelSpencer IainTorrens Group Chief Executive Officer Group Finance Director
  • 16. Consolidated and Company statement of cash flow 4 Group Company Note Yearended 31March 2011 £m Yearended 31March 2010 £m Yearended 31March 2011 £m Yearended 31March 2010 £m Cashflowsfromoperatingactivities 7(a) 256 275 – – Cashflowsfrominvestingactivities Investmentsinsubsidiaries – – – (34) Dividendsreceivedfromassociates – 7 – – Otherequitydividendsreceived 2 2 – – Paymentstoacquirepropertyandequipment (45) (17) – – Intangibledevelopmentexpenditure (24) (49) – – Net(payments)/receiptsonavailable-for-sale investments (1) 14 – – Acquisitionofinterestsinbusinessesnetofcash acquired (27) (147) – – Acquisitionofassociatesandjointventures (2) (2) – – Netcashflowsfrominvestingactivities (97) (192) – (34) Cashflowsfromfinancingactivities Proceedsfromissueofordinaryshares – – – 3 Proceedsfromexerciseofshareoptions 2 – 2 5 Proceedsfromissuesofordinarysharestonon- controllinginterest 1 – – – DividendspaidtoownersoftheCompany (90) (92) (90) (92) PaymentstoacquireTreasuryShares (8) – (8) – Receipts/(payments)toacquireownsharesfor employeesharetrusts* 4 (2) – – Loanstoemployeebenefittrusttoacquirenew shares – – – (7) Repaymentofborrowings (377) (488) (40) – Fundsreceivedfromborrowing,netoffees 305 591 – 40 Netreceiptsfromsubsidiaries – – 136 85 Netcashflowsfromfinancingactivities (163) 9 – 34 FXadjustments (15) (8) – – Net(decrease)/increaseincashandcash equivalents (19) 84 – – Cashandcashequivalentsatbeginningoftheyear 7(c) 423 339 – – Cashandcashequivalentsatendoftheyear 7(c) 404 423 – – *Paymentsto acquireown sharesforemployee share trustsisshown net of£4m (2010 – £5m) of contributionsreceived from participants in the trusts.
  • 17. Basis of preparation 5 Preparationoffinancialstatements The financial statements have been prepared in accordance with IFRS adopted by the EU, IFRIC interpretations and with those parts of the Companies Act applicable to companies reporting under IFRS and therefore comply with Article 4 of the EU IAS Regulation. The financial statements have also been prepared under the historical cost convention, as modified to include the fair value of certain financial instruments in accordance with IFRS. The financial statements are prepared in pound sterling, which is the functional currency of the Company and presented in millions. The significant accounting policies adopted by the Group and Company are included at the front of the notes to which they relate. The preparation of financial statements requires management to make judgements, estimates and assumptions that affect the reported amounts of assets, liabilities, income and expenses. Management consider goodwill and tax (note 4) to be the areas where increased judgement is required. Due to the inherent uncertainty in making estimates, actual results reported in future periods may be based on amounts which differ from those estimates. Judgements, estimates and assumptions are continuously evaluated and are based on historical experience and other factors, including expectations of future events that are believed to be reasonable under the circumstances. Revisions to accounting estimates are recognised in the period in which the estimate is revised and in any future periods affected. This set of financial statements are the first in which the Group has presented the notes in an order that reflects management’s view of the importance of information contained in the notes to the performance and position of the Group for the year ended 31 March 2011. Presentationoftheincomestatement The Group maintains a columnar format for the presentation of its consolidated income statement. The columnar format enables the Group to continue its practice of improving the understanding of its results by presenting profit for the year before acquisition and disposal costs and exceptional items. This is the profit measure used to calculate adjusted EPS (note 2) and is considered to be the most appropriate as it better reflects the Group’s underlying cash earnings. Profit before acquisition and disposal costs and exceptional items are reconciled to profit before tax on the face of the consolidated income statement. For the financial year commencing 1 April 2010, and for future periods, the Group has redefined the column previously entitled ‘amortisation and impairment of intangibles arising on consolidation’ having considered the impact of the adoption of IFRS3 (revised) ‘Business Combinations’ (effective for the Group from 1 April 2010) to the consolidated income statement. This column has accordingly been renamed as ‘acquisition and disposal costs’ and will include: any re-measurement after initial recognition of deferred contingent consideration which has been classified as a liability; any gains or losses on the revaluation of previous interests; any gains or losses on the disposal of investments, associates or subsidiaries; and costs associated with a combination that do not constitute fees relating to the arrangement of financing. The column may also include items such as gains or losses on the settlement of pre-existing relationships with acquired businesses and the re-measurement of liabilities that are above the value of indemnification. To take into account the aforementioned changes the Group has also moved the impact of the unwind of the discounting of deferred contingent consideration into this column. Accordingly, the comparative consolidated income statement has been re-presented within the financial statements. For the year ending 31 March 2010 acquisition and disposal costs have increased by £2m from £40m to £42m. The column will continue to include the amortisation and impairment of intangible assets arising on consolidation. Each of the items reported under the acquisition and disposal column will be excluded from the calculation of adjusted basic EPS and adjusted diluted EPS (note 2). The Group believes this change will help to improve users of the financial statements understanding of the underlying results. Items which are of a non-recurring nature and material, when considering both size and nature, are disclosed separately to give a clearer presentation of the Group’s results. These are shown as ‘exceptional items’ on the face of the consolidated income statement together with any adjustments to prior period exceptional items. On the face of the consolidated income statement, basic and diluted EPS from continuing operations have also been disclosed. This enables the Group to provide clarity of the EPS of the continuing core business. The prior period basic and adjusted EPS have been re-presented to reflect the change in definition of the column ‘acquisition and disposal costs’ resulting in an increase in the adjusted diluted EPS of 0.3p. The Company has taken advantage of section 408 of the Companies Act not to present its own income statement and statement of comprehensive income. Presentationofthebalancesheet As part of the Group’s brokerage activities in matched principal and exchange traded markets, the Group is required to hold a mix of cash, cash equivalents and other securities with those institutions which provide it with clearing and settlement services. Balances represent deposits held with a clearer. The Group has traditionally accounted for the cash elements of these balances as cash and cash equivalents on the basis that the nature of the Group’s business model, which does not involve it taking proprietary positions, does not put the balances at risk. However, following a review undertaken in 2010/11 it was determined that the balances could not be withdrawn on a same day basis and, as such, failed to meet the definition contained in IAS7 ‘Statement of Cash Flows’ for cash and cash equivalents and it was therefore concluded that these balances should be separately identified on the face of the consolidated balance sheet and separately identified within the consolidated statement of cash flow under cash from operations. The impact of re-presenting the balance results in a decrease in cash of £81m in the prior year and increased restricted funds by the same amount. There is no impact to total current assets.
  • 18. Basis of preparation continued 6 Basisofconsolidation The Group’s consolidated financial statements include the results and net assets of the Company, its subsidiaries and the Group’s share of joint ventures and associates. An entity is regarded as a subsidiary if the Group has control over its strategic, operating and financial policies and intends to hold the investment on a long-term basis for the purpose of securing a contribution to the Group’s activities. The results of companies acquired during the year are included in the Group’s results from the effective date of acquisition. The results of companies disposed of during the year are included up to the effective date of disposal. The Group treats transactions with non-controlling interests as transactions with equity owners of the Group. For purchases from non- controlling interests, the difference between any consideration paid and the relevant share acquired of the carrying value of net assets of the subsidiary is recorded in equity. Gains or losses on disposals to non-controlling interests are also recorded in equity. Intercompany transactions, balances and unrealised gains on transactions between Group companies (the Company and its subsidiaries) are eliminated as part of the consolidation process. Unrealised losses are also eliminated unless the transaction provides evidence of an impairment of the asset transferred. A joint venture is an entity in which the Group has an interest and, in the opinion of the directors, exercises joint control over its operating and financial policies. An interest exists where an investment is held on a long-term basis for the purpose of securing a contribution to the Group’s activities. Joint ventures are proportionately consolidated, whereby the Group’s consolidated income statement and balance sheet include the Group’s share of the income and assets on a line-by-line basis. An associate is an entity in which the Group has an interest and, in the opinion of the directors, can exercise significant influence, but not control, over its operating and financial policies. An interest exists where an investment is held on a long-term basis for the purpose of securing a contribution to the Group’s activities. Significant influence generally exists where the Group holds more than 20% and less than 50% of the shareholders’ voting rights. Associates are accounted for under the equity method whereby the Group’s consolidated income statement includes its share of their profits and losses and the Group’s consolidated balance sheet includes its share of their net assets. Foreigncurrencies In individual entities, transactions denominated in foreign currencies are recorded at the prior month closing exchange rate between the functional currency and the foreign currency. At each end of the reporting period, monetary assets and liabilities that are denominated in foreign currencies are retranslated at the rates prevailing at the end of the reporting period. Exchange differences are recognised in the consolidated income statement, except for exchange differences arising on non-monetary assets and liabilities where these form part of the net investment of an overseas business or are designated as hedges of a net investment or cash flow and, therefore, the changes in value are recognised directly in other comprehensive income. Non-monetary assets and liabilities carried at fair value that are denominated in foreign currencies are translated at the rates prevailing at the date when the fair value was determined. On consolidation, the results of businesses with non-pound sterling functional currencies are translated into the presentational currency of the Group at the average exchange rates for the period where these approximate to the rate at the date of the transactions. Assets and liabilities of overseas businesses are translated into the presentational currency of the Group at the exchange rate prevailing at the end of the reporting period. Exchange differences arising are recognised within other comprehensive income. Cumulative translation differences arising after the transition to IFRS are taken to the consolidated income statement on disposal of the net investment. Goodwill and fair value adjustments arising onthe acquisition ofa non-poundsterling entityare treated asassets and liabilities ofthatentity and translatedintothe presentationalcurrency ofthe Groupattheperiod closing rate.Whereapplicable, the Group haselected to treat goodwill and fair valueadjustmentsarising beforethedate oftransitiontoIFRSas denominatedinthe presentationalcurrency oftheGroup. In the consolidated statement of cash flows, cash flows denominated in foreign currencies are translated into the presentational currency of the Group at the average exchange rate for the year or at the rate prevailing at the time of the transaction where more appropriate. Recentaccountingdevelopments The following new standards and amendments to standards are mandatory for the first time for the financial year beginning 1 April 2010 and are considered relevant to the Group. − IFRS3 (revised), ‘Business Combinations’ and consequential amendments to IAS27, ‘Consolidated and Separate Financial Statements’, IAS28, ‘Investments in Associates’, and IAS31, ‘Interests in Joint Ventures’. These changes apply to the Group prospectively for business combinations enacted on or after 1 April 2010. The revised standard continues to apply the acquisition method to business combinations, with some significant changes. For example, all payments to purchase a business are recorded at fair value at the acquisition date, with contingent payments classed as debt subsequently remeasured through the consolidated income statement. There is a choice on an acquisition-by-acquisition basis to measure the non-controlling interest in the acquiree either at fair value or at the non-controlling interest’s proportionate share of the acquiree’s net assets. All acquisition-related costs should be expensed. The Group expects that the impact on results will depend on the nature of transactions undertaken by the Group. Contingent deferred consideration payable arising from acquisitions enacted before 1 April 2010 will be remeasured in accordance with IFRS3 as movements to goodwill and not through the consolidated income statement as required by IFRS3 (revised).
  • 19. Basis of preparation continued 7 Recentaccountingdevelopments-continued − The amendments to IAS27 have also resulted in changes to the Group’s accounting policies. Previously transactions with non- controlling interests were treated as transactions with parties external to the Group. Disposals therefore resulted in gains or losses in the consolidated income statement and purchases resulted in the recognition of goodwill. On disposal or partial disposal, a proportionate interest in reserves attributable to the subsidiary was reclassified to the consolidated income statement or directly to retained earnings. Previously, when the Group ceased to have control or significant influence over an entity, the carrying amount of the investment at the date control or date when significant influence was lost, became its cost for the purposes of subsequently accounting for the retained interests as associates, jointly controlled entities or financial assets. The Group has applied the new policy prospectively to transactions occurring on or after 1 April 2010. As a consequence, no adjustments were necessary to any of the amounts previously recognised in the consolidated financial statements. A number of other interpretations and amendments to existing standards have been made by the IASB and IFRIC but are not considered relevant to the Group’s operations. The following new standards and amendments to standards and interpretations have been issued, but are not effective for the financial year beginning 1 April 2010 and have not been early adopted: − Revised IAS24 ‘Related Party Disclosures’ was issued in November 2009 and is required to be applied for accounting periods on or after 1 January 2011. It supersedes IAS24 ‘Related Party Disclosures’ issued in 2003. The impact of the adoption of the standard will result in minor changes to the disclosure. − IFRS9 ‘Financial Instruments’ addresses clarification and measurement of financial assets, as the first phase of the replacement of IAS39 ‘Financial Instruments: Recognition and Measurement’ and is effective for annual periods beginning after 1 January 2013, subject to EU endorsement. The impact on the Group’s financial statements of the future adoption of the standard is still under review. Financialriskmanagement The Group operates internationally and is exposed to a variety of financial risks including currency, interest rate, market price, liquidity and credit. The Group’s overall financial risk management programme focuses on the unpredictability of financial markets and seeks to minimise potential adverse effects on the Group’s financial performance by using derivative instruments to lower funding costs, alter interest rate exposures arising as a result of mismatches between assets and liabilities or to achieve greater certainty of future costs. The use of derivatives forms part of the Group’s overall risk management framework as determined by the board through the Group risk and capital committee (GRACC). The Group’s funding and exposure to interest rate and FX rate risk are managed by the Group’s treasury function in accordance with a policy framework approved by the GRACC. The framework lays out the Group’s appetite for risk and the steps to be taken to manage these risks. The GRACC receives bi-monthly reports on the activities of the treasury function and is also responsible for approving significant transactions such as new financing arrangements or changes to the Group’s hedging strategy. The GRACC sets and monitors treasury’s counterparty limits in conjunction with the risk team. The Group’s exposure to market price risk arises mainly through counterparties to matched principal and exchange traded transactions failing to fulfil their obligations or through trade mismatches and other errors. In matched principal transactions, the Group acts as an intermediary by serving as counterparty for identified buyers and sellers in matching, in whole or in part, reciprocal back-to-back trades. In order to facilitate customer transactions and provide liquidity, the Group may participate in certain marketplaces by posting quotations. On occasion, the act of posting quotations in pursuit of customer orders can result in the Group becoming principal to unmatched trades. In exchange traded transactions, the Group executes the trade as principal and then novates the contract to its client. A failure by the client to accept the trade would result in the Group becoming exposed to market price risk. The market risk the Group faces in these situations is restricted to short-term price movements in the underlying instrument temporarily held by the Group and movements in FX rates. Any such market price risk arising is identified, monitored and reported to senior management on a daily basis and to the GRACC. Policies and procedures are in place to reduce the likelihood of such trade mismatches and, in the event that they arise, the Group’s policy is to liquidate or hedge and liquidate these principal positions as soon as reasonably practicable. The Company is not exposed to market price risk as it holds no listed investments, and has no trading activity.
  • 20. Notes to the financial statements 8 1 Segmentalinformation The Group has determined its operating segments based on the management information reviewed on a regular basis by the Company’s board. The Group considers the executive members of the Company’s board to be the Chief Operating Decision Maker (CODM). The CODMcurrentlyconsiders the businessto consist ofcore and new business elements,although expects the new business segment tobe incorporated into core next year. Thecorebusiness consists ofregional voicebrokerage businesses inEMEA, the Americasand AsiaPacific, a globalelectronic brokeragebusiness active in fixedincome interest ratederivatives and FXmarkets anda globalposttrade risk and information business. Eachofthese fivebusiness areasare managed and reviewedby the CODM ona stand-alone basisand,as such,are considered segments. Inaddition,the CODMseparately manages and reviewsa portfolioof new business initiatives,currently comprising new voice broking businesses,whichwere eitheracquired orstartedduring thecourse ofthe pasttwo financialyears. TheGroup reviewsthecomposition ofthe operating segments at thebeginning of eachfiscalyearto determine whetherthey remainappropriate. Anychanges wouldresultin restatement ofthe figures reported inthe prior year forcomparative purposes. Revenue comprises commission from the Group’s core voice business, brokerage or access fees from its electronic business and fees from the provision of post trade risk and information. Corevoicebroking Matched principal and stock lending business Certain Group companies are involved in a non-advisory capacity as principals in the matched purchase and sale of securities and other financial instruments between our customers. Revenue is generated from the difference between the purchase and sale proceeds and is recognised in full at the time of the commitment by our customers to sell and purchase the security or financial instrument. The revenue generated by the stock lending business is not material to the Group. Agency business (name give-up transactions) The Group acts in a non-advisory capacity to match buyers and sellers of financial instruments and raises invoices for the service provided. The Group does not act as principal in name give-up transactions and only receives and transmits orders between counterparties. Revenue is stated net of rebates and discounts, value added tax and other sales taxes and is recognised in full on the date of the trade. Amounts receivable at the year end are reported as other trade receivables within trade and other receivables. For the shipbroking business, the Group acts in a non-advisory capacity to match buyers and sellers of services and recognises revenue, net of rebates and discounts, value added tax and other sales taxes when the Group has a contractual entitlement to commission, normally the point at which there is a completion of contractual terms between the principals of a transaction. Amounts receivable at the year end are reported as other trade receivables within trade and other receivables. Execution on exchange business TheGroupalsoactsasabrokerofexchangelistedproducts,wheretheGroupexecutescustomerordersasprincipalandthennovatesthetradeto theunderlyingcustomers’respectiveclearingbrokerforsettlement.Revenueisgeneratedfromeitherthedifferencebetweenthepurchaseand saleproceedsorbyinvoice,dependingontheproduct,marketandagreementsinplacewiththecustomerandisrecognisedonthetradedate. Electronicbroking The Group acts as a broker for FX, interest rate derivatives, fixed income products and CDS through the Group’s electronic platforms. Revenue is generated from brokerage fees which are dependent on the customer's global coverage and average trading volumes. The Group also charges fees to use the electronic trading platform for access to liquidity in the FX or precious metal markets. Posttraderiskandinformation The Group receives fees from the sale of financial information and provision of post trade risk and information to third parties. These are stated net of value added tax, rebates and other sales taxes and recognised in revenue on an accruals basis to match the provision of the service. Amounts receivable at the year end are reported as other trade receivables within trade and other receivables. Reorganisationofportfolio The new business segment principally consists of Brazil, intellectual property, base metals, UK and Asia financial futures. Fortheperiod commencing1April2010,LinkandICAPShippinghavebeenmovedoutofthenewbusinesssegmentastheyarenolongernewtotheGroup. Linkhasbeensplitbetweeneachofthethreecorevoicesegments.ICAPShippingisnowincludedwithinEMEAvoicebroking.Comparativeshave beenre-presentedtoshowtheimpact.EachoftheoperatingsegmentsoftheGroupismanagedonaday-to-daybasisbyoneormoremembers oftheGEMG,whichconsistsofbothmembersoftheboardandotherseniormanagement.Themanagementofnewbusinessesisdependenton whichcoreareathebusinesswilleventuallybecomepartof.TriOptima,acquiredon24March2010,isincludedwithinposttraderiskand informationandnotasanewbusiness,astheGroupheldaminorityinterestpriortotheacquisitionandhashadasignificantinfluenceoverthe businesssinceinception. As a result of the decreasing number of new businesses set-up or established over the past two financial years, it is planned to discontinue the new business segment for the year ending 31 March 2012 and instead to combine the initiatives into the segment operated by the appropriate member of the GEMG. The decision to no longer report the new business segment reflects management’s decision 12 months ago to focus on organic expansion and developing partnerships with customers. This has resulted in a low level of new business initiatives which do not otherwise meet the criteria to be reported under the core segments. No longer presenting new businesses separately will result in the other segments initially showing lower margins while businesses such as Brazil move towards operational maturity.
  • 21. Notes to the financial statements continued 9 1 Segmentalinformationcontinued The Group continues to disclose an operating segment for the voice broking business in Asia Pacific even though this segment does not meet the quantitative thresholds to be mandatory under IFRS8 ‘Operating Segments’. This is to reflect the importance of the Asia Pacific region to the Group and the way the segment is managed. Yearended31March2011 Corevoicebroking EMEA £m Americas £m AsiaPacific £m Electronic broking £m Posttrade riskand information £m New businesses £m Total £m Continuingoperations Revenue 578 471 134 302 184 72 1,741 Operatingprofitbeforeacquisitionand disposalcostsandexceptionalitems 114 83 (3) 123 79 (21) 375 Reconciliationtotheconsolidated incomestatement: Acquisitionanddisposalcosts (88) Exceptionalitems (3) Operatingprofit 284 Financeincome 5 Financecosts (53) Shareoflossofassociatesaftertax (3) Profitbeforetaxfromcontinuingoperations 233 Tax (50) Profitfortheyearfromcontinuing operations 183 Profitaftertaxfromdiscontinuedoperations 4 Profitfortheyear 187 Details of total gross debt and total cash reviewed by the CODM can be found in notes 8(c) and 7(c) respectively. Yearended31March2010 Corevoicebroking EMEA £m Americas £m AsiaPacific £m Electronic broking £m Posttrade riskand information £m New businesses £m Total £m Continuingoperations Revenue 570 460 127 252 142 54 1,605 Operatingprofitbeforeacquisitionand disposalcostsandexceptionalitems 119 83 7 100 69 (24) 354 Reconciliationtotheconsolidatedincome statement: Acquisitionanddisposalcosts (61) Exceptionalitems (26) Operatingprofit 267 Financeincome 7 Financecosts (35) Shareofprofitofassociatesaftertax 8 Profitbeforetaxfromcontinuing operations 247 Tax (83) Profitfortheyearfromcontinuing operations 164 Lossaftertaxfromdiscontinued operations (48) Profitfortheyear 116
  • 22. Notes to the financial statements continued 10 1 Segmentalinformationcontinued Revenue earned by product type from continuing operations is disclosed below: Yearended 31March 2011 £m Yearended 31March 2010 £m Rates 695 630 FX 321 292 Commodities 213 175 Emergingmarkets 191 141 Credit 185 204 Equities 136 163 Totalrevenue 1,741 1,605 The Group did not earn more than 10% of its total revenue from any individual customer. The Group earned revenue of £602m (2010 – £581m) and £637m (2010 – £594m) from entities in the UK and US respectively. The remainder of £502m (2010 – £430m) came from various entities from outside the UK and US. The amortisation and impairment arising from development expenditure recognised by the Group on a segment basis is as follows: core voice broking EMEA £7m (2010 – £6m), core voice broking the Americas £15m (2010 – £13m), core voice broking Asia Pacific £nil (2010 – £nil), electronic broking £3m (2010 – £1m), post trade risk and information £4m (2010 – £2m) and new businesses £nil (2010 – £1m). The depreciation of property and equipment recognised by the Group on a segment basis is as follows: core voice broking EMEA £10m (2010 – £7m), core voice broking the Americas £9m (2010 – £8m), core voice broking Asia Pacific £2m (2010 – £2m), electronic broking £2m (2010 – £3m), post trade risk and information £1m (2010 – £1m) and new businesses £1m (2010 – £1m). 2 Earningspershare The Group presents basic and diluted EPS data for its ordinary shares. Basic EPS is calculated by dividing the profit or loss attributable to ordinary shareholders of the Company by the weighted average number of ordinary shares outstanding during the year, adjusted for own shares held. The Group also calculates adjusted EPS from the adjusted profit which is defined as profit from operations before the effect of acquisition and disposal costs and exceptional items. The Group believes that this is the most appropriate measurement since it better reflects the business’s underlying cash earnings. The Group is required to disclose basic and diluted EPS on the face of the consolidated income statement and has further analysed this to show the adjusted EPS for continuing operations. The weighted average number of ordinary shares in issue excludes the weighted average number of shares held as Treasury Shares of 4m (2010 – 2m) and those owned by employee share trusts relating to employee share schemes on which dividends have been waived, being 6m shares (2010 – 9m). The Group has also disclosed the impact of discontinued operations on the basic, diluted and adjusted EPS.
  • 23. Notes to the financial statements continued 11 2 Earningspersharecontinued (a)EPSrelatingtotheGroup’stotaloperations Yearended31March2011 Yearended31March2010 Basicanddiluted Earnings £m Shares millions Earnings pershare pence Earnings £m Shares millions Earnings pershare pence Basic 187 652 28.7 116 643 18.0 Dilutiveeffectofshareoptions – 10 (0.5) – 11 (0.3) Dilutedbasic 187 662 28.2 116 654 17.7 Yearended31March2011 Yearended31March2010* Adjustedbasicanddiluted Earnings £m Shares millions Earnings pershare pence Earnings £m Shares millions Earnings pershare pence Basic 187 652 28.7 116 643 18.0 Acquisitionanddisposalcosts 62 – 9.5 42 – 6.5 Exceptionalitemsnetoftax(note5) 11 – 1.7 52 – 8.1 Adjustedbasic 260 652 39.9 210 643 32.6 Dilutiveeffectofshareoptions – 10 (0.6) – 11 (0.5) Adjusteddiluted 260 662 39.3 210 654 32.1 *Adjusted basic anddiluted EPS havebeen re-presentedto reflect the changein definitionofthe column‘acquisition and disposal costs’inthe consolidatedincome statement. (b)EPSrelatingtotheGroup’scontinuingoperations Yearended31March2011 Yearended31March2010 Basicanddiluted Earnings £m Shares millions Earnings pershare pence Earnings £m Shares millions Earnings pershare pence Basic 183 652 28.1 164 643 25.5 Dilutiveeffectofshareoptions – 10 (0.5) – 11 (0.4) Dilutedbasic 183 662 27.6 164 654 25.1 Yearended31March2011 Yearended31March2010* Adjustedbasicanddiluted Earnings £m Shares millions Earnings pershare pence Earnings £m Shares millions Earnings pershare pence Basic 183 652 28.1 164 643 25.5 Acquisitionanddisposalcosts 62 – 9.5 42 – 6.5 Exceptionalitemsnetoftax(note5) 15 – 2.3 22 – 3.4 Adjustedbasic 260 652 39.9 228 643 35.4 Dilutiveeffectofshareoptions – 10 (0.6) – 11 (0.5) Adjusteddiluted 260 662 39.3 228 654 34.9 *Adjusted basic anddiluted EPS havebeen re-presentedto reflect the changein definitionofthe column‘acquisition and disposal costs’inthe consolidatedincome statement.
  • 24. Notes to the financial statements continued 12 2 Earningspersharecontinued (c)EPSrelatingtotheGroup’sdiscontinuedoperations Yearended31March2011 Yearended31March2010 Basicanddiluted Earnings £m Shares millions Earnings pershare pence Earnings £m Shares millions Earnings pershare pence Basic 4 652 0.6 (48) 643 (7.5) Dilutiveeffectofshareoptions – 10 – – 11 0.1 Dilutedbasic 4 662 0.6 (48) 654 (7.4) Yearended31March2011 Yearended31March2010 Adjustedbasicanddiluted Earnings £m Shares millions Earnings pershare pence Earnings £m Shares millions Earnings pershare pence Basic 4 652 0.6 (48) 643 (7.5) Exceptionalitemsnetoftax(note5) (4) – (0.6) 30 – 4.7 Adjustedbasic – 652 – (18) 643 (2.8) Dilutiveeffectofshareoptions – 10 – – 11 – Adjusteddiluted – 662 – (18) 654 (2.8) 3 Dividendspayable The Company recognises the final dividend payable only when it has been approved by the shareholders of the Company in a general meeting. The interim dividend is recognised when the amount due has been paid. Amountsrecognisedasdistributionstoequityholdersintheyear: Yearended 31March 2011 £m Yearended 31March 2010 £m Finaldividendfortheyearended31March2010of12.44pperordinaryshare(2009–12.35p) 81 79 Interimdividendfortheyearended31March2011of5.27pperordinaryshare(2010–5.11p) 34 33 Totaldividendrecognisedinyear 115 112 The final dividend for the year ended 31 March 2010 was satisfied with a cash payment of £56m and a scrip dividend of 6,267,039 ICAP ordinary shares issued at £3.985 (value £25m). The directors have proposed a final dividend of 14.68p per share for the year ended 31 March 2011. This has not been recognised as a liability of the Group at the year end as it has not yet been approved by shareholders. Based on the number of shares in issue at the year end, the total amount payable would be £96m. No scrip dividend alternative was offered in relation to the interim dividend for the year ended 31 March 2011. The right to receive dividends has been waived in respect of the shares held in employee share trusts and no dividend is payable on Treasury Shares.
  • 25. Notes to the financial statements continued 13 4 Tax Tax on the profit for the year comprises both current and deferred tax as well as adjustments in respect of prior years. Tax is charged or credited to the consolidated income statement, except when it relates to items charged or credited to other comprehensive income or directly to equity, in which case the tax is also included in other comprehensive income or directly within equity, respectively. Current tax is the expected tax payable on the taxable income for the period, using tax rates enacted, or substantively enacted by the end of the reporting period. Deferred tax is recognised using the liability method, in respect of temporary differences between the carrying value of assets and liabilities for reporting purposes and the amounts charged or credited for tax purposes. Deferred tax is calculated at the rate of tax expected to apply when the liability is settled or the asset is realised. A deferred tax asset is recognised only to the extent that it is probable that future taxable profits will be available against which the asset can be utilised. Deferred tax is provided on temporary differences arising on investments in subsidiaries, joint ventures, associates and intangibles arising on consolidation, except where the timing of the reversal of the temporary difference is controlled by the Group and it is probable that the temporary difference will not reverse in the foreseeable future. No provision is made in respect of any further tax liability that would arise on the distribution of retained earnings of overseas joint ventures and associates. Deferred tax liabilities are offset against deferred tax assets within the same taxable entity or qualifying local tax group where there is both the legal right and the intention to settle on a net basis or to realise the asset and settle the liability simultaneously. Significant judgement is required in determining the Group’s income tax liabilities. In arriving at the current and deferred tax liability the Group has taken account of tax issues that are subject to ongoing discussions with the relevant tax authorities. Calculations of these liabilities have been based on management’s assessment of legal and professional advice, case law and other relevant guidance. Where the expected tax outcome of these matters is different from the amounts that were recorded initially, such differences will impact the current and deferred tax amounts in the period in which such determination is made. Taxchargedtotheconsolidatedincomestatementintheyear Yearended 31March 2011 £m Yearended 31March 2010 £m Currenttax –currentyear 111 98 –doubletaxrelief (1) (1) –adjustmenttoprioryears (26) (5) 84 92 Deferredtax –deferredtaxonoriginationandreversaloftimingdifferences (33) (9) –deferredtaximpactofchangesintaxrates (1) - (34) (9) Totaltaxchargedtoconsolidatedincomestatement–continuingoperations 50 83 Taxcharge/(credited)totheconsolidatedincomestatementfordiscontinuedoperationscanbe analysedasfollows: Taxcreditondiscontinuedoperations,excludingexceptionalitems – (7) Taxcharge/(credited)onexceptionalitems–discontinuedoperations 2 (11) Totaltaxcharge/(credited)totheconsolidatedincomestatement–discontinuedoperations 2 (18) Totaltaxchargedtotheconsolidatedincomestatement 52 65 Taxchargedtotheconsolidatedincomestatementforcontinuingoperationscanbeanalysedas follows: Totaltaxchargedtotheconsolidatedincomestatement–continuingoperations 50 83 Taxcreditonacquisitionanddisposalcosts 32 20 Taxcreditonexceptionalitems–continuingoperations 8 4 Taxonprofitbeforeacquisitionanddisposalcostsandexceptionalitems 90 107 The Group’s share of profit of associates in the consolidated income statement is shown net of tax of £2m (2010 – £3m). The Group’s effective tax rate is reduced by 6% to 26% (2010 – 32%), due to a one-off settlement reached with tax authorities.
  • 26. Notes to the financial statements continued 14 4 Taxcontinued Taxcharged/(credited)toequityintheyear Yearended 31March 2011 £m Yearended 31March 2010 £m Currenttaxcreditonshare-basedpayments (3) (9) Currenttaxchargeonexchangeadjustments 2 2 Currenttaxchargeonhedginginstruments 2 12 Netcurrenttaxonitemsrecognisedinequity 1 5 Deferredtaxchargeonshare-basedpayments – 1 Netdeferredtaxonitemsrecognisedinequity – 1 The Group’s tax charge was lower than the UK statutory rate and can be reconciled as follows: Yearended 31March 2011 £m Yearended 31March 2010 £m Profitbeforetaxfromcontinuingoperations 233 247 TaxonprofitatthestandardrateofCorporationTaxintheUKof28%(2010–28%) 65 69 Expensesnotdeductiblefortaxpurposes 14 12 Adjustmentstodeferredtaxinrespectofprioryears (9) (1) Adjustmentsinrespectofforeigntaxrates 7 10 Adjustmentstocurrenttaxinrespectofprioryears (26) (5) Adjustmentsinrespectofassociates (1) (2) Taxchargefromcontinuingoperations 50 83 Previously unrecognised losses with a tax value of £1m (2010 - £1m) have been utilised against German profits in the year. In addition to the changes in rates of Corporation Tax that were announced in the Finance Act 2010 which saw the main rate of Corporation Tax reduced to 27% from 1 April 2011, a number of further changes to the UK Corporation Tax system were announced in the March 2011 UK Budget Statement. A resolution passed by Parliament on 29 March 2011 reduced the main rate of Corporation Tax to 26% from 1 April 2011. As a result of this change, the Group's deferred tax liability has been reduced by £2m. Legislation to reduce the main rate of Corporation Tax from 26% to 25% from 1 April 2012 is expected to be included in the Finance Act 2011. Further reductions to the main rate are proposed to reduce the rate by a further 1% per annum to 23% by 1 April 2014. These changes had not been substantively enacted at the balance sheet date and are not included in the tax charge for the period. The reduction to 23% is not expected to have a material impact on the deferred tax balances.
  • 27. Notes to the financial statements continued 15 4 Taxcontinued Deferredtax–Group The movement in deferred tax balance is as follows: Goodwill £m Intangible assets arisingon consolidation £m Employee- related items £m Deferred incomeand accrued expenses £m Losses carried forward £m Other £m Total £m Netbalancesat31March2009 (11) (139) 18 8 8 (8) (124) Tax(charge)/credit (23) 19 (1) 2 (6) 18 9 Acquisition – (31) – – – – (31) Reserves (1) – – – – – (1) FX (1) 7 (1) 2 – – 7 (36) (144) 16 12 2 10 (140) Deferredtaxassetsat31March2010 7 – 28 18 2 10 65 Deferredtaxliabilitiesat31March2010 (43) (144) (12) (6) – – (205) Netbalancesat31March2010 (36) (144) 16 12 2 10 (140) Tax(charge)/credit (8) 32 4 (5) 8 3 34 Reserves – – 4 1 – (5) – FX 2 5 – (1) – – 6 (42) (107) 24 7 10 8 (100) Deferredtaxassetsat31March2011 13 1 44 10 10 21 99 Deferredtaxliabilitiesat31March2011 (55) (108) (20) (3) – (13) (199) Netbalancesasat31March2011 (42) (107) 24 7 10 8 (100) Deferredtaxbalancesafteroffsetofbalanceswithincountries Yearended 31March 2011 £m Yearended 31March 2010 £m Deferredtaxassets 17 34 Deferredtaxliabilities (117) (174) Netbalances (100) (140) Deferred tax assets of £5m have been re-instated in respect of German losses remaining unutilised at the year end. Deferred tax assets of £8m (2010 – £6m) have not been recognised in respect of certain trading losses because it is not probable that future profit will be available against which the Group can utilise the benefits. The principal movement in deferred tax relates to the ongoing release of the deferred tax liability on the amortisation of intangibles arising on consolidation.
  • 28. Notes to the financial statements continued 16 5 Exceptionalitems Exceptional items are significant items of a non-recurring nature and considered material in both size and nature. These are disclosed separately to enable a full understanding of the Group’s financial performance. Transactions which may give rise to exceptional items are principally gains and losses on disposal of investments and other large gains and losses not attributable to the normal course of the Group’s activities. These are shown as ‘exceptional items’ on the face of the consolidated income statement. Yearended 31March 2011 £m Yearended 31March 2010 £m Exceptionalitems–continuingbusinesses Totalexceptionalitemsbeforetax–continuingbusiness (23) (26) Tax 8 4 Totalexceptionalitemsaftertax–continuingbusinesses (15) (22) Exceptionalitems–discontinuedbusiness Totalexceptionalitemsbeforetax-discontinuedbusiness 6 (41) Tax (2) 11 Totalexceptionalitemsaftertax–discontinuedbusiness 4 (30) For the year ended 31 March 2011, the Group recognised an exceptional pre-tax charge in its continuing business of £23m in respect of the recoverability of the loans made to a number of associates active in non-core agency voice markets (£20m) and SEC settlement- related costs (£3m). During the twelve months to 31 March 2010, the Group recognised a pre-tax exceptional charge of £26 million in respect of settling the SEC matter (£21m) and the continuing cash equities business (£5m). A post-tax credit of £4m relating to a reversal of a prior year exceptional charge (2010 – £nil) was also recognised for the year ended 31 March 2011. For the 12 months to 31 March 2010, the Group recognised a post-tax exceptional charge of £30m in respect of the closure of its European and Asia Pacific full service agency cash equities businesses.
  • 29. Notes to the financial statements continued 17 6 Operatingexpenses Profitbeforetaxfromcontinuingoperationsisstatedaftercharging: Yearended 31March 2011 £m Yearended 31March 2010 £m Employeecosts 1,001 950 Informationtechnologycosts 163 141 Amortisationandimpairmentofintangibleassetsarisingonconsolidation 84 61 Professionalandlegalfees(includingauditors’remuneration) 20 20 Amortisationandimpairmentofintangibleassetsarisingfromdevelopmentexpenditure 29 23 Depreciationofpropertyandequipment 25 22 Governancecosts* 13 8 Clearingandsettlementfees 19 18 Operatingleaserentals–minimumleasepayments 23 23 Exchangeadjustments 6 7 Other** 95 84 Total 1,478 1,357 Auditors’remuneration FeespayabletotheCompany’sauditorfortheauditoftheCompany’sannualfinancialstatements 0.4 0.5 FeespayabletotheCompany’sauditorforotherservices: –fortheauditoftheCompany’ssubsidiaries 3.2 2.6 –regulatory 1.4 0.3 –taxservices 0.7 0.5 –corporatefinanceservices 0.1 0.2 –other 0.3 0.1 6.1 4.2 * Governance costs include feesassociated with risk, compliance, internal audit andlegal. ** Other includes exceptional costs(note5)of £3m (2010 –£26m). Contractualarrangements The Group places reliance on a number of key suppliers to carry out its business effectively and has procedures to ensure that purchasing decisions balance cost against other factors including service quality, global reach and resilience. The success of ICAP’s core voice broking business is reliant on its ability to attract and retain highly qualified staff. Staff costs represent approximately 68% of total costs. A number of legal arrangements, including rolling term contracts and non-compete arrangements, are employed to mitigate the risk of key staff being lost to competitors. Information technology costs which represent approximately 11% of total costs are key to the delivery of both voice and electronic products. The Group seeks to ensure that its systems have full redundancy and are capable of operating from business continuity sites. The balance of costs represent premises, governance, clearing and other costs. These represent 21% of total costs. The settlement of matched principal and exchange traded businesses requires access to clearing houses either directly or through third party providers of clearing and settlement services. In North America the Group is a member of the FICC and NSCC through which it clears US Treasury products, agency, mortgage and equity trades for its customer base. In Europe and Asia Pacific, with the exception of base metal clearing on LCH.Clearnet Group Ltd, the majority of the Group’s clearing activities are outsourced to third parties where ICAP seeks to partner with one of the leading clearing providers in each market.
  • 30. Notes to the financial statements continued 18 7 Cash Cash and cash equivalents comprise cash on hand, demand deposits and other short-term highly liquid investments which are subject to insignificant risk of change in fair value and are readily convertible into a known amount of cash with less than three months maturity. The Group holds money, and occasionally financial instruments, on behalf of customers (client monies) in accordance with local regulatory rules. Since the Group is not beneficially entitled to these amounts, they are excluded from the consolidated balance sheet along with the corresponding liabilities to customers. Restricted funds are comprised of cash held with a CCP clearing house, or a financial institution providing ICAP with access to a CCP, and funds set aside for regulatory purposes, but excluding client money. The funds represent cash for which the Group does not have immediate and direct access or for which regulatory requirements restrict the use of the cash. (a)ReconciliationofGroupprofitbeforetaxtonetcashflowfromoperatingactivities Group Yearended 31March 2011 £m Group Yearended 31March 2010 £m Profitbeforetaxfromcontinuingoperations 233 247 Profit/(loss)beforetaxfromdiscontinuedoperations 6 (66) Discontinuedoperationsexceptionalitem(note5) (6) 41 Operatingexceptionalitems 23 26 Shareofoperatingprofitsofassociatesaftertax (3) (7) Amortisationandimpairmentofintangibleassetsarisingonconsolidation 84 61 Amortisationandimpairmentofintangibleassetsarisingfromdevelopmentexpenditure 29 23 Depreciationofpropertyandequipment 25 22 Otheramortisationandimpairments 10 4 Share-basedpayments 8 10 Netfinanceexpense 28 28 Operatingcashflowsbeforemovementsinworkingcapital 437 389 (Increase)/decreaseintradeandotherreceivables (66) 26 Decrease/(increase)inrestrictedfunds 6 (1) Decreaseintradeandotherpayables (14) (53) Netreceiptsinrespectoffinancialassetsheldatfairvalue – 4 Cashgeneratedbyoperationsbeforeexceptionalitems 363 365 Operatingexceptionalitemspaid (21) (21) Cashgeneratedbyoperations 342 344 Interestreceived 3 3 Interestpaid (30) (17) Taxpaid (59) (55) Netcashflowfromoperatingactivities 256 275 The movement in trade and other receivables and trade and other payables excludes the impact of the gross-up of matched principal trades as permitted by IAS7 ‘Statement of Cash Flows’. The gross-up has no impact on the cash flow or net assets of the Group. The cash flow movement in trade and other receivables includes the net movement on matched principal transactions and deposits for securities borrowed/loaned. The movement for the year ended 31 March 2011, after accounting for acquisitions, is an outflow of £18m (2010 inflow of £20m).