1. 1
The EU Craft and SME Barometer 2015/H1
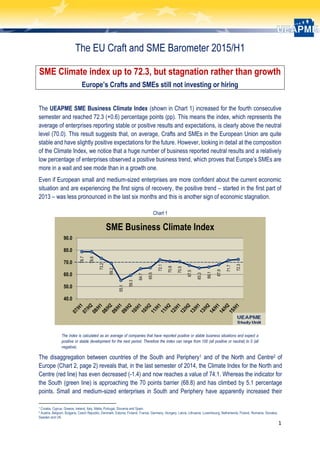
SME Climate index up to 72.3, but stagnation rather than growth
Europe’s Crafts and SMEs still not investing or hiring
The UEAPME SME Business Climate Index (shown in Chart 1) increased for the fourth consecutive
semester and reached 72.3 (+0.6) percentage points (pp). This means the index, which represents the
average of enterprises reporting stable or positive results and expectations, is clearly above the neutral
level (70.0). This result suggests that, on average, Crafts and SMEs in the European Union are quite
stable and have slightly positive expectations for the future. However, looking in detail at the composition
of the Climate Index, we notice that a huge number of business reported neutral results and a relatively
low percentage of enterprises observed a positive business trend, which proves that Europe’s SMEs are
more in a wait and see mode than in a growth one.
Even if European small and medium-sized enterprises are more confident about the current economic
situation and are experiencing the first signs of recovery, the positive trend – started in the first part of
2013 – was less pronounced in the last six months and this is another sign of economic stagnation.
Chart 1
The index is calculated as an average of companies that have reported positive or stable business situations and expect a
positive or stable development for the next period. Therefore the index can range from 100 (all positive or neutral) to 0 (all
negative).
The disaggregation between countries of the South and Periphery1 and of the North and Centre2 of
Europe (Chart 2, page 2) reveals that, in the last semester of 2014, the Climate Index for the North and
Centre (red line) has even decreased (-1.4) and now reaches a value of 74.1. Whereas the indicator for
the South (green line) is approaching the 70 points barrier (68.8) and has climbed by 5.1 percentage
points. Small and medium-sized enterprises in South and Periphery have apparently increased their
1 Croatia, Cyprus, Greece, Ireland, Italy, Malta, Portugal, Slovenia and Spain.
2 Austria, Belgium, Bulgaria, Czech Republic, Denmark, Estonia, Finland, France, Germany, Hungary, Latvia, Lithuania, Luxembourg, Netherlands, Poland, Romania, Slovakia,
Sweden and UK.
78.7
78.6
73.2
69.2
55.1
59.3
64.7
65.5
72.1
70.8
70.5
67.5
65.3
66.1
67.9
71.7
72.3
40.0
50.0
60.0
70.0
80.0
90.0
SME Business Climate Index
2. 2
confidence about the current situation and it seems that they are coming out of the last economic
recession, that is why we should expect more signs of recovery from this area. The inflection in the North
trend is mainly driven by a deep decrease in confidence in some countries, specifically in those where
social and economic reforms have not been implemented.
Chart 2
Table 1: trend in the confidence gap between
North and South of the EU 2011-2015
North South Gap
11/H1 78. 9 51.7 27.2
11/H2 75.8 60.7 15.1
12/H1 75.9 58.3 17. 7
12H2 72.8 56.2 16.5
13H1 69.6 56.3 13.3
13H2 71.0 55.8 15.2
14H1 72.5 58. 5 14.0
14H2 75.5 63.7 11.8
15H1 74.1 68.8 5.3
As we can notice from Table 1, the sovereign debt crisis in early
2011 was characterised by an extremely high level in the
confidence gap between North and South countries and after the
peak (27.2), differences between the regions slightly decreased
but remained quite high throughout the last business cycle.
Nevertheless, SMEs in countries considered more vulnerable
during the debt crisis are growing and, in the previous semester,
experienced the first signs of a recovery. The imbalance between
the two macro regions has been diminished for the fourth
consecutive semester and reached, with 5.3, the lowest figure
since the beginning of the sovereign debt crisis. Reforms in most
of those countries are starting to pay off.
Contrary to the narrowing between the North and South, there are signs that a new imbalance within
Europe is appearing: looking at the countries with the lowest expected growth (GDP growth between 0%
and 1%3), the overall Climate Index is significantly below the neutral line, with a level of 63.4 (Chart 3,
page 3). This difference suggests that small businesses in countries that show deficits with the
implementation of reforms proposed by the European Commission in its “Country specific
recommendations4” suffer from stand-still. Moreover, as we can see from the graph below, the imbalance
between SMEs in these countries and in Europe overall is continuously increasing since the second half
of 2013 and has culminated to a level of 8.9.
3 Austria, Bulgaria, Croatia, Cyprus, Finland, France and Italy. Winter economic forecast, 2015 http://ec.europa.eu/economy_finance/eu/forecasts/2015_winter_forecast_en.htm
4 http://ec.europa.eu/europe2020/making-it-happen/country-specific-recommendations/index_en.htm
78.778.6
73.2
69.2
55.1
59.3
64.765.5
72.1
70.8
70.5
67.5
65.3
66.1 67.9
71.7
72.3
78.9
75.8
72.7
71.072.5
75.5
74.1
51.7
60.7
56.2 55.8
58.5
63.7
68.8
40.0
50.0
60.0
70.0
80.0
90.0
07/H1 07/H2 08/H1 08/H2 09/H1 09/H2 10/H1 10/H2 11/H1 11/H2 12/H1 12/H2 13/H1 13/H2 14/H1 14/H2 15/H1
SME Business Climate Index
CLIMATE INDEX
North
South
3. 3
Chart 3
Looking at Chart 4, where the UEAPME SME Business Climate Index (blue line) is compared to the
European Commission’s Economic Sentiment Indicator (ESI)5 (red line) and the Markit Purchasing
Managers' Index (PMI)6 (green line), we can observe that the three different measure of the economic
trend for enterprises are converging to a positive value. For the second consecutive semester, the
indicators are above the neutral stance and the PMI and ESI indices are narrowing. Given that bigger
businesses normally lead an economic recovery, this shows that SMEs have now caught up. The small
decrease in the ESI and PMI index probably reflects the economic stagnation which Europe has still to
face.
Chart 4
5 The EC’s ESI measures five confidence indicators linked to different sectors: Industrial Confidence Indicator; Services Confidence Indicator; Consumer Confidence Indicator;
Construction Confidence Indicator and Retail Trade Confidence Indicator. The average of last six months ESI values has been re-scaled to make it comparable with the UEAPME
SME Business Climate Index, with 70 as the long-term average/neutral value. http://ec.europa.eu/economy_finance/db_indicators/surveys/index_en.htm
6 The Markit Composite PMI measures new orders of large firms in manufacturing and services. The average of last six months PMI values has been re-scaled to make it comparable
with the UEAPME SME Business Climate Index, with 70 as the long-term average/neutral value.
66.1 67.9
71.7 72.3
65.4
62.6 62.6 63.4
40.0
50.0
60.0
70.0
80.0
90.0
13/H2 14/H1 14/H2 15/H1
Difference between low growth countries and EU
climate
index
climate
index for
low growth
countries
78.7
73.2
55.1
64.7
72.1
65.3
72.3
77.2
76.7
59.5
69.1
66.5
62.0
70.14
73.08
61.9
65.7
74.5 73.6
40.0
50.0
60.0
70.0
80.0
90.0
07/H1 08/H1 09/H1 10/H1 11/H1 12/H1 13/H1 14/H1 15/H1
SME Business Climate Index -EC ESI -Markit PMI
CLIMATE
INDEX
EC ESI
Markit PMI
4. 4
Main results: past optimism has not materialised, now stagnation
The EU Craft and SME Barometer presents the balance between positive and negative judgements from
SMEs for different business aspects, size classes and sectors. More on the methodology can be found
on page 10.
Second semester 2014 slightly worse than the first part of the year
Even if the results for the second semester 2014 have slightly improved for some business aspects –
such as employment, investment and orders – the results for turnover and prices turned negative as
illustrated in Chart 5 and also resulted in a negative development for the judgement of the overall situation.
All indicators are negative, and moreover employment, investment and ordersare still at low level (-3.4, -
8.3 and -8, respectively), in spite of their positive trend.
Chart 5 – Balance +/-
We should remark that those measures are a balance between positive and negative answers and that,
this semester, the majority of businesses reported all the indicators remain broadly the same as over the
past six months. Therefore, despite the worsening in the overall situation, this cooling of confidence after
two years of slow growth should be interpreted as dissapointing expectation, rather than as an indication
of an economic downturn. European SMEs, on average, are out of the last business cycle contraction
and are currently acting in a business environment characterised by an economic stagnation, with slow
growth and high level of unemployment. Given such an overall picture, we can figure out why employment
and investment are still at very low levels.
-1.0
-3.4 -5.1
-2.2
4.6
-11.3
-8.0
-2.6
-40.0
-35.0
-30.0
-25.0
-20.0
-15.0
-10.0
-5.0
0.0
5.0
10.0
15.0
SME main results
Overall situation
Turnover
Employment
Prices
Investments
Orders
5. 5
Results for 2014/H2 did not confirm positive expectations six months ago
Looking at Table 2, where the results of the second semester of 2014 are compared to expectations
enterprises had six months before, we can observe that every business indicator has been overestimated:
SME expectations from six months ago did not materialise.
In particular, we can observe that orders and turnover are respectively 11.9 and 8.3 percentage points
lower than what was initially imagined by small and medium-sized enterprises, while employment
remained fairly stable (-0.9).
Table 2: difference between expectations and final results for 14H2
and expectations for 15/H1
14/H2e 14/H2 Δ(R-E) 15/H1e
Situation 6.5 -3.1 -9.6 -2.6
Turnover 5.8 -2.5 -8.3 -1.0
Employment -2.5 -3.4 -0.9 -5.1
Prices 4.4 -2.2 -6.6 4.6
Investments -5.8 -8.3 -2.4 -11.3
Orders 3.9 -8.0 -11.9 -2.6
On balance, 3.1% of firms display low
confidence about the current situation, while
6.5% of them were expecting this semester
to deliver better results.
Expected improvements in turnover have
not been fulfilled and now this indicator is
below zero (-2.5).
Another discouraging sign for a continuation of economic recovery is the current level of orders: in spite
of the increasing trend, internal and external demand is below the expected level (-11.9). However, Craft
and SMEs in Europe seem to be more confident about the next months.
Table 3: trend in the balance between expected and
realized investment in
Expected
Investment
Realised
Investment
Δ (R-E)
12/H1 -22.7 -4.2 18.5
12/H2 -15.9 -13.1 2.8
13/H1 -16.2 -12.1 4.1
13H/2 -10.5 -14.8 -4.2
14/H1 -13.8 -10.5 3.3
14/H2 -5.8 -8.3 -2.4
A key element in this analysis is the investment level (Table
3): in the first semester of 2014 a net balance of 5.8% of
SMEs expected it to decrease, while the percentage of
business that observed a reduction is 8.3 (2.4 more negative).
Usually, realised investments are always higher than the
expected ones, mainly because small enterprises do not
forecast malfunctions in the production process and
investments due to new contracts.
Therefore, this negative gap can be explained by the
uncertainty of the economic trend in the next years and also,
in part, by the difficulty to access finance.
6. 6
Some positive signs for 2015, but not enough for more investment and jobs
Forecasts for the first months of 2015, reported in Chart 6, are quite close to the results of the previous
semester: the overall situation is expected to slightly improve, while employment and investment are
supposed to decrease by 1.7 (-5.1) and 3 (-11.3) percentage points respectively. An upward trend can
be individuated for prices, turnover and orders but, despite that, the latter two are expected to keep at
negative levels.
The downturn trend of investment intentions is a bad news for the sustainability of the SMEs’ recovery
path, as low investment levels have negative consequences for future growth prospective. Looking at the
overall results of the Barometer it seems that European SMEs believe that the worst of the last recession
is behind them but that the economic upturn is still slow and insidious. Indeed, the improvements in
turnover and orders experienced are not strong enough to see any increases in employment and
investment level.
Chart 6 – Balance +/-
Comparing expectations for the first months of 2015 and what was imagined by SMEs six months ago
(Table 2, page 5), we can observe that Crafts and SMEs in the European Union are now less confident
about the economic situation than they were: every business aspect except orders dropped, in particular
investment.
Even if future growth prospective are not negative, we should contextualise them in a period of economic
stagnation and, furthermore, we might also consider the current exchange rates depreciation and the
significant downward trend in oil prices. With the cost of oil steady or falling back and a decrease in the
value of Euro with respect to dollars, pressure on firms’ budgets has been reduced and this should have
helped discretionary spending power and competitiveness to rise.
-9.9
-6.7 -6.7
0.7
-14.8
-8.6
-1.5
0.3
-5.4
0.1
-10.5 -10.0
-3.1
-2.5
-3.4 -2.2
-8.3 -8.0
-2.6
-1.0
-5.1
4.6
-11.3
-2.6
-20.0
-15.0
-10.0
-5.0
0.0
5.0
10.0
Overall
situation
Turnover Employment Prices Investments Orders
SME main results
13/H2
14/H1
14/H2
15/H1e
7. 7
Sectors suffer from lack of internal demand, only manufacturing grows
In line with the European picture as a whole, the turnover level among different business sectors cooled
in the previous months (Chart 7). Turnover declined particularly for construction firms: in the last part of
2014, small and medium businesses in this sector recorded a negative balance of -8.4 pp (- 8.1), stopping
the two consecutive semesters’ positive trend. A similar path has been registered for business and
personal services, where, after a year and half of continuing growth, turnover went down to -6.3 and -7.2,
reflecting a slowdown in internal demand. In all these cases, turnover growth expectations small
businesses had in the previous semester have not been realised: this indicator was supposed to rise to
5.2 (construction), 2.0 (business services) and 4.3 (personal services). This means expectations have
been significantly overestimated by 13.6 pp in construction and by 8.3 pp (business) and 11.5 (personal)
in the services sector. However, at least the services sectors expect some improvement for the next
months, even if the forecasts stay in the negative share.
The only sector recording a biannual increase in turnover, bucking this overall negative trend, is the
manufacturing sector, which remains positive but with an expected decrease in the next months. This
shows that with all global problems and risks, the economy in Europe is still driven by external rather than
internal demand.
Given the overall picture of economic stagnation in the Eurozone and a slowdown in some of the world’s
larger emerging markets, there are more downward risks for SME growth and hope for positive surprises.
Chart 7 – Turnover by sector
A deep look in the construction sector
Examining more in detail construction sector in Chart 8 (page 8), we can observe that the positive trend
registered in the previous EU Craft and SME Barometer7 has not materialised: all the optimistic level
showed in the first months of 2014 have not been fulfilled and, moreover, the situation is expected to
become worse. Employment is negative since the very beginning of the 2008 crisis and now is returning
again to low levels (-8.4). In addition, this measure is not supposed to raise in the future and even
investment, historically already low, is forecasted to reach -18.1.
Those results suggest that, on average, small businesses are currently utilising their existing capacity
and they do not show any intention of increasing it. Furthermore, considering the overall trend, we can
see that, after being originally hit by the bursting of real estate bubble, two different public national
interventions took place in this sector. The last one, started in the first months of 2013, was not strong
enough to allow an enduring increase in the internal demand and to push, in this way, the entire industry
7 http://www.ueapme.com/IMG/pdf/141010_Barometer_2014H2_final.pdf
3.0
-27.0
2.2
12.2
-4.2
-11.5
4.5 6.8
3.6
-34.0
-29.9
-5.2
-1.6
-17.6
-21.2
-0.3
-8.4 -10.7
2.4
-1.4
-2.9
-26.1
-6.8
3.2
-19.0
-24.8
-3.5
-7.1 -7.4
-40.0
-30.0
-20.0
-10.0
0.0
10.0
20.0
Turnover by sector
Manufacturing
Construction
Business
Services
Personal
Services
8. 8
on a recovery path. Given the high share of competitors that were driven out of the market because of
over-capacities and lack of demand, we cannot expect that the construction sector reach the pre-crisis
level quickly, nevertheless, those results are a clearly manifestation of weak economic outlook.
Chart 8 – Construction
By size-classes: the smallest suffer from weak services sector
Chart 9, which presents the developments for turnover of Craft and SMEs by size classes, shows a
decrease for micro and small enterprises for the last semester. According to their expectations, turnover
will stay at these negative levels also for the next month. Only medium-sized firms, acting in a higher
share in the manufacturing sector, have been growing during the last semester and reached with +9.3 a
peak for this index. However, for the current semester, also medium sized companies in parallel with the
manufacturing sector expect a slight downturn in turnover to 7.4.
As regards the expectations for the first semester 2015, SME turnover on average is slightly negative (-
1.0), but with significant differences between medium-sized companies (+ 7.4), small (- 3.0) and micro (-
7.4) enterprises. In summery a clear picture that the recovery, which started in the first half of 2013, came
to a standstill and turned into a stagnation at low level.
Chart 9 – Turnover by size class
-4.4
-26.8
-6.5
-16.7
-11.8
-7.1
-3.4
-8.4
-11.5
-15.4
-12.5 -12.5
-6.3
-10.7 -11.1
-8.5
1.7
-2.7
-23.3 -24.9
-10.1
-12.5
-20.6 -21.9
-18.1
-9.8
-20.7
-4.7
4.9
-26.1
-30.5
-12.7
-14.7
-9.1
-40.0
-30.0
-20.0
-10.0
0.0
10.0
SME construction
Situation
Turnover
Employment
Prices
Investments
Orders
-12.5
-19.4
-6.1
0.6
-11.5
-20.6
-4.3
-8.4 -7.4
-25.7
-20.5
9.2
-0.5
-14.7
-3.5
-3.0
-3.0
15.3
-15.2
14.9 18.0
-3.4
2.0
4.9
9.3 7.4
-28.0 -25.0
0.6
-2.9
-15.3
-6.7
-2.5
-1.0
-40.0
-30.0
-20.0
-10.0
0.0
10.0
20.0
Turnover by size class
Micro
Small
Medium
∑SME
9. 9
Conclusions and recommendations
The figures for this Barometer, collected between December 2014 and February 2015, show that the high
expectations SMEs had for the last semester have not materialised. Only the manufacturing sector, which
depends to a higher degree on external demand, has profited from favourable developments in
commodity prices and exchange rates. Services sectors and construction, which are more dependent on
internal demand and domestic investments, are reporting negative results for the second half of 2014.
Especially worrisome is the steep decrease in the construction sector, which can only be explained by
the fact that positive public incentives and support measures provided in some countries over the last
years have not able to create enough momentum to keep the sector growing after public injections
stopped.
Even if SMEs on average expect some improvements for the current semester, especially in sectors
related to internal demand, this will most likely not turn into positive figures and will in no case be strong
enough to see improvements as regards investment and employment. Both will remain at low levels.
Overall, the European SME Barometer confirms that Europe’s economy is not yet out of the crisis and
further supporting policy measures are needed to allow a return to a sustainable growth path. Only if
Europe significantly increases its investment levels, will growth rates be sufficient to create new jobs and
reduce unemployment.
Given the tight public budgets and the limited room to further increase debt levels, such investment must
come from private sector. Therefore, any successful policy approach has to start with making Europe an
attractive place for private investment and to improve the competitiveness of companies in Europe.
New European Commission has recently published its overall economic policy approach in its Annual
Growth Survey8 and the new Investment Plan for Europe9 and both are based on three pillars: (1) fiscal
responsibility, (2) structural reforms and (3) investments.
We would support such a three pillar approach in general, but it needs some specific and concrete
measures to avoid a long lasting stagnation in Europe, to improve competitiveness and to improve the
chance for sustainable growth rates:
Implement the needed reforms on goods and services markets to create new market opportunities
with positive impacts for investments, growth and job creation.
Improve the environment for businesses with better regulations and effective administrations.
Rethink the reforms of financial markets to make the sector better able to serve the real economy.
Ensure the provision of skills and competences required by companies, and modernise the labour
markets to provide small companies the needed flexibility.
Ensure the needed investments in public infrastructure needed to allow business to compete, to
growth and to create jobs.
8 http://ec.europa.eu/europe2020/pdf/2015/ags2015_en.pdf
9 http://eur-lex.europa.eu/legal-content/EN/TXT/?uri=COM:2014:903:FIN
10. 10
UEAPME EU Craft and SME Barometer: Methodology
The EU Craft and SME Barometer is built on the results of surveys conducted by UEAPME Member
Organisations two to four times a year in different regions all over Europe. The survey is based on about
120.000 questionnaires, with 30.000 answers received. The data for this survey were collected
between December 2014 and February 2015, which gives quite a recent picture of the development and
expectations of SME owners all over Europe.
At the European level, we are able to provide data for size classes (micro, small and medium-sized
enterprises) and for four economic sectors (manufacturing, construction, business and personal
services), which may show different developments over business cycles and may react differently to
external effects.
For each of these groups the Barometer provides balanced figures on the following categories: overall
situation, turnover, employment, prices, investment and orders, where balanced means the
difference between businesses that answered the questions about their expectation in these six
categories in a positive or negative manner (balance = positive answers – negative answers). In order to
get European figures from different national surveys, national results have been weighed with
employment figures.
This Barometer presents the results (experiences) for the second semester of 2014 (14/H2) as well as
the expectations for the first half of 2015 (15/H1e).
UEAPME publishes its EU Craft and SME Barometer twice a year, ahead of the European Summit in
spring and autumn. The publication also includes the European SME Business Climate Index (see first
pages), which is calculated using the average of the current situation and the expectations for the next
period, as a result of the sum of positive and neutral answers as regards the overall situation for the
business.
Finally, UEAPME will only present European figures and will not disclose country specific data. This is
due to the facts that, for all Member States, we do have not data significant enough from a statistical
perspective and furthermore, that the presentation of national data from SME surveys is a prerogative of
our national organisations that are collecting them.
___________________________________________________________
For further information on this document, please contact:
Gerhard Huemer, Director Study Unit
UEAPME
Rue Jacques de Lalaing, 4
B-1040 Brussels
Tel: +32 2 2307599
E-mail: g.huemer@ueapme.com
Francesca Albanine, Economist at the Study
Unit
UEAPME
Rue Jacques de Lalaing, 4
B-1040 Brussels
Tel: +32 2 2307599
E-mail: study@ueapme.com