SlideShare a Scribd company logo
1 of 14
7 New Maps of the world
Danny Dorling
University of Oxford, School of Geography & Environment
November 8th, 2017
A talk based on a short book written with Carl Lee
Maps by Benjamin Hennig
This is a map of Europe with area drawn in proportion to population. Each area is shaded by the
proportion of people living there not born in the state the region is in (data for 2014).
Because of differential turnout, a narrow majority of Leave voters lived in the South of England and
most were middle class. Areas of high immigration voted to remain (albeit there was a minor
‘change’ effect where areas not used to migration voted leave).
Old maps in Geography textbooks used to look like this
one – area not proportional to anything, but compass
directions persevered as straight lines on a flat map.
So – let’s look at seven new maps of the world starting with - Map 1: Humankind's migration
This map shows the migration of humanity across the world based on what we currently know
from mitochondrial DNA tracking. The map also shows approximate dates for arrival and dispersal
in key locations. The underlying projection shows the relative population density on Earth today,
resizing the land area based on the number of people living in each space.
Map 2: Global connectivity
This map is a picture of the maiden voyage of MSC Oscar, which in 2015 was the world's largest
container ship: it went from Dalian, China to Rotterdam, Netherlands and is shown here in the
context of the most frequent global shipping routes that can be seen in the background shown on
an equal-population projection of the world. The projection shows the relative population
density on Earth, resizing the land area based on the number of people living in each space.
Map 3: World's remotest places
This map shows the most remote places on the planet, the spaces where a 'lonely planet' can still
be found. It shows areas larger, the further it takes to get to them via land travel from the nearest
large city. This map and all the others shown in these slides was drawn by Ben Hennig who now
works at the University of Iceland – a place that does not look that remote compared to
Greenland, or the North of Canada or Tibet, but is if viewed from Europe.
You can zoom in and in to these maps and they sometimes change shape when
you do so – because areas are affected by areas outside of the mapping box –
here are the most remote places in Europe and then in the UK and Ireland – the
more remote a place the larger it is drawn.
Map 4: A modern mappa mundi
This is a 'mappa mundi' of the modern world: in the map every small area is drawn in proportion
to the population that lives there. Oceans are reduced in size to a minimum leaving almost no
space between the continents. It shows today's centre of the human planet to lie in India.
Map 5: Global croplands
Feeding a global population of 10 billion is one of the great challenges of the 21st century. This
map is drawn to show where the most productive croplands are by increasing the size of those
areas that are currently used for farming agricultural produce, while omitting those areas that are
less suitable for agriculture or used for other purposes.
Map 6: Earth at night
This shows Earth at night on a population density map. Instead of highlighting the geographical
land areas that are shining brightest at night, this map highlights where people live with and
without light. The projection shows the relative population density in the world, resizing the land
area based on the number of people living in each space.
Map 7: Global precipitation patterns
This map shows the annual precipitation mapped onto a population distribution map. The
underlying projection shows the relative population density on Earth today, resizing the land area
based on the number of people living in each space.
If you are interested in more
http://www.dannydorling.org/books/betterpolitics/
It’s free 

More Related Content

What's hot

Geography Options Presentation
Geography Options PresentationGeography Options Presentation
Geography Options Presentationgueste485d2
 
Changing views of a changing planet
Changing views of a changing planetChanging views of a changing planet
Changing views of a changing planetBenjamin Hennig
 
The American Red Cross' Missing Maps Project
The American Red Cross' Missing Maps ProjectThe American Red Cross' Missing Maps Project
The American Red Cross' Missing Maps ProjectPeter Killcommons
 
ISSUES IN DEPICTING POPULATION CHANGE WITH DOT MAPS
ISSUES IN DEPICTING POPULATION CHANGE WITH DOT MAPS ISSUES IN DEPICTING POPULATION CHANGE WITH DOT MAPS
ISSUES IN DEPICTING POPULATION CHANGE WITH DOT MAPS Martin Klícha
 
Chapter 1 key issue 1
Chapter 1   key issue 1Chapter 1   key issue 1
Chapter 1 key issue 1hanslunow
 
Topsham Landcover and Population
Topsham Landcover and PopulationTopsham Landcover and Population
Topsham Landcover and PopulationPaul Morris
 
Unit One Notes 2
Unit One Notes 2Unit One Notes 2
Unit One Notes 2dsaska
 
2016 GGSD Forum - Opening Session: Presentation by Mr. Christian Kastrop, Dir...
2016 GGSD Forum - Opening Session: Presentation by Mr. Christian Kastrop, Dir...2016 GGSD Forum - Opening Session: Presentation by Mr. Christian Kastrop, Dir...
2016 GGSD Forum - Opening Session: Presentation by Mr. Christian Kastrop, Dir...OECD Environment
 
Geography Skills - Thematic Maps & Climate
Geography Skills - Thematic Maps & Climate Geography Skills - Thematic Maps & Climate
Geography Skills - Thematic Maps & Climate Tim Bonnar
 

What's hot (11)

Map projections homework
Map projections homeworkMap projections homework
Map projections homework
 
Geography Options Presentation
Geography Options PresentationGeography Options Presentation
Geography Options Presentation
 
Changing views of a changing planet
Changing views of a changing planetChanging views of a changing planet
Changing views of a changing planet
 
The American Red Cross' Missing Maps Project
The American Red Cross' Missing Maps ProjectThe American Red Cross' Missing Maps Project
The American Red Cross' Missing Maps Project
 
ISSUES IN DEPICTING POPULATION CHANGE WITH DOT MAPS
ISSUES IN DEPICTING POPULATION CHANGE WITH DOT MAPS ISSUES IN DEPICTING POPULATION CHANGE WITH DOT MAPS
ISSUES IN DEPICTING POPULATION CHANGE WITH DOT MAPS
 
Chapter 1 key issue 1
Chapter 1   key issue 1Chapter 1   key issue 1
Chapter 1 key issue 1
 
Topsham Landcover and Population
Topsham Landcover and PopulationTopsham Landcover and Population
Topsham Landcover and Population
 
Unit One Notes 2
Unit One Notes 2Unit One Notes 2
Unit One Notes 2
 
Geography 1
Geography 1Geography 1
Geography 1
 
2016 GGSD Forum - Opening Session: Presentation by Mr. Christian Kastrop, Dir...
2016 GGSD Forum - Opening Session: Presentation by Mr. Christian Kastrop, Dir...2016 GGSD Forum - Opening Session: Presentation by Mr. Christian Kastrop, Dir...
2016 GGSD Forum - Opening Session: Presentation by Mr. Christian Kastrop, Dir...
 
Geography Skills - Thematic Maps & Climate
Geography Skills - Thematic Maps & Climate Geography Skills - Thematic Maps & Climate
Geography Skills - Thematic Maps & Climate
 

Similar to 7 New Maps of the World

Storyboard Miraikan Sorting Out Cities
Storyboard Miraikan Sorting Out CitiesStoryboard Miraikan Sorting Out Cities
Storyboard Miraikan Sorting Out CitiesDietmar Offenhuber
 
Mapping people, not sheep: Why our planet's well-being can look so different
Mapping people, not sheep: Why our planet's well-being can look so differentMapping people, not sheep: Why our planet's well-being can look so different
Mapping people, not sheep: Why our planet's well-being can look so differentBenjamin Hennig
 
UNIT 5. SOCIAL SCIENCE: MAPS AND GLOBES
UNIT 5. SOCIAL SCIENCE: MAPS AND GLOBESUNIT 5. SOCIAL SCIENCE: MAPS AND GLOBES
UNIT 5. SOCIAL SCIENCE: MAPS AND GLOBESMartaDN
 
Siddharth Hande | GIS/critical GIS presentation
Siddharth Hande | GIS/critical GIS presentationSiddharth Hande | GIS/critical GIS presentation
Siddharth Hande | GIS/critical GIS presentationSiddharth Hande
 
map_projections_powerpoint3.ppt
map_projections_powerpoint3.pptmap_projections_powerpoint3.ppt
map_projections_powerpoint3.pptDeshDeepak68
 
Urbanisation ann talbot
Urbanisation ann talbotUrbanisation ann talbot
Urbanisation ann talbotAnn Talbot
 
GeoHCI 2013: Geography and HCI
GeoHCI 2013: Geography and HCIGeoHCI 2013: Geography and HCI
GeoHCI 2013: Geography and HCIMuki Haklay
 
Types of maps year2
Types of maps year2Types of maps year2
Types of maps year2almusociales
 
Tracing World Views
Tracing World ViewsTracing World Views
Tracing World Viewsjk1lee
 
Tracing World Views
Tracing World ViewsTracing World Views
Tracing World Viewsjk1lee
 
ISciences at the Hands-On Museum Local Tech Event
ISciences at the Hands-On Museum Local Tech EventISciences at the Hands-On Museum Local Tech Event
ISciences at the Hands-On Museum Local Tech EventISCIENCES, L.L.C.
 

Similar to 7 New Maps of the World (20)

Storyboard Miraikan Sorting Out Cities
Storyboard Miraikan Sorting Out CitiesStoryboard Miraikan Sorting Out Cities
Storyboard Miraikan Sorting Out Cities
 
Mapping people, not sheep: Why our planet's well-being can look so different
Mapping people, not sheep: Why our planet's well-being can look so differentMapping people, not sheep: Why our planet's well-being can look so different
Mapping people, not sheep: Why our planet's well-being can look so different
 
UNIT 5. SOCIAL SCIENCE: MAPS AND GLOBES
UNIT 5. SOCIAL SCIENCE: MAPS AND GLOBESUNIT 5. SOCIAL SCIENCE: MAPS AND GLOBES
UNIT 5. SOCIAL SCIENCE: MAPS AND GLOBES
 
Siddharth Hande | GIS/critical GIS presentation
Siddharth Hande | GIS/critical GIS presentationSiddharth Hande | GIS/critical GIS presentation
Siddharth Hande | GIS/critical GIS presentation
 
map_projections_powerpoint3.ppt
map_projections_powerpoint3.pptmap_projections_powerpoint3.ppt
map_projections_powerpoint3.ppt
 
map projections.ppt
map projections.pptmap projections.ppt
map projections.ppt
 
Map reading
Map readingMap reading
Map reading
 
Exploring geographic world
Exploring geographic worldExploring geographic world
Exploring geographic world
 
Introduction to geography
Introduction to geographyIntroduction to geography
Introduction to geography
 
Map & globes
Map & globesMap & globes
Map & globes
 
Map Projections
Map ProjectionsMap Projections
Map Projections
 
Urbanisation ann talbot
Urbanisation ann talbotUrbanisation ann talbot
Urbanisation ann talbot
 
Types of maps
Types of maps Types of maps
Types of maps
 
Maps, cartography and significances
Maps, cartography and significancesMaps, cartography and significances
Maps, cartography and significances
 
Geography
GeographyGeography
Geography
 
GeoHCI 2013: Geography and HCI
GeoHCI 2013: Geography and HCIGeoHCI 2013: Geography and HCI
GeoHCI 2013: Geography and HCI
 
Types of maps year2
Types of maps year2Types of maps year2
Types of maps year2
 
Tracing World Views
Tracing World ViewsTracing World Views
Tracing World Views
 
Tracing World Views
Tracing World ViewsTracing World Views
Tracing World Views
 
ISciences at the Hands-On Museum Local Tech Event
ISciences at the Hands-On Museum Local Tech EventISciences at the Hands-On Museum Local Tech Event
ISciences at the Hands-On Museum Local Tech Event
 

More from Danny Dorling

Has the UK Reached Peak Inequality?
Has the UK Reached Peak Inequality?Has the UK Reached Peak Inequality?
Has the UK Reached Peak Inequality?Danny Dorling
 
Another World is Inevitable: Mapping UK General Elections
Another World is Inevitable: Mapping UK General ElectionsAnother World is Inevitable: Mapping UK General Elections
Another World is Inevitable: Mapping UK General ElectionsDanny Dorling
 
The EU - Should we stay or should we go?
The EU - Should we stay or should we go?The EU - Should we stay or should we go?
The EU - Should we stay or should we go?Danny Dorling
 
The Geography of our Future: Understanding the consequences of the Anthropocene
The Geography of our Future: Understanding the consequences of the AnthropoceneThe Geography of our Future: Understanding the consequences of the Anthropocene
The Geography of our Future: Understanding the consequences of the AnthropoceneDanny Dorling
 
Illustrations from the book 'Better Politics'
Illustrations from the book 'Better Politics'Illustrations from the book 'Better Politics'
Illustrations from the book 'Better Politics'Danny Dorling
 
Mapping the UK election(s) of 2015 - what was done and did it work?
Mapping the UK election(s) of 2015 - what was done and did it work?Mapping the UK election(s) of 2015 - what was done and did it work?
Mapping the UK election(s) of 2015 - what was done and did it work?Danny Dorling
 
Injustice - Why Social Inequality Still Persists
Injustice - Why Social Inequality Still PersistsInjustice - Why Social Inequality Still Persists
Injustice - Why Social Inequality Still PersistsDanny Dorling
 
Theories of Potential and the Creation of Inequality
Theories of Potential and the Creation of InequalityTheories of Potential and the Creation of Inequality
Theories of Potential and the Creation of InequalityDanny Dorling
 
Inequality and Empathy
Inequality and EmpathyInequality and Empathy
Inequality and EmpathyDanny Dorling
 
The Population of the UK, Chapter 10
The Population of the UK, Chapter 10The Population of the UK, Chapter 10
The Population of the UK, Chapter 10Danny Dorling
 
The Population of the UK, Chapter 9
The Population of the UK, Chapter 9The Population of the UK, Chapter 9
The Population of the UK, Chapter 9Danny Dorling
 
The Population of the UK, Chapter 8
The Population of the UK, Chapter 8The Population of the UK, Chapter 8
The Population of the UK, Chapter 8Danny Dorling
 
The Population of the UK, Chapter 7
The Population of the UK, Chapter 7The Population of the UK, Chapter 7
The Population of the UK, Chapter 7Danny Dorling
 
The Population of the UK, Chapter 6
The Population of the UK, Chapter 6The Population of the UK, Chapter 6
The Population of the UK, Chapter 6Danny Dorling
 
The Population of the UK, Chapter 5
The Population of the UK, Chapter 5The Population of the UK, Chapter 5
The Population of the UK, Chapter 5Danny Dorling
 
The Population of the UK, Chapter 4
The Population of the UK, Chapter 4The Population of the UK, Chapter 4
The Population of the UK, Chapter 4Danny Dorling
 

More from Danny Dorling (20)

Has the UK Reached Peak Inequality?
Has the UK Reached Peak Inequality?Has the UK Reached Peak Inequality?
Has the UK Reached Peak Inequality?
 
Cultural Geography
Cultural GeographyCultural Geography
Cultural Geography
 
Peak inequality
Peak inequalityPeak inequality
Peak inequality
 
Social Inequalities
Social InequalitiesSocial Inequalities
Social Inequalities
 
Another World is Inevitable: Mapping UK General Elections
Another World is Inevitable: Mapping UK General ElectionsAnother World is Inevitable: Mapping UK General Elections
Another World is Inevitable: Mapping UK General Elections
 
The EU - Should we stay or should we go?
The EU - Should we stay or should we go?The EU - Should we stay or should we go?
The EU - Should we stay or should we go?
 
The Geography of our Future: Understanding the consequences of the Anthropocene
The Geography of our Future: Understanding the consequences of the AnthropoceneThe Geography of our Future: Understanding the consequences of the Anthropocene
The Geography of our Future: Understanding the consequences of the Anthropocene
 
Illustrations from the book 'Better Politics'
Illustrations from the book 'Better Politics'Illustrations from the book 'Better Politics'
Illustrations from the book 'Better Politics'
 
Mapping the UK election(s) of 2015 - what was done and did it work?
Mapping the UK election(s) of 2015 - what was done and did it work?Mapping the UK election(s) of 2015 - what was done and did it work?
Mapping the UK election(s) of 2015 - what was done and did it work?
 
Injustice - Why Social Inequality Still Persists
Injustice - Why Social Inequality Still PersistsInjustice - Why Social Inequality Still Persists
Injustice - Why Social Inequality Still Persists
 
Theories of Potential and the Creation of Inequality
Theories of Potential and the Creation of InequalityTheories of Potential and the Creation of Inequality
Theories of Potential and the Creation of Inequality
 
Inequality and Empathy
Inequality and EmpathyInequality and Empathy
Inequality and Empathy
 
Inequality
InequalityInequality
Inequality
 
The Population of the UK, Chapter 10
The Population of the UK, Chapter 10The Population of the UK, Chapter 10
The Population of the UK, Chapter 10
 
The Population of the UK, Chapter 9
The Population of the UK, Chapter 9The Population of the UK, Chapter 9
The Population of the UK, Chapter 9
 
The Population of the UK, Chapter 8
The Population of the UK, Chapter 8The Population of the UK, Chapter 8
The Population of the UK, Chapter 8
 
The Population of the UK, Chapter 7
The Population of the UK, Chapter 7The Population of the UK, Chapter 7
The Population of the UK, Chapter 7
 
The Population of the UK, Chapter 6
The Population of the UK, Chapter 6The Population of the UK, Chapter 6
The Population of the UK, Chapter 6
 
The Population of the UK, Chapter 5
The Population of the UK, Chapter 5The Population of the UK, Chapter 5
The Population of the UK, Chapter 5
 
The Population of the UK, Chapter 4
The Population of the UK, Chapter 4The Population of the UK, Chapter 4
The Population of the UK, Chapter 4
 

Recently uploaded

Advanced Views - Calendar View in Odoo 17
Advanced Views - Calendar View in Odoo 17Advanced Views - Calendar View in Odoo 17
Advanced Views - Calendar View in Odoo 17Celine George
 
Sanyam Choudhary Chemistry practical.pdf
Sanyam Choudhary Chemistry practical.pdfSanyam Choudhary Chemistry practical.pdf
Sanyam Choudhary Chemistry practical.pdfsanyamsingh5019
 
Web & Social Media Analytics Previous Year Question Paper.pdf
Web & Social Media Analytics Previous Year Question Paper.pdfWeb & Social Media Analytics Previous Year Question Paper.pdf
Web & Social Media Analytics Previous Year Question Paper.pdfJayanti Pande
 
Software Engineering Methodologies (overview)
Software Engineering Methodologies (overview)Software Engineering Methodologies (overview)
Software Engineering Methodologies (overview)eniolaolutunde
 
Organic Name Reactions for the students and aspirants of Chemistry12th.pptx
Organic Name Reactions  for the students and aspirants of Chemistry12th.pptxOrganic Name Reactions  for the students and aspirants of Chemistry12th.pptx
Organic Name Reactions for the students and aspirants of Chemistry12th.pptxVS Mahajan Coaching Centre
 
Separation of Lanthanides/ Lanthanides and Actinides
Separation of Lanthanides/ Lanthanides and ActinidesSeparation of Lanthanides/ Lanthanides and Actinides
Separation of Lanthanides/ Lanthanides and ActinidesFatimaKhan178732
 
Arihant handbook biology for class 11 .pdf
Arihant handbook biology for class 11 .pdfArihant handbook biology for class 11 .pdf
Arihant handbook biology for class 11 .pdfchloefrazer622
 
The basics of sentences session 2pptx copy.pptx
The basics of sentences session 2pptx copy.pptxThe basics of sentences session 2pptx copy.pptx
The basics of sentences session 2pptx copy.pptxheathfieldcps1
 
BASLIQ CURRENT LOOKBOOK LOOKBOOK(1) (1).pdf
BASLIQ CURRENT LOOKBOOK  LOOKBOOK(1) (1).pdfBASLIQ CURRENT LOOKBOOK  LOOKBOOK(1) (1).pdf
BASLIQ CURRENT LOOKBOOK LOOKBOOK(1) (1).pdfSoniaTolstoy
 
social pharmacy d-pharm 1st year by Pragati K. Mahajan
social pharmacy d-pharm 1st year by Pragati K. Mahajansocial pharmacy d-pharm 1st year by Pragati K. Mahajan
social pharmacy d-pharm 1st year by Pragati K. Mahajanpragatimahajan3
 
Measures of Dispersion and Variability: Range, QD, AD and SD
Measures of Dispersion and Variability: Range, QD, AD and SDMeasures of Dispersion and Variability: Range, QD, AD and SD
Measures of Dispersion and Variability: Range, QD, AD and SDThiyagu K
 
Paris 2024 Olympic Geographies - an activity
Paris 2024 Olympic Geographies - an activityParis 2024 Olympic Geographies - an activity
Paris 2024 Olympic Geographies - an activityGeoBlogs
 
Nutritional Needs Presentation - HLTH 104
Nutritional Needs Presentation - HLTH 104Nutritional Needs Presentation - HLTH 104
Nutritional Needs Presentation - HLTH 104misteraugie
 
Interactive Powerpoint_How to Master effective communication
Interactive Powerpoint_How to Master effective communicationInteractive Powerpoint_How to Master effective communication
Interactive Powerpoint_How to Master effective communicationnomboosow
 
Introduction to Nonprofit Accounting: The Basics
Introduction to Nonprofit Accounting: The BasicsIntroduction to Nonprofit Accounting: The Basics
Introduction to Nonprofit Accounting: The BasicsTechSoup
 
CARE OF CHILD IN INCUBATOR..........pptx
CARE OF CHILD IN INCUBATOR..........pptxCARE OF CHILD IN INCUBATOR..........pptx
CARE OF CHILD IN INCUBATOR..........pptxGaneshChakor2
 
9548086042 for call girls in Indira Nagar with room service
9548086042  for call girls in Indira Nagar  with room service9548086042  for call girls in Indira Nagar  with room service
9548086042 for call girls in Indira Nagar with room servicediscovermytutordmt
 
JAPAN: ORGANISATION OF PMDA, PHARMACEUTICAL LAWS & REGULATIONS, TYPES OF REGI...
JAPAN: ORGANISATION OF PMDA, PHARMACEUTICAL LAWS & REGULATIONS, TYPES OF REGI...JAPAN: ORGANISATION OF PMDA, PHARMACEUTICAL LAWS & REGULATIONS, TYPES OF REGI...
JAPAN: ORGANISATION OF PMDA, PHARMACEUTICAL LAWS & REGULATIONS, TYPES OF REGI...anjaliyadav012327
 

Recently uploaded (20)

Advanced Views - Calendar View in Odoo 17
Advanced Views - Calendar View in Odoo 17Advanced Views - Calendar View in Odoo 17
Advanced Views - Calendar View in Odoo 17
 
Sanyam Choudhary Chemistry practical.pdf
Sanyam Choudhary Chemistry practical.pdfSanyam Choudhary Chemistry practical.pdf
Sanyam Choudhary Chemistry practical.pdf
 
Web & Social Media Analytics Previous Year Question Paper.pdf
Web & Social Media Analytics Previous Year Question Paper.pdfWeb & Social Media Analytics Previous Year Question Paper.pdf
Web & Social Media Analytics Previous Year Question Paper.pdf
 
Software Engineering Methodologies (overview)
Software Engineering Methodologies (overview)Software Engineering Methodologies (overview)
Software Engineering Methodologies (overview)
 
Organic Name Reactions for the students and aspirants of Chemistry12th.pptx
Organic Name Reactions  for the students and aspirants of Chemistry12th.pptxOrganic Name Reactions  for the students and aspirants of Chemistry12th.pptx
Organic Name Reactions for the students and aspirants of Chemistry12th.pptx
 
Separation of Lanthanides/ Lanthanides and Actinides
Separation of Lanthanides/ Lanthanides and ActinidesSeparation of Lanthanides/ Lanthanides and Actinides
Separation of Lanthanides/ Lanthanides and Actinides
 
Arihant handbook biology for class 11 .pdf
Arihant handbook biology for class 11 .pdfArihant handbook biology for class 11 .pdf
Arihant handbook biology for class 11 .pdf
 
INDIA QUIZ 2024 RLAC DELHI UNIVERSITY.pptx
INDIA QUIZ 2024 RLAC DELHI UNIVERSITY.pptxINDIA QUIZ 2024 RLAC DELHI UNIVERSITY.pptx
INDIA QUIZ 2024 RLAC DELHI UNIVERSITY.pptx
 
The basics of sentences session 2pptx copy.pptx
The basics of sentences session 2pptx copy.pptxThe basics of sentences session 2pptx copy.pptx
The basics of sentences session 2pptx copy.pptx
 
BASLIQ CURRENT LOOKBOOK LOOKBOOK(1) (1).pdf
BASLIQ CURRENT LOOKBOOK  LOOKBOOK(1) (1).pdfBASLIQ CURRENT LOOKBOOK  LOOKBOOK(1) (1).pdf
BASLIQ CURRENT LOOKBOOK LOOKBOOK(1) (1).pdf
 
social pharmacy d-pharm 1st year by Pragati K. Mahajan
social pharmacy d-pharm 1st year by Pragati K. Mahajansocial pharmacy d-pharm 1st year by Pragati K. Mahajan
social pharmacy d-pharm 1st year by Pragati K. Mahajan
 
Measures of Dispersion and Variability: Range, QD, AD and SD
Measures of Dispersion and Variability: Range, QD, AD and SDMeasures of Dispersion and Variability: Range, QD, AD and SD
Measures of Dispersion and Variability: Range, QD, AD and SD
 
Paris 2024 Olympic Geographies - an activity
Paris 2024 Olympic Geographies - an activityParis 2024 Olympic Geographies - an activity
Paris 2024 Olympic Geographies - an activity
 
Nutritional Needs Presentation - HLTH 104
Nutritional Needs Presentation - HLTH 104Nutritional Needs Presentation - HLTH 104
Nutritional Needs Presentation - HLTH 104
 
Interactive Powerpoint_How to Master effective communication
Interactive Powerpoint_How to Master effective communicationInteractive Powerpoint_How to Master effective communication
Interactive Powerpoint_How to Master effective communication
 
Introduction to Nonprofit Accounting: The Basics
Introduction to Nonprofit Accounting: The BasicsIntroduction to Nonprofit Accounting: The Basics
Introduction to Nonprofit Accounting: The Basics
 
CARE OF CHILD IN INCUBATOR..........pptx
CARE OF CHILD IN INCUBATOR..........pptxCARE OF CHILD IN INCUBATOR..........pptx
CARE OF CHILD IN INCUBATOR..........pptx
 
9548086042 for call girls in Indira Nagar with room service
9548086042  for call girls in Indira Nagar  with room service9548086042  for call girls in Indira Nagar  with room service
9548086042 for call girls in Indira Nagar with room service
 
JAPAN: ORGANISATION OF PMDA, PHARMACEUTICAL LAWS & REGULATIONS, TYPES OF REGI...
JAPAN: ORGANISATION OF PMDA, PHARMACEUTICAL LAWS & REGULATIONS, TYPES OF REGI...JAPAN: ORGANISATION OF PMDA, PHARMACEUTICAL LAWS & REGULATIONS, TYPES OF REGI...
JAPAN: ORGANISATION OF PMDA, PHARMACEUTICAL LAWS & REGULATIONS, TYPES OF REGI...
 
Mattingly "AI & Prompt Design: Structured Data, Assistants, & RAG"
Mattingly "AI & Prompt Design: Structured Data, Assistants, & RAG"Mattingly "AI & Prompt Design: Structured Data, Assistants, & RAG"
Mattingly "AI & Prompt Design: Structured Data, Assistants, & RAG"
 

7 New Maps of the World

  • 1. 7 New Maps of the world Danny Dorling University of Oxford, School of Geography & Environment November 8th, 2017 A talk based on a short book written with Carl Lee Maps by Benjamin Hennig
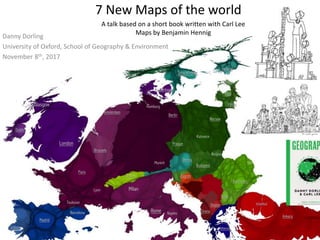
  • 2. This is a map of Europe with area drawn in proportion to population. Each area is shaded by the proportion of people living there not born in the state the region is in (data for 2014).
  • 3.
  • 4. Because of differential turnout, a narrow majority of Leave voters lived in the South of England and most were middle class. Areas of high immigration voted to remain (albeit there was a minor ‘change’ effect where areas not used to migration voted leave).
  • 5. Old maps in Geography textbooks used to look like this one – area not proportional to anything, but compass directions persevered as straight lines on a flat map.
  • 6. So – let’s look at seven new maps of the world starting with - Map 1: Humankind's migration This map shows the migration of humanity across the world based on what we currently know from mitochondrial DNA tracking. The map also shows approximate dates for arrival and dispersal in key locations. The underlying projection shows the relative population density on Earth today, resizing the land area based on the number of people living in each space.
  • 7. Map 2: Global connectivity This map is a picture of the maiden voyage of MSC Oscar, which in 2015 was the world's largest container ship: it went from Dalian, China to Rotterdam, Netherlands and is shown here in the context of the most frequent global shipping routes that can be seen in the background shown on an equal-population projection of the world. The projection shows the relative population density on Earth, resizing the land area based on the number of people living in each space.
  • 8. Map 3: World's remotest places This map shows the most remote places on the planet, the spaces where a 'lonely planet' can still be found. It shows areas larger, the further it takes to get to them via land travel from the nearest large city. This map and all the others shown in these slides was drawn by Ben Hennig who now works at the University of Iceland – a place that does not look that remote compared to Greenland, or the North of Canada or Tibet, but is if viewed from Europe.
  • 9. You can zoom in and in to these maps and they sometimes change shape when you do so – because areas are affected by areas outside of the mapping box – here are the most remote places in Europe and then in the UK and Ireland – the more remote a place the larger it is drawn.
  • 10. Map 4: A modern mappa mundi This is a 'mappa mundi' of the modern world: in the map every small area is drawn in proportion to the population that lives there. Oceans are reduced in size to a minimum leaving almost no space between the continents. It shows today's centre of the human planet to lie in India.
  • 11. Map 5: Global croplands Feeding a global population of 10 billion is one of the great challenges of the 21st century. This map is drawn to show where the most productive croplands are by increasing the size of those areas that are currently used for farming agricultural produce, while omitting those areas that are less suitable for agriculture or used for other purposes.
  • 12. Map 6: Earth at night This shows Earth at night on a population density map. Instead of highlighting the geographical land areas that are shining brightest at night, this map highlights where people live with and without light. The projection shows the relative population density in the world, resizing the land area based on the number of people living in each space.
  • 13. Map 7: Global precipitation patterns This map shows the annual precipitation mapped onto a population distribution map. The underlying projection shows the relative population density on Earth today, resizing the land area based on the number of people living in each space.
  • 14. If you are interested in more http://www.dannydorling.org/books/betterpolitics/ It’s free 