SlideShare a Scribd company logo
1 of 14
Download to read offline
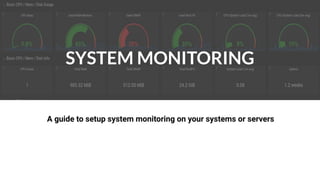
SYSTEM
MONITORINGSYSTEM MONITORING
A guide to setup system monitoring on your systems or servers
Why to even Monitor
your sytem ?
● Monitoring a computer system is just as important as the system itself.
● Monitoring allows for proactive response rather than reactive, data security
and data gathering and the overall good health of a computer system.
● While monitoring does not fix problems, it does lead to more stable and reliable
computer systems.
● For example, monitoring may alert a System Administrator that a hard drive
in a server is degraded. The System Administrator is alerted of this and
swaps out the degraded hard drive with a new one. Without monitoring, the
degraded hard drive could turn into a failed hard drive causing an extended
outage and possible data loss.
Monitoring Tools
- Monitoring tools are used to continuously keep track of the status of the
system in use, in order to have the earliest warning of failures, defects or
problems and to improve them.
- There are monitoring tools for servers, networks, databases, security,
performance, website and internet usage, and applications.
-
➔ Features
➔ To log real-time and historical information.
➔ To find optimal settings.
➔ To monitor the number of users on a network.
➔ To monitor network traffic (either in real time or covering a given length of time of
operation with the analysis performed afterwards).
➔ To identify the problems and send an alert message to the administrator (e.g.
network administrator).
Tools Required
Grafana
An Open Source
visualization and
analytics software
Prometheus
A free software
application used for
event monitoring
and alerting.
Node Exporter
A Linux Metric
Exporter for
Prometheus
Prometheus
- Prometheus is a free software application used for event monitoring and alerting. It
records real-time metrics in a time series database built using a HTTP pull model, with
flexible queries and real-time alerting.
- Prometheus was created to monitor highly dynamic container environments like
kubernetes docker swarm etc however it can also be used in a traditional non
container infrastructure where you have just bare servers with applications deployed
directly on them.
- Features :
● A multi-dimensional data model with time series data identified by metric name
and key/value pairs
● PromQL, a flexible query language to leverage this dimensionality
● No reliance on distributed storage; single server nodes are autonomous
● Time series collection happens via a pull model over HTTP
● Pushing time series is supported via an intermediary gateway
● Targets are discovered via service discovery or static configuration
● Multiple modes of graphing and dashboarding support
Why use Prometheus ?
Identify the source of problem
Working and Components
Node Exporter
- Prometheus pulls metrics data from the targets from an
HTTP endpoint which by default is host address
slash metrics and for that to work the targets must
expose => /metrics endpoint .
- Data available at slash metrics endpoint must be in the
format that Prometheus understands and many services don't have native
Prometheus endpoints so extra components are required.
- Exporter is basically a script or service that fetches metrics from target and
converts them into a format Prometheus can understand and exposes this
converted data at its own slash metrics endpoint where Prometheus can
scrape them.
- Node Exporter is the Prometheus exporter for Linux servers.
Working
Setup and Configuration -1 (Prometheus and Node Exporter)
● First, download and add the GPG key with the following command:
$ wget https://s3-eu-west-1.amazonaws.com/
deb.robustperception.io/41EFC99D.gpg | sudo apt-key add -
● Next, update the repository and install Prometheus with the following command:
$ sudo apt-get update -y
$ sudo apt-get install prometheus prometheus-node-exporter prometheus-pushgateway
prometheus-alertmanager -y
● Once the installation is completed, start Prometheus service and enable it to start on boot time with the
following command:
$ sudo systemctl start prometheus
$ sudo systemctl enable prometheus
● You can also check the status of Prometheus service with the following command:
$ sudo systemctl status prometheus
● Configure prometheus.yml file to scrape metrics from node exporter which runs on PORT=9100.
job_name: node
# If prometheus-node-exporter is installed, grab stats about the local
# machine by default.
static_configs:
- targets: ['localhost:9100']
● Also change scrape_interval in the same config file so load on server is reduced.
global:
scrape_interval: 60s # By default, scrape targets every 15 seconds.
evaluation_interval: 60s # By default, scrape targets every 15 seconds.
Setup and Configuration -2 (Prometheus and Node Exporter)
Grafana
- Grafana is open source visualization and analytics software. It allows you to
query, visualize, alert on, and explore your metrics no matter where they are
stored. In general, it provides you with tools to turn your time-series
database (TSDB) data into beautiful graphs and visualizations.
- Grafana connects with every possible data source, commonly referred to as
databases such as Graphite, Prometheus, Influxdb, ElasticSearch, MySQL,
PostgreSQL etc.
- Dashboard - The dashboards contain a gamut of visualization options such
as geo maps, heat maps, histograms, all the variety of charts & graphs which
a business typically requires to study data.
See a demo board on - https://play.grafana.org/
Setup and Configuration
● Installation
$ sudo apt-get install -y apt-transport-https
$ sudo apt-get install -y software-properties-common wget
$ wget -q -O - https://packages.grafana.com/gpg.key | sudo apt-key add -
$ sudo apt-get update
$ sudo apt-get install grafana-enterprise
● Setup
○ Start the server with systemd
$ sudo systemctl daemon-reload
$ sudo systemctl start grafana-server
$ sudo systemctl status grafana-server
○ Configure Grafana to start at boot
$ sudo systemctl enable grafana-server.service
- By default Grafana runs at PORT 3000 which can be changed by editing
/etc/grafana/grafana.ini
● Change http_port to your desired port.
[server] http_port=8080
Good luck!
We hope you’ll use these tips to go out and
deliver a robust monitoring for your product or
service!
Reference :
● https://youtu.be/h4Sl21AKiDg
● https://prometheus.io/docs/prometheus/latest
/getting_started/

More Related Content

What's hot

Observability vs APM vs Monitoring Comparison
Observability vs APM vs  Monitoring ComparisonObservability vs APM vs  Monitoring Comparison
Observability vs APM vs Monitoring Comparisonjeetendra mandal
 
Prometheus - basics
Prometheus - basicsPrometheus - basics
Prometheus - basicsJuraj Hantak
 
How to Move from Monitoring to Observability, On-Premises and in a Multi-Clou...
How to Move from Monitoring to Observability, On-Premises and in a Multi-Clou...How to Move from Monitoring to Observability, On-Premises and in a Multi-Clou...
How to Move from Monitoring to Observability, On-Premises and in a Multi-Clou...Splunk
 
What is DevOps? | DevOps Introduction | DevOps Tools | DevOps Tutorial For Be...
What is DevOps? | DevOps Introduction | DevOps Tools | DevOps Tutorial For Be...What is DevOps? | DevOps Introduction | DevOps Tools | DevOps Tutorial For Be...
What is DevOps? | DevOps Introduction | DevOps Tools | DevOps Tutorial For Be...Simplilearn
 
Monitoring Kubernetes with Prometheus
Monitoring Kubernetes with PrometheusMonitoring Kubernetes with Prometheus
Monitoring Kubernetes with PrometheusGrafana Labs
 
Introducing GitLab (June 2018)
Introducing GitLab (June 2018)Introducing GitLab (June 2018)
Introducing GitLab (June 2018)Noa Harel
 
Nagios, Getting Started.
Nagios, Getting Started.Nagios, Getting Started.
Nagios, Getting Started.Hitesh Bhatia
 
Application Monitoring using Datadog
Application Monitoring using DatadogApplication Monitoring using Datadog
Application Monitoring using DatadogMukta Aphale
 
Observability at Scale
Observability at Scale Observability at Scale
Observability at Scale Knoldus Inc.
 
Grafana introduction
Grafana introductionGrafana introduction
Grafana introductionRico Chen
 
Introduction to CICD
Introduction to CICDIntroduction to CICD
Introduction to CICDKnoldus Inc.
 
Getting Started Monitoring with Prometheus and Grafana
Getting Started Monitoring with Prometheus and GrafanaGetting Started Monitoring with Prometheus and Grafana
Getting Started Monitoring with Prometheus and GrafanaSyah Dwi Prihatmoko
 

What's hot (20)

Observability
ObservabilityObservability
Observability
 
Observability vs APM vs Monitoring Comparison
Observability vs APM vs  Monitoring ComparisonObservability vs APM vs  Monitoring Comparison
Observability vs APM vs Monitoring Comparison
 
Prometheus - basics
Prometheus - basicsPrometheus - basics
Prometheus - basics
 
Dynatrace
DynatraceDynatrace
Dynatrace
 
Grafana.pptx
Grafana.pptxGrafana.pptx
Grafana.pptx
 
How to Move from Monitoring to Observability, On-Premises and in a Multi-Clou...
How to Move from Monitoring to Observability, On-Premises and in a Multi-Clou...How to Move from Monitoring to Observability, On-Premises and in a Multi-Clou...
How to Move from Monitoring to Observability, On-Premises and in a Multi-Clou...
 
New Relic
New RelicNew Relic
New Relic
 
Devops maturity model
Devops maturity modelDevops maturity model
Devops maturity model
 
What is DevOps? | DevOps Introduction | DevOps Tools | DevOps Tutorial For Be...
What is DevOps? | DevOps Introduction | DevOps Tools | DevOps Tutorial For Be...What is DevOps? | DevOps Introduction | DevOps Tools | DevOps Tutorial For Be...
What is DevOps? | DevOps Introduction | DevOps Tools | DevOps Tutorial For Be...
 
Prometheus workshop
Prometheus workshopPrometheus workshop
Prometheus workshop
 
Monitoring Kubernetes with Prometheus
Monitoring Kubernetes with PrometheusMonitoring Kubernetes with Prometheus
Monitoring Kubernetes with Prometheus
 
Introducing GitLab (June 2018)
Introducing GitLab (June 2018)Introducing GitLab (June 2018)
Introducing GitLab (June 2018)
 
Nagios, Getting Started.
Nagios, Getting Started.Nagios, Getting Started.
Nagios, Getting Started.
 
Application Monitoring using Datadog
Application Monitoring using DatadogApplication Monitoring using Datadog
Application Monitoring using Datadog
 
Observability at Scale
Observability at Scale Observability at Scale
Observability at Scale
 
"DevOps > CI+CD "
"DevOps > CI+CD ""DevOps > CI+CD "
"DevOps > CI+CD "
 
Grafana introduction
Grafana introductionGrafana introduction
Grafana introduction
 
Introduction to CICD
Introduction to CICDIntroduction to CICD
Introduction to CICD
 
DevOps for beginners
DevOps for beginnersDevOps for beginners
DevOps for beginners
 
Getting Started Monitoring with Prometheus and Grafana
Getting Started Monitoring with Prometheus and GrafanaGetting Started Monitoring with Prometheus and Grafana
Getting Started Monitoring with Prometheus and Grafana
 

Similar to System monitoring

Prometheus and Docker (Docker Galway, November 2015)
Prometheus and Docker (Docker Galway, November 2015)Prometheus and Docker (Docker Galway, November 2015)
Prometheus and Docker (Docker Galway, November 2015)Brian Brazil
 
Monitoring in Big Data Platform - Albert Lewandowski, GetInData
Monitoring in Big Data Platform - Albert Lewandowski, GetInDataMonitoring in Big Data Platform - Albert Lewandowski, GetInData
Monitoring in Big Data Platform - Albert Lewandowski, GetInDataGetInData
 
Prometheus - Intro, CNCF, TSDB,PromQL,Grafana
Prometheus - Intro, CNCF, TSDB,PromQL,GrafanaPrometheus - Intro, CNCF, TSDB,PromQL,Grafana
Prometheus - Intro, CNCF, TSDB,PromQL,GrafanaSridhar Kumar N
 
Prometheus-Grafana-RahulSoni1584KnolX.pptx.pdf
Prometheus-Grafana-RahulSoni1584KnolX.pptx.pdfPrometheus-Grafana-RahulSoni1584KnolX.pptx.pdf
Prometheus-Grafana-RahulSoni1584KnolX.pptx.pdfKnoldus Inc.
 
IRJET- Real Time Monitoring of Servers with Prometheus and Grafana for High A...
IRJET- Real Time Monitoring of Servers with Prometheus and Grafana for High A...IRJET- Real Time Monitoring of Servers with Prometheus and Grafana for High A...
IRJET- Real Time Monitoring of Servers with Prometheus and Grafana for High A...IRJET Journal
 
Monitoring Kubernetes with Prometheus (Kubernetes Ireland, 2016)
Monitoring Kubernetes with Prometheus (Kubernetes Ireland, 2016)Monitoring Kubernetes with Prometheus (Kubernetes Ireland, 2016)
Monitoring Kubernetes with Prometheus (Kubernetes Ireland, 2016)Brian Brazil
 
Prometheus: A Next Generation Monitoring System (FOSDEM 2016)
Prometheus: A Next Generation Monitoring System (FOSDEM 2016)Prometheus: A Next Generation Monitoring System (FOSDEM 2016)
Prometheus: A Next Generation Monitoring System (FOSDEM 2016)Brian Brazil
 
Prometheus (Microsoft, 2016)
Prometheus (Microsoft, 2016)Prometheus (Microsoft, 2016)
Prometheus (Microsoft, 2016)Brian Brazil
 
Server monitoring using grafana and prometheus
Server monitoring using grafana and prometheusServer monitoring using grafana and prometheus
Server monitoring using grafana and prometheusCeline George
 
From nothing to Prometheus : one year after
From nothing to Prometheus : one year afterFrom nothing to Prometheus : one year after
From nothing to Prometheus : one year afterAntoine Leroyer
 
Monitoring MySQL with Prometheus and Grafana
Monitoring MySQL with Prometheus and GrafanaMonitoring MySQL with Prometheus and Grafana
Monitoring MySQL with Prometheus and GrafanaJulien Pivotto
 
OSMC 2017 | Monitoring MySQL with Prometheus and Grafana by Julien Pivotto
OSMC 2017 | Monitoring  MySQL with Prometheus and Grafana by Julien PivottoOSMC 2017 | Monitoring  MySQL with Prometheus and Grafana by Julien Pivotto
OSMC 2017 | Monitoring MySQL with Prometheus and Grafana by Julien PivottoNETWAYS
 
Build cloud native solution using open source
Build cloud native solution using open source Build cloud native solution using open source
Build cloud native solution using open source Nitesh Jadhav
 
Monitoring using Prometheus and Grafana
Monitoring using Prometheus and GrafanaMonitoring using Prometheus and Grafana
Monitoring using Prometheus and GrafanaArvind Kumar G.S
 
Getting Started: Intro to Telegraf - July 2021
Getting Started: Intro to Telegraf - July 2021Getting Started: Intro to Telegraf - July 2021
Getting Started: Intro to Telegraf - July 2021InfluxData
 
Monitoring kubernetes with prometheus-operator
Monitoring kubernetes with prometheus-operatorMonitoring kubernetes with prometheus-operator
Monitoring kubernetes with prometheus-operatorLili Cosic
 

Similar to System monitoring (20)

Prometheus with Grafana - AddWeb Solution
Prometheus with Grafana - AddWeb SolutionPrometheus with Grafana - AddWeb Solution
Prometheus with Grafana - AddWeb Solution
 
Prometheus and Docker (Docker Galway, November 2015)
Prometheus and Docker (Docker Galway, November 2015)Prometheus and Docker (Docker Galway, November 2015)
Prometheus and Docker (Docker Galway, November 2015)
 
Monitoring in Big Data Platform - Albert Lewandowski, GetInData
Monitoring in Big Data Platform - Albert Lewandowski, GetInDataMonitoring in Big Data Platform - Albert Lewandowski, GetInData
Monitoring in Big Data Platform - Albert Lewandowski, GetInData
 
Prometheus - Intro, CNCF, TSDB,PromQL,Grafana
Prometheus - Intro, CNCF, TSDB,PromQL,GrafanaPrometheus - Intro, CNCF, TSDB,PromQL,Grafana
Prometheus - Intro, CNCF, TSDB,PromQL,Grafana
 
Prometheus-Grafana-RahulSoni1584KnolX.pptx.pdf
Prometheus-Grafana-RahulSoni1584KnolX.pptx.pdfPrometheus-Grafana-RahulSoni1584KnolX.pptx.pdf
Prometheus-Grafana-RahulSoni1584KnolX.pptx.pdf
 
IRJET- Real Time Monitoring of Servers with Prometheus and Grafana for High A...
IRJET- Real Time Monitoring of Servers with Prometheus and Grafana for High A...IRJET- Real Time Monitoring of Servers with Prometheus and Grafana for High A...
IRJET- Real Time Monitoring of Servers with Prometheus and Grafana for High A...
 
Monitoring Kubernetes with Prometheus (Kubernetes Ireland, 2016)
Monitoring Kubernetes with Prometheus (Kubernetes Ireland, 2016)Monitoring Kubernetes with Prometheus (Kubernetes Ireland, 2016)
Monitoring Kubernetes with Prometheus (Kubernetes Ireland, 2016)
 
Prometheus: A Next Generation Monitoring System (FOSDEM 2016)
Prometheus: A Next Generation Monitoring System (FOSDEM 2016)Prometheus: A Next Generation Monitoring System (FOSDEM 2016)
Prometheus: A Next Generation Monitoring System (FOSDEM 2016)
 
Prometheus and Grafana
Prometheus and GrafanaPrometheus and Grafana
Prometheus and Grafana
 
Prometheus (Microsoft, 2016)
Prometheus (Microsoft, 2016)Prometheus (Microsoft, 2016)
Prometheus (Microsoft, 2016)
 
Server monitoring using grafana and prometheus
Server monitoring using grafana and prometheusServer monitoring using grafana and prometheus
Server monitoring using grafana and prometheus
 
From nothing to Prometheus : one year after
From nothing to Prometheus : one year afterFrom nothing to Prometheus : one year after
From nothing to Prometheus : one year after
 
Monitoring MySQL with Prometheus and Grafana
Monitoring MySQL with Prometheus and GrafanaMonitoring MySQL with Prometheus and Grafana
Monitoring MySQL with Prometheus and Grafana
 
OSMC 2017 | Monitoring MySQL with Prometheus and Grafana by Julien Pivotto
OSMC 2017 | Monitoring  MySQL with Prometheus and Grafana by Julien PivottoOSMC 2017 | Monitoring  MySQL with Prometheus and Grafana by Julien Pivotto
OSMC 2017 | Monitoring MySQL with Prometheus and Grafana by Julien Pivotto
 
Build cloud native solution using open source
Build cloud native solution using open source Build cloud native solution using open source
Build cloud native solution using open source
 
Backtrack Manual Part8
Backtrack Manual Part8Backtrack Manual Part8
Backtrack Manual Part8
 
Monitoring using Prometheus and Grafana
Monitoring using Prometheus and GrafanaMonitoring using Prometheus and Grafana
Monitoring using Prometheus and Grafana
 
PRTG
PRTGPRTG
PRTG
 
Getting Started: Intro to Telegraf - July 2021
Getting Started: Intro to Telegraf - July 2021Getting Started: Intro to Telegraf - July 2021
Getting Started: Intro to Telegraf - July 2021
 
Monitoring kubernetes with prometheus-operator
Monitoring kubernetes with prometheus-operatorMonitoring kubernetes with prometheus-operator
Monitoring kubernetes with prometheus-operator
 

Recently uploaded

Why Teams call analytics are critical to your entire business
Why Teams call analytics are critical to your entire businessWhy Teams call analytics are critical to your entire business
Why Teams call analytics are critical to your entire businesspanagenda
 
Mcleodganj Call Girls 🥰 8617370543 Service Offer VIP Hot Model
Mcleodganj Call Girls 🥰 8617370543 Service Offer VIP Hot ModelMcleodganj Call Girls 🥰 8617370543 Service Offer VIP Hot Model
Mcleodganj Call Girls 🥰 8617370543 Service Offer VIP Hot ModelDeepika Singh
 
Six Myths about Ontologies: The Basics of Formal Ontology
Six Myths about Ontologies: The Basics of Formal OntologySix Myths about Ontologies: The Basics of Formal Ontology
Six Myths about Ontologies: The Basics of Formal Ontologyjohnbeverley2021
 
[BuildWithAI] Introduction to Gemini.pdf
[BuildWithAI] Introduction to Gemini.pdf[BuildWithAI] Introduction to Gemini.pdf
[BuildWithAI] Introduction to Gemini.pdfSandro Moreira
 
Apidays New York 2024 - Accelerating FinTech Innovation by Vasa Krishnan, Fin...
Apidays New York 2024 - Accelerating FinTech Innovation by Vasa Krishnan, Fin...Apidays New York 2024 - Accelerating FinTech Innovation by Vasa Krishnan, Fin...
Apidays New York 2024 - Accelerating FinTech Innovation by Vasa Krishnan, Fin...apidays
 
ProductAnonymous-April2024-WinProductDiscovery-MelissaKlemke
ProductAnonymous-April2024-WinProductDiscovery-MelissaKlemkeProductAnonymous-April2024-WinProductDiscovery-MelissaKlemke
ProductAnonymous-April2024-WinProductDiscovery-MelissaKlemkeProduct Anonymous
 
FWD Group - Insurer Innovation Award 2024
FWD Group - Insurer Innovation Award 2024FWD Group - Insurer Innovation Award 2024
FWD Group - Insurer Innovation Award 2024The Digital Insurer
 
Apidays New York 2024 - The Good, the Bad and the Governed by David O'Neill, ...
Apidays New York 2024 - The Good, the Bad and the Governed by David O'Neill, ...Apidays New York 2024 - The Good, the Bad and the Governed by David O'Neill, ...
Apidays New York 2024 - The Good, the Bad and the Governed by David O'Neill, ...apidays
 
EMPOWERMENT TECHNOLOGY GRADE 11 QUARTER 2 REVIEWER
EMPOWERMENT TECHNOLOGY GRADE 11 QUARTER 2 REVIEWEREMPOWERMENT TECHNOLOGY GRADE 11 QUARTER 2 REVIEWER
EMPOWERMENT TECHNOLOGY GRADE 11 QUARTER 2 REVIEWERMadyBayot
 
Strategies for Landing an Oracle DBA Job as a Fresher
Strategies for Landing an Oracle DBA Job as a FresherStrategies for Landing an Oracle DBA Job as a Fresher
Strategies for Landing an Oracle DBA Job as a FresherRemote DBA Services
 
Finding Java's Hidden Performance Traps @ DevoxxUK 2024
Finding Java's Hidden Performance Traps @ DevoxxUK 2024Finding Java's Hidden Performance Traps @ DevoxxUK 2024
Finding Java's Hidden Performance Traps @ DevoxxUK 2024Victor Rentea
 
Polkadot JAM Slides - Token2049 - By Dr. Gavin Wood
Polkadot JAM Slides - Token2049 - By Dr. Gavin WoodPolkadot JAM Slides - Token2049 - By Dr. Gavin Wood
Polkadot JAM Slides - Token2049 - By Dr. Gavin WoodJuan lago vázquez
 
Biography Of Angeliki Cooney | Senior Vice President Life Sciences | Albany, ...
Biography Of Angeliki Cooney | Senior Vice President Life Sciences | Albany, ...Biography Of Angeliki Cooney | Senior Vice President Life Sciences | Albany, ...
Biography Of Angeliki Cooney | Senior Vice President Life Sciences | Albany, ...Angeliki Cooney
 
Vector Search -An Introduction in Oracle Database 23ai.pptx
Vector Search -An Introduction in Oracle Database 23ai.pptxVector Search -An Introduction in Oracle Database 23ai.pptx
Vector Search -An Introduction in Oracle Database 23ai.pptxRemote DBA Services
 
Rising Above_ Dubai Floods and the Fortitude of Dubai International Airport.pdf
Rising Above_ Dubai Floods and the Fortitude of Dubai International Airport.pdfRising Above_ Dubai Floods and the Fortitude of Dubai International Airport.pdf
Rising Above_ Dubai Floods and the Fortitude of Dubai International Airport.pdfOrbitshub
 
Cloud Frontiers: A Deep Dive into Serverless Spatial Data and FME
Cloud Frontiers:  A Deep Dive into Serverless Spatial Data and FMECloud Frontiers:  A Deep Dive into Serverless Spatial Data and FME
Cloud Frontiers: A Deep Dive into Serverless Spatial Data and FMESafe Software
 
ICT role in 21st century education and its challenges
ICT role in 21st century education and its challengesICT role in 21st century education and its challenges
ICT role in 21st century education and its challengesrafiqahmad00786416
 
Cloud Frontiers: A Deep Dive into Serverless Spatial Data and FME
Cloud Frontiers:  A Deep Dive into Serverless Spatial Data and FMECloud Frontiers:  A Deep Dive into Serverless Spatial Data and FME
Cloud Frontiers: A Deep Dive into Serverless Spatial Data and FMESafe Software
 
Apidays New York 2024 - Passkeys: Developing APIs to enable passwordless auth...
Apidays New York 2024 - Passkeys: Developing APIs to enable passwordless auth...Apidays New York 2024 - Passkeys: Developing APIs to enable passwordless auth...
Apidays New York 2024 - Passkeys: Developing APIs to enable passwordless auth...apidays
 

Recently uploaded (20)

Why Teams call analytics are critical to your entire business
Why Teams call analytics are critical to your entire businessWhy Teams call analytics are critical to your entire business
Why Teams call analytics are critical to your entire business
 
Mcleodganj Call Girls 🥰 8617370543 Service Offer VIP Hot Model
Mcleodganj Call Girls 🥰 8617370543 Service Offer VIP Hot ModelMcleodganj Call Girls 🥰 8617370543 Service Offer VIP Hot Model
Mcleodganj Call Girls 🥰 8617370543 Service Offer VIP Hot Model
 
+971581248768>> SAFE AND ORIGINAL ABORTION PILLS FOR SALE IN DUBAI AND ABUDHA...
+971581248768>> SAFE AND ORIGINAL ABORTION PILLS FOR SALE IN DUBAI AND ABUDHA...+971581248768>> SAFE AND ORIGINAL ABORTION PILLS FOR SALE IN DUBAI AND ABUDHA...
+971581248768>> SAFE AND ORIGINAL ABORTION PILLS FOR SALE IN DUBAI AND ABUDHA...
 
Six Myths about Ontologies: The Basics of Formal Ontology
Six Myths about Ontologies: The Basics of Formal OntologySix Myths about Ontologies: The Basics of Formal Ontology
Six Myths about Ontologies: The Basics of Formal Ontology
 
[BuildWithAI] Introduction to Gemini.pdf
[BuildWithAI] Introduction to Gemini.pdf[BuildWithAI] Introduction to Gemini.pdf
[BuildWithAI] Introduction to Gemini.pdf
 
Apidays New York 2024 - Accelerating FinTech Innovation by Vasa Krishnan, Fin...
Apidays New York 2024 - Accelerating FinTech Innovation by Vasa Krishnan, Fin...Apidays New York 2024 - Accelerating FinTech Innovation by Vasa Krishnan, Fin...
Apidays New York 2024 - Accelerating FinTech Innovation by Vasa Krishnan, Fin...
 
ProductAnonymous-April2024-WinProductDiscovery-MelissaKlemke
ProductAnonymous-April2024-WinProductDiscovery-MelissaKlemkeProductAnonymous-April2024-WinProductDiscovery-MelissaKlemke
ProductAnonymous-April2024-WinProductDiscovery-MelissaKlemke
 
FWD Group - Insurer Innovation Award 2024
FWD Group - Insurer Innovation Award 2024FWD Group - Insurer Innovation Award 2024
FWD Group - Insurer Innovation Award 2024
 
Apidays New York 2024 - The Good, the Bad and the Governed by David O'Neill, ...
Apidays New York 2024 - The Good, the Bad and the Governed by David O'Neill, ...Apidays New York 2024 - The Good, the Bad and the Governed by David O'Neill, ...
Apidays New York 2024 - The Good, the Bad and the Governed by David O'Neill, ...
 
EMPOWERMENT TECHNOLOGY GRADE 11 QUARTER 2 REVIEWER
EMPOWERMENT TECHNOLOGY GRADE 11 QUARTER 2 REVIEWEREMPOWERMENT TECHNOLOGY GRADE 11 QUARTER 2 REVIEWER
EMPOWERMENT TECHNOLOGY GRADE 11 QUARTER 2 REVIEWER
 
Strategies for Landing an Oracle DBA Job as a Fresher
Strategies for Landing an Oracle DBA Job as a FresherStrategies for Landing an Oracle DBA Job as a Fresher
Strategies for Landing an Oracle DBA Job as a Fresher
 
Finding Java's Hidden Performance Traps @ DevoxxUK 2024
Finding Java's Hidden Performance Traps @ DevoxxUK 2024Finding Java's Hidden Performance Traps @ DevoxxUK 2024
Finding Java's Hidden Performance Traps @ DevoxxUK 2024
 
Polkadot JAM Slides - Token2049 - By Dr. Gavin Wood
Polkadot JAM Slides - Token2049 - By Dr. Gavin WoodPolkadot JAM Slides - Token2049 - By Dr. Gavin Wood
Polkadot JAM Slides - Token2049 - By Dr. Gavin Wood
 
Biography Of Angeliki Cooney | Senior Vice President Life Sciences | Albany, ...
Biography Of Angeliki Cooney | Senior Vice President Life Sciences | Albany, ...Biography Of Angeliki Cooney | Senior Vice President Life Sciences | Albany, ...
Biography Of Angeliki Cooney | Senior Vice President Life Sciences | Albany, ...
 
Vector Search -An Introduction in Oracle Database 23ai.pptx
Vector Search -An Introduction in Oracle Database 23ai.pptxVector Search -An Introduction in Oracle Database 23ai.pptx
Vector Search -An Introduction in Oracle Database 23ai.pptx
 
Rising Above_ Dubai Floods and the Fortitude of Dubai International Airport.pdf
Rising Above_ Dubai Floods and the Fortitude of Dubai International Airport.pdfRising Above_ Dubai Floods and the Fortitude of Dubai International Airport.pdf
Rising Above_ Dubai Floods and the Fortitude of Dubai International Airport.pdf
 
Cloud Frontiers: A Deep Dive into Serverless Spatial Data and FME
Cloud Frontiers:  A Deep Dive into Serverless Spatial Data and FMECloud Frontiers:  A Deep Dive into Serverless Spatial Data and FME
Cloud Frontiers: A Deep Dive into Serverless Spatial Data and FME
 
ICT role in 21st century education and its challenges
ICT role in 21st century education and its challengesICT role in 21st century education and its challenges
ICT role in 21st century education and its challenges
 
Cloud Frontiers: A Deep Dive into Serverless Spatial Data and FME
Cloud Frontiers:  A Deep Dive into Serverless Spatial Data and FMECloud Frontiers:  A Deep Dive into Serverless Spatial Data and FME
Cloud Frontiers: A Deep Dive into Serverless Spatial Data and FME
 
Apidays New York 2024 - Passkeys: Developing APIs to enable passwordless auth...
Apidays New York 2024 - Passkeys: Developing APIs to enable passwordless auth...Apidays New York 2024 - Passkeys: Developing APIs to enable passwordless auth...
Apidays New York 2024 - Passkeys: Developing APIs to enable passwordless auth...
 

System monitoring

  • 1. SYSTEM MONITORINGSYSTEM MONITORING A guide to setup system monitoring on your systems or servers
  • 2. Why to even Monitor your sytem ? ● Monitoring a computer system is just as important as the system itself. ● Monitoring allows for proactive response rather than reactive, data security and data gathering and the overall good health of a computer system. ● While monitoring does not fix problems, it does lead to more stable and reliable computer systems. ● For example, monitoring may alert a System Administrator that a hard drive in a server is degraded. The System Administrator is alerted of this and swaps out the degraded hard drive with a new one. Without monitoring, the degraded hard drive could turn into a failed hard drive causing an extended outage and possible data loss.
  • 3. Monitoring Tools - Monitoring tools are used to continuously keep track of the status of the system in use, in order to have the earliest warning of failures, defects or problems and to improve them. - There are monitoring tools for servers, networks, databases, security, performance, website and internet usage, and applications. - ➔ Features ➔ To log real-time and historical information. ➔ To find optimal settings. ➔ To monitor the number of users on a network. ➔ To monitor network traffic (either in real time or covering a given length of time of operation with the analysis performed afterwards). ➔ To identify the problems and send an alert message to the administrator (e.g. network administrator).
  • 4. Tools Required Grafana An Open Source visualization and analytics software Prometheus A free software application used for event monitoring and alerting. Node Exporter A Linux Metric Exporter for Prometheus
  • 5. Prometheus - Prometheus is a free software application used for event monitoring and alerting. It records real-time metrics in a time series database built using a HTTP pull model, with flexible queries and real-time alerting. - Prometheus was created to monitor highly dynamic container environments like kubernetes docker swarm etc however it can also be used in a traditional non container infrastructure where you have just bare servers with applications deployed directly on them. - Features : ● A multi-dimensional data model with time series data identified by metric name and key/value pairs ● PromQL, a flexible query language to leverage this dimensionality ● No reliance on distributed storage; single server nodes are autonomous ● Time series collection happens via a pull model over HTTP ● Pushing time series is supported via an intermediary gateway ● Targets are discovered via service discovery or static configuration ● Multiple modes of graphing and dashboarding support
  • 6. Why use Prometheus ? Identify the source of problem
  • 8. Node Exporter - Prometheus pulls metrics data from the targets from an HTTP endpoint which by default is host address slash metrics and for that to work the targets must expose => /metrics endpoint . - Data available at slash metrics endpoint must be in the format that Prometheus understands and many services don't have native Prometheus endpoints so extra components are required. - Exporter is basically a script or service that fetches metrics from target and converts them into a format Prometheus can understand and exposes this converted data at its own slash metrics endpoint where Prometheus can scrape them. - Node Exporter is the Prometheus exporter for Linux servers.
  • 10. Setup and Configuration -1 (Prometheus and Node Exporter) ● First, download and add the GPG key with the following command: $ wget https://s3-eu-west-1.amazonaws.com/ deb.robustperception.io/41EFC99D.gpg | sudo apt-key add - ● Next, update the repository and install Prometheus with the following command: $ sudo apt-get update -y $ sudo apt-get install prometheus prometheus-node-exporter prometheus-pushgateway prometheus-alertmanager -y ● Once the installation is completed, start Prometheus service and enable it to start on boot time with the following command: $ sudo systemctl start prometheus $ sudo systemctl enable prometheus ● You can also check the status of Prometheus service with the following command: $ sudo systemctl status prometheus
  • 11. ● Configure prometheus.yml file to scrape metrics from node exporter which runs on PORT=9100. job_name: node # If prometheus-node-exporter is installed, grab stats about the local # machine by default. static_configs: - targets: ['localhost:9100'] ● Also change scrape_interval in the same config file so load on server is reduced. global: scrape_interval: 60s # By default, scrape targets every 15 seconds. evaluation_interval: 60s # By default, scrape targets every 15 seconds. Setup and Configuration -2 (Prometheus and Node Exporter)
  • 12. Grafana - Grafana is open source visualization and analytics software. It allows you to query, visualize, alert on, and explore your metrics no matter where they are stored. In general, it provides you with tools to turn your time-series database (TSDB) data into beautiful graphs and visualizations. - Grafana connects with every possible data source, commonly referred to as databases such as Graphite, Prometheus, Influxdb, ElasticSearch, MySQL, PostgreSQL etc. - Dashboard - The dashboards contain a gamut of visualization options such as geo maps, heat maps, histograms, all the variety of charts & graphs which a business typically requires to study data. See a demo board on - https://play.grafana.org/
  • 13. Setup and Configuration ● Installation $ sudo apt-get install -y apt-transport-https $ sudo apt-get install -y software-properties-common wget $ wget -q -O - https://packages.grafana.com/gpg.key | sudo apt-key add - $ sudo apt-get update $ sudo apt-get install grafana-enterprise ● Setup ○ Start the server with systemd $ sudo systemctl daemon-reload $ sudo systemctl start grafana-server $ sudo systemctl status grafana-server ○ Configure Grafana to start at boot $ sudo systemctl enable grafana-server.service - By default Grafana runs at PORT 3000 which can be changed by editing /etc/grafana/grafana.ini ● Change http_port to your desired port. [server] http_port=8080
  • 14. Good luck! We hope you’ll use these tips to go out and deliver a robust monitoring for your product or service! Reference : ● https://youtu.be/h4Sl21AKiDg ● https://prometheus.io/docs/prometheus/latest /getting_started/