Estimating ffCO2 emissions using 14CO2 measurements
•
0 likes•12 views

This study uses atmospheric 14CO2 measurements to estimate fossil fuel (ff) CO2 emission hotspots in an urban area along the Rhine valley. Two approaches are compared: 1) an upwind-downwind approach using paired stations to estimate background levels, and 2) a regional background approach. The ffCO2 concentrations ranged from 0-10 ppm. Uncertainties were about 1.2 ppm for the upwind-downwind approach and 50-100% higher for the regional approach. There was also a strong correlation found between total CO2 and ffCO2 offsets across the study area, indicating total CO2 can serve as a proxy for ffCO2. However, accounting for nuclear 14C contamination remained challenging

Recommended
Recommended
More Related Content
What's hot
What's hot (19)
Similar to Estimating ffCO2 emissions using 14CO2 measurements
Similar to Estimating ffCO2 emissions using 14CO2 measurements (20)
More from Integrated Carbon Observation System (ICOS)
More from Integrated Carbon Observation System (ICOS) (20)
Recently uploaded
Recently uploaded (20)
Estimating ffCO2 emissions using 14CO2 measurements
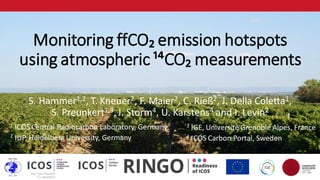
- 1. Monitoring ffCO₂ emission hotspots using atmospheric ¹⁴CO₂ measurements 1 ICOS Central Radiocarbon Laboratory, Germany 2 IUP, Heidelberg University, Germany S. Hammer1,2, T. Kneuer2, F. Maier2, C. Rieß2, J. Della Coletta1, S. Preunkert1,3, I. Storm4, U. Karstens4 and I. Levin2 3 IGE, Université Grenoble Alpes, France 4 ICOS Carbon Portal, Sweden
- 2. Estimating the fossil fuel CO2 concentration enhancement of an urban emission area • Lagrangian up- and downwindapproach • Use 14CO2 to separate ff and bio CO2 contributions Urban emission area 2
- 3. Estimating the fossil fuel CO2 concentration enhancement of an urban emission area • Lagrangian up- and downwindapproach • Use 14CO2 to separate ff and bio CO2 contributions Upwind station Downwind station Urban emission area 3
- 4. Estimating the fossil fuel CO2 concentration enhancement of an urban emission area • Lagrangian up- and downwindapproach • Use 14CO2 to separate ff and bio CO2 contributions Upwind station Downwind station Urban emission area • INFLUX was the pioneer for Lagrangian urban CO2 networks INFLUXexperiment Richardson, et al., Elem. Sci. Anth (2017). 4
- 5. RINGO approach: • Investigate synergies with the ICOS atmosphere network to perform urban upwind and downwind measurements. (poor men's INFLUX). • Model supported sampling strategy to ensure the best possible approximation of Lagrangian conditions. FRE HEI CO2 emission data provided by TNO 5
- 6. Open questions… • Which background measurement can be used for 14CO2-based ffCO2 estimates? • Does nuclear 14C contamination influence this choice? • Is the total CO2- offset a good proxy for the fossil fuel CO2 enhancement? FRE HEI SSL @ 1100m NN Photo:ChristophZinsius/UBA CO2 emission data provided by TNO 6
- 7. 7 14CO2 observations in the Rhine valley
- 8. 14CO2 observations in the Rhine valley 8 Assume you have 100 14CO2 samples, which sampling strategy will provide the better ffCO2 estimate during the dormant season?
- 9. 14CO2 observations in the Rhine valley 9 Assume you have 100 14CO2 samples, which sampling strategy will provide the better ffCO2 estimate during the dormant season? Strategy A: up- / downwind approach I happily spend half of my samples to have a better estimate of the background conditions!
- 10. 14CO2 observations in the Rhine valley 10 Assume you have 100 14CO2 samples, which sampling strategy will provide the better ffCO2 estimate during the dormant season? Strategy B: regional BG approach I accept a larger background uncertainty, but I get twice the downwind samples! Strategy A: up- / downwind approach I happily spend half of my samples to have a better estimate of the background conditions!
- 11. 14CO2 observations in the Rhine valley 11
- 12. 14CO2 observations – corrected for 14Cnuc 12
- 13. 14CO2 observations – corrected for 14Cnuc • Std. dev. of upwind samples from the BG-fit: 4.3‰ during dormant season. • Average difference: 0.2 ‰. 13 Std. dev.: 4.3‰
- 14. 14CO2 observations – corrected for 14Cnuc 14
- 15. 14CO2 observations – corrected for 14Cnuc • magnitude of nuc. correction varies • nuc. correction largely inherent in the two-station approach 15
- 16. Annual mean nuc 14C emissions: WRF: - ERA-5 (0.25°) - 2 km x 2 km STILT: - ECMWF op. Analysis (0.25°) - 10 km x 10 km Is the modelled nuclear 14C correction reliable? WRF: nuccorr= 0.6 ‰ STILT: nuccorr= 8.2 ‰ RAdioactive Dis- chargesDatabase 16 Footprint 240h back Footprint 72 h back
- 17. 0 1 2 3 4 5 6 7 8 9 10 11 12 13 0 5 10 15 STILT WRF nucinfluenceD14 CO2[‰] flask no. Nuclear 14C contributions from WRF and STILT analytical 14C uncertainty 17
- 18. ffCO2 uncertainty budget for different 14CO2-BGs Upwind / downwind approach Uncertainties Regional BG approach 2.3 ‰ Background estimate 4.3 ‰ 2.3 ‰ Downwind measurement 2.3 ‰ all both models agree 0.5 ‰ Footprint 14Cnuc correction 4 ‰ 1 ‰ 0.5 ‰ 14Cnuc emi strength (err. 100%) 2 ‰ 1 ‰ 3.3 ‰ ~ 1.2ppm ffCO2 Total 6.6 ‰ ~ 2.4ppm ffCO2 5.1 ‰ ~ 1.8ppm ffCO2 18
- 19. Up-/downwind vs. regional ffCO2 estimates 19
- 20. Up-/downwind vs. regional ffCO2 estimates 20
- 21. Up-/downwind vs. regional ffCO2 estimates 21
- 22. Up-/downwind vs. regional ffCO2 estimates 22
- 23. Summary • Synergies with ICOS stations can be used to investigate emissions from nearby urban areas. • ffCO2 concentrations in the Rhine valley experiment range between 0 ppm and 10 ppm. • ffCO2 uncertainties are about 1.2ppm in the up-/downwind approach and 50% to 100% larger in the regional background approach. 23
- 24. Open questions… • Which background measurement can be used for 14CO2-based ffCO2 estimates? • Does nuclear 14C contamination influence this choice? • Is the total CO2- offset a good proxy for the fossil fuel CO2 enhancement? FRE HEI SSL @ 1100m NN Photo:ChristophZinsius/UBA CO2 emission data provided by TNO 24
- 25. -2 0 2 4 6 8 10 12 14 -2 0 2 4 6 8 10 12 ffCO2[ppm] up-/downwindapproach total CO2 difference [ppm] (down - upwind) 1:1 ffCO2 share on the total CO2 difference slope = 1.09 ± 0.16 R² = 0.76 25
- 26. -2 0 2 4 6 8 10 12 14 -2 0 2 4 6 8 10 12 ffCO2[ppm] up-/downwindapproach total CO2 difference [ppm] (down - upwind) 1:1 ffCO2 share on the total CO2 difference slope = 1.09 ± 0.16 R² = 0.76 26
- 27. -2 0 2 4 6 8 10 12 14 -2 0 2 4 6 8 10 12 ffCO2[ppm] up-/downwindapproach total CO2 difference [ppm] (down - upwind) 1:1 ffCO2 share on the total CO2 difference slope = 1.09 ± 0.16 R² = 0.76 Bio Fossil fuel 27
- 28. Summary • Synergies with ICOS stations can be used to investigate emissions from nearby urban areas. • ffCO2 concentrations in the Rhine valley experiment range between 0 ppm and 10 ppm. • ffCO2 uncertainties are about 1.2ppm in the up-/downwind approach and 50% to 100% larger in the regional background approach. • Strong correlation between the total CO2 and the ffCO2 offset across the Rhine valley area. 28
- 29. Annual mean nuc 14C emissions: WRF: - ERA-5 (0.25°) - 2 km x 2 km STILT: - ECMWF op. Analysis (0.25°) - 10 km x 10 km Is the modelled nuclear 14C correction reliable? WRF: nuccorr= 21.4 ‰ STILT: nuccorr= 1.1 ‰ RAdioactive Dis- chargesDatabase 29