Zweifel, Roman: Variability in annual tree growth – how much determination of the past is in the present response?
•
0 likes•59 views

ICOS Science Conference 2020, Session 18

Recommended
Recommended
More Related Content
Similar to Zweifel, Roman: Variability in annual tree growth – how much determination of the past is in the present response?
Similar to Zweifel, Roman: Variability in annual tree growth – how much determination of the past is in the present response? (20)
More from Integrated Carbon Observation System (ICOS)
More from Integrated Carbon Observation System (ICOS) (20)
Recently uploaded
Recently uploaded (20)
Zweifel, Roman: Variability in annual tree growth – how much determination of the past is in the present response?
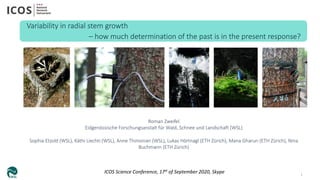
- 1. Variability in radial stem growth – how much determination of the past is in the present response? Roman Zweifel Eidgenössische Forschungsanstalt für Wald, Schnee und Landschaft (WSL) Sophia Etzold (WSL), Käthi Liechti (WSL), Anne Thimonier (WSL), Lukas Hörtnagl (ETH Zürich), Mana Gharun (ETH Zürich), Nina Buchmann (ETH Zürich) 1 ICOS Science Conference, 17st of September 2020, Skype
- 2. 2 • Swiss Alps • Norway spruce (Picea abies) • 1640 m a.s.l. • Average tree age 270 years • Tree height max: around 30 m • ICOS Class 1 vegetation site • 22 years of continuous data Subalpine site Davos (CH-DAV)
- 3. 3 Growth measurements Water exchange between wood and bark F∆Ψ XB FTissue ∆RF∆Ψ AS Wood (Xylem) Bark (Cambium, Phloem, Parenchyma) Wood I Bark Sapflow TWD GRO[µm] 18 days Tree water deficit TWD Radial stem growth (GRO) GRO • Automated high-presicion dendrometer • 30 sec exec/10 min averages • Growth includes wood and bark increments • Growth = cell expansion (xylem and phloem) • Detrended for water- related variations (Zweifel et al 2016, New Phytol.)
- 4. 0 5 10 15 0 100 200 300 annualGRO[mm] ● ● ● 2003 2015 2018 0 20 40 60 80 100 0 100 200 300 annualpercentageGRO[%] ● ● ● 2003 2015 2018 4 • Median radial increment: 1.5 mm yr-1 • 80% of growth in Jun/Jul • Largest C-uptake in May Variability in radial stem growth 01 02 03 04 05 06 07 08 09 10 11 12 020406080100 Percentmonthlycontribution(%) month NEE DOY
- 5. 5 • Gradually changing increments (with one jump in 2006) • Trend of increasing growth (1997-2018) Variability in annual tree growth Rel.annualincrement(%)
- 6. y 6 • Trend of increasing temperature (1997- 2018) Variability in annual temperature 1997 1998 1999 2000 2001 2002 2003 2004 2005 2006 2007 2008 2009 2010 2011 2012 2013 2014 2015 2016 2017 2018 −2 −1 0 1 2 DeviationgsTemperature[°C]
- 7. 7 • Trend of decreasing precipitation (1997-2018) Variability in annual precipitation 1997 1998 1999 2000 2001 2002 2003 2004 2005 2006 2007 2008 2009 2010 2011 2012 2013 2014 2015 2016 2017 2018 −200 −100 0 100 200 300 DeviationgsPrecipitation[mm]
- 8. 8 Variability in daily growth Linear regression model (single variable): Daily growth is most strongly related to RH (out of Temp, Precip, VPD, WB, SWP, RH): R2 = 0.19 Linear regression model: • Atmospheric moisture conditions mainly determine/limit growth • Less < 20% of variance explained
- 9. 9 Explanation of variability in annual tree growth Multi variables linear regression modelling 0 500 1000 1500 2000 0 500 1000 1500 2000 Predictedgrowth[um] Observed growth [um] adj.R2=0.54** Current year meteorological variables Rgwinter Precipwinter WBspring.min VPDspring.max -434*** -320** -303** -236* adj R2 = 0.54** Best model with maximum predictors=4 • Annual and seasonal meteorological variables: • Temperature, Precipitation, Relative Humidity, Radiation, VPD, Water balance • Included:"rg.winter","precip_sum.winter ","temp.winter_min","temp.winter_max" ,"rg.winter_max", "vpd.winter_max","vpd.winter" ,"WB.winter_min", "precip_sum.spring" ,"temp.spring_min","temp.spring_max", "rg.spring_max","vpd.spring_max","vpd. spring","WB.spring_min", "precip_sum.summer","temp.summer_ min","vpd.summer","WB.summer_min", "temp.veg_min" ,"rg.veg_max", "vpd.veg_max","vpd.veg"
- 10. 0 500 1000 1500 2000 0 500 1000 1500 2000 Predictedgrowth[um] Observed growth [um] adj.R2=0.70*** 10 Explanation of variability in annual tree growth Multi variables linear regression modelling 0 500 1000 1500 2000 0 500 1000 1500 2000 Predictedgrowth[um] Observed growth [um] adj.R2=0.54** Current year Current and past year variables Rgwinter Precipwinter WBspring.min VPDspring.max -434*** -320** -303** -236* Precipautumn-1 Tempspring.min Tempspring.min-1 VPDautumn-1 -338*** 226*** -208*** -185** adj R2 = 0.54** adj R2 = 0.70***
- 11. 0 500 1000 1500 2000 0 500 1000 1500 2000 Predictedgrowth[um] Observed growth [um] adj.R2=0.70*** 11 Explanation of variability in annual tree growth Multi variables linear regression modelling Current year Current and past year variables Precipautumn-1 Tempspring.min Tempspring.min-1 VPDautumn-1 -338*** 226*** -208*** -185** adj R2 = 0.70***Conclusion … • Past conditions considerably explain growth … raises new questions • ??? • What do these delayed responses mean? • How can we link past conditions into a physiolopgical model?
- 12. 12 Past conditions determine current response SCIENCE sciencemag.org 31 JULY 2015 • VOL 349 ISSUE 6247 What are potential mechanisms behind ‘legacy effects’ ‘ecological memory’ ‘carry-over effects’?
- 13. 13 Explanation of variability in annual tree growth Requirement • Past conditions need to be stored in a tree to affect today’s physiology Idea • Functional organs and reserves that are built up over several years are the ‘ecological memory’
- 14. 14 Explanation of variability in annual tree growth Ecological memory • Crown: patchwork of needles from several years • Sapwood: Collection of tree rings built over many years • Carbon storage: Accumulated and depleted over decades • Buds: predisposed in the year before
- 15. 15 Explanation of variability in annual tree growth Today’s functionality depends on conditions of many years back in time • Crown: needle size/shape changes with conditions • Sapwood: a tree ring of a dry year is different from a tree ring of a wet year -> different hydraulic properties
- 16. 16 Explanation of variability in annual tree growth Conclusion • In such an approach a good/poor year keeps its effect on future physiological responses as long as the structure that was built in this year is kept functional. • KEY is lifetime/turnover rate of organs and reserves
- 17. 17 Explanation of variability in annual tree growth
- 18. 18 Explanation of variability in annual tree growth Expectation • A tree with short organ/reserve lifetimes will closely respond to current environmental conditions Expectation • A tree with long organ/reserve lifetimes will respond with delay to current environmental conditions
- 19. 19 Explanation of variability in annual tree growth Model findings • The longer the lifetimes of organs and reserves are, the stronger is the legacy effect of past conditions on the physiological response • The stronger the legacy effect is, the lower is the explanatory power of current conditions on growth
- 20. 20 Pine trees: • Responded with a delayed growth response on a treatment change of 4 years. • Pines’ needle turnover rate was 4-5 years!! Explanation of variability in annual tree growth
- 21. 21 Case of Davos spruce is not solved yet: • No experimental change of conditions possible • More difficult to pinpoint influences from the past • However, crown size may also here play a role: relationship between crown transparency of the past year is more closely related to stem growth than the current year one. ● ● ● ● ● ● ● ● ● ● ● ● ●● ● ● ● ● ● ● ● ● ● ● ● ● 10 15 20 25 30 35 40 2006 2008 2010 2012 2014 2016 2018 meancrowntransparency(%) ● ● ● ● ● ● ● ● ● ● ● ● ● ● 600 800 1000 1200 1400 1600 meanGRO.yr(mm) ● ● crown transparency growth R2 GRO vs current crown transparency: 0.26 R2 GRO vs past year crown transparency: 0.52 Variability in radial stem growth – how much determination of the past is in the present response?
- 22. 22 Take home message • Past conditions have an effect on the actual growth performance of trees • Legacy effect: trees’ current physiology is altered by it’s history • Past conditions are suggested to be stored in functional structures e.g. needles, sapwood, carbon reserves • The longer the lifetime/turnover rate of these structures, the more current growth is decoupled from current conditions and the more it can be explained by past environmental conditions. Variability in radial stem growth – how much determination of the past is in the present response?
- 23. Variability in radial stem growth – how much determination of the past is in the present response? Roman Zweifel Eidgenössische Forschungsanstalt für Wald, Schnee und Landschaft (WSL) Sophia Etzold (WSL), Käthi Liechti (WSL), Anne Thimonier (WSL), Lukas Hörtnagl (ETH Zürich), Mana Gharun (ETH Zürich), Nina Buchmann (ETH Zürich) 23 ICOS Science Conference, 17st of September 2020, Skype