4. Daily Monthly Duration
Change Change (Years)
Jan-11 10,71 10,71 10,67 0,00 0,04 0,18
Apr-11 10,76 10,77 10,79 0,00 -0,03 0,42
Jul-11 10,97 11,00 11,09 -0,02 -0,11 0,93
Oct-11 11,22 11,26 11,37 -0,05 -0,15 0,67
Jul-12 11,82 11,91 11,87 -0,09 -0,05 1,68
Jan-13 11,96 12,03 11,91 -0,07 0,05 2,18
Source: ANDIMA, Bloomberg and CM Capital Markets
Source: ANDIMA, Bloomberg and CM Capital Markets
* Premium = LTN - Corresponding DI Contract
Maturity
Traded
Volume
Share
%
5 Days
Average
30 Days
Average
Jan-11 198.787 2,5% 681.554 548.032
Apr-11 11.100 0,1% 67.052 288.714
Jul-11 220.848 2,8% 393.915 424.054
Oct-11 0 0,0% 2.000 46.922
Jul-12 196.225 2,5% 659.685 1.028.349
Jan-13 7.339.127 92,1% 1.817.652 1.041.756
Total 7.966.087 100,00% 3.621.858 3.377.827
Source: BCB and CM Capital Markets
LTN
DV 01
(For 50K Notes)
Maturity 09/24/10
Source: ANDIMA, Bloomberg and CM Capital Markets
(2.220,07)USD
(1.654,05)USD
10/25/1010/26/10
(464,89)USD
(1.077,29)USD
Source: ANDIMA, Bloomberg and CM Capital Markets
(4.452,82)USD
(3.638,26)USD
LTN
Source: BCB and CM Capital Markets Source: BCB and CM Capital Markets
Source: BCB and CM Capital Markets
LTN's Highlight
LTN Traded Volume
0
2.000
4.000
6.000
8.000
10.000
12.000
14-Sep-10
15-Sep-10
16-Sep-10
17-Sep-10
20-Sep-10
21-Sep-10
22-Sep-10
23-Sep-10
24-Sep-10
27-Sep-10
28-Sep-10
29-Sep-10
30-Sep-10
1-Oct-10
4-Oct-10
5-Oct-10
6-Oct-10
7-Oct-10
8-Oct-10
11-Oct-10
13-Oct-10
14-Oct-10
15-Oct-10
18-Oct-10
19-Oct-10
20-Oct-10
21-Oct-10
22-Oct-10
25-Oct-10
26-Oct-10
K
LTN Traded Contracts
Moving Average - 5 Days
Moving Average - 30 Days
LTN Jul-12 Traded Volume
0
500
1.000
1.500
2.000
2.500
3.000
3.500
4.000
4.500
5.000
14-Sep-10
15-Sep-10
16-Sep-10
17-Sep-10
20-Sep-10
21-Sep-10
22-Sep-10
23-Sep-10
24-Sep-10
27-Sep-10
28-Sep-10
29-Sep-10
30-Sep-10
1-Oct-10
4-Oct-10
5-Oct-10
6-Oct-10
7-Oct-10
8-Oct-10
11-Oct-10
13-Oct-10
14-Oct-10
15-Oct-10
18-Oct-10
19-Oct-10
20-Oct-10
21-Oct-10
22-Oct-10
25-Oct-10
26-Oct-10
K
LTN Jul-12
Moving Average - 5 Days
Moving Average - 30 Days
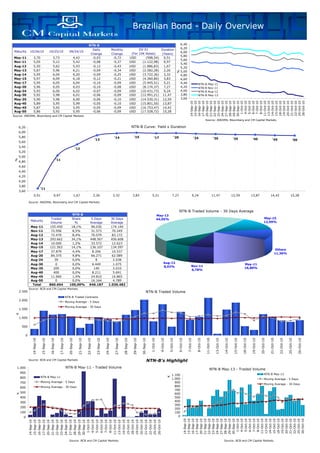
LTN Curve
10,71
10,76
10,97
11,22
11,82
11,96
10,60
10,80
11,00
11,20
11,40
11,60
11,80
12,00
12,20
Jan-11 Apr-11 Jul-11 Oct-11 Jul-12 Jan-13
%
LTN Premium* (bps)
9,75
10,25
10,75
11,25
11,75
12,25
12,75
13,25
13,75
14-Sep-10
15-Sep-10
16-Sep-10
17-Sep-10
20-Sep-10
21-Sep-10
22-Sep-10
23-Sep-10
24-Sep-10
27-Sep-10
28-Sep-10
29-Sep-10
30-Sep-10
1-Oct-10
4-Oct-10
5-Oct-10
6-Oct-10
7-Oct-10
8-Oct-10
11-Oct-10
13-Oct-10
14-Oct-10
15-Oct-10
18-Oct-10
19-Oct-10
20-Oct-10
21-Oct-10
22-Oct-10
25-Oct-10
26-Oct-10
10,50
11,00
11,50
12,00
12,50
13,00
13,50
14,00
14,50
15,00
15,50
Jul-12 Premium (left)
Jan-13 Premium (right)
10,90
11,10
11,30
11,50
11,70
11,90
12,10
14-Sep-10
15-Sep-10
16-Sep-10
17-Sep-10
20-Sep-10
21-Sep-10
22-Sep-10
23-Sep-10
24-Sep-10
27-Sep-10
28-Sep-10
29-Sep-10
30-Sep-10
1-Oct-10
4-Oct-10
5-Oct-10
6-Oct-10
7-Oct-10
8-Oct-10
11-Oct-10
13-Oct-10
14-Oct-10
15-Oct-10
18-Oct-10
19-Oct-10
20-Oct-10
21-Oct-10
22-Oct-10
25-Oct-10
26-Oct-10
%
LTN Jul-11
LTN Jul-12
LTN Jan-13
Brazilian Bond - Daily Overview
LTN Traded Volume - 30 Days Average
Jan-11
16,22%
Jul-11
12,55%
Jan-13
30,84%Others
9,94%
Jul-12
30,44%
LTN Jan-13 Traded Volume
0
1.000
2.000
3.000
4.000
5.000
6.000
7.000
8.000
14-Sep-10
15-Sep-10
16-Sep-10
17-Sep-10
20-Sep-10
21-Sep-10
22-Sep-10
23-Sep-10
24-Sep-10
27-Sep-10
28-Sep-10
29-Sep-10
30-Sep-10
1-Oct-10
4-Oct-10
5-Oct-10
6-Oct-10
7-Oct-10
8-Oct-10
11-Oct-10
13-Oct-10
14-Oct-10
15-Oct-10
18-Oct-10
19-Oct-10
20-Oct-10
21-Oct-10
22-Oct-10
25-Oct-10
26-Oct-10
K
LTN Jan-13
Moving Average - 5 Days
Moving Average - 30 Days
5. Source: National Treasury and CM Capital Markets
CM Capital Markets CCTVM Ltda. - Gomes de Carvalho Street, 1195 - 4th floor, 04547-004 São Paulo, SP - Brazil - CNPJ 02.685.483/0001-30.
Tel.: +55 11 3842-1122
Fax: +55 11 3044-3547
Pedro Faria
Carlos Braile
Luciano Rostagno
Source: BCB and CM Capital Markets
Daniela Rebollo
Economic Research Depart.:
Disclaimer
This publication is intended for informational purposes only and the opinions set forth herein should not be viewed as an offer or solicitation to buy, sell or
otherwise trade futures, options or securities. All opinions and information contained in this document constitute CM Capital Markets (“CM”) judgment as of
the date of this document and are subject to change without notice. CM Capital Markets and their respective directors and employees may effect or have
effected a transaction for their own account in the investments referred to in the material contained herein before or after the material is published to any
customer of a Group Company or may give advice to customers which may differ from or be inconsistent with the information and opinions contained herein.
While the information contained herein was obtained from sources believed to be reliable, no Group Company accepts any liability whatsoever for any loss
arising from any inaccuracy herein or from any use of this document or its contents. This document may not be reproduced, distributed or published in
electronic, paper or other form for any purpose without the prior written consent of CM. This report has been prepared without regard to the specific
investment objectives, financial situation and needs of any particular recipient. For the customers of CM Capital Markets this report is produced exclusively
for our business and expert clients, it is not for general distribution and our services are not available to private clients. Past performance is not indicative of
future results.
The risk of loss associated with futures and options trading can be substantial.
This message (including any attachments) is confidential and may be privileged. If you have received it by mistake please notify the sender by return e-mail
and delete this message from your system. Any unauthorized use or dissemination of this message in whole or in part is strictly prohibited. Please note that e-
mails are susceptible to change. CM Capital Markets (including its group companies) shall not be liable for the improper or incomplete transmission of the
information contained in this communication nor for any delay in its receipt or damage to your system. CM Capital Markets (or its group companies) does not
guarantee that the integrity of this communication has been maintained nor that this communication is free of viruses, interceptions or interference.
Brazilian Bond - Daily Overview
Brazilian Bond - Traded Volume
0
2.000
4.000
6.000
8.000
10.000
12.000
14.000
14-Sep-10
15-Sep-10
16-Sep-10
17-Sep-10
20-Sep-10
21-Sep-10
22-Sep-10
23-Sep-10
24-Sep-10
27-Sep-10
28-Sep-10
29-Sep-10
30-Sep-10
1-Oct-10
4-Oct-10
5-Oct-10
6-Oct-10
7-Oct-10
8-Oct-10
11-Oct-10
13-Oct-10
14-Oct-10
15-Oct-10
18-Oct-10
19-Oct-10
20-Oct-10
21-Oct-10
22-Oct-10
25-Oct-10
26-Oct-10
K
LTN
NTN-F
NTN-B
Total - 5 Days Moving Average
Total - 30 Days Moving Average
Date Settlement Type Notes Maturities
LTN 10/01/2011 ; 01/01/2013
NTN-F 01/01/2015 ; 01/01/2017 ; 01/01/2021
10/05/2010 10/06/2010 Traditional Auction NTN-B 05/15/2013 ; 05/15/2015 ; 08/15/2020
LTN 04/01/2011 ; 01/01/2013
LFT 03/07/2015 ; 03/07/2017
NTN-F 01/01/2015 ; 01/01/2017 ; 01/01/2021
LTN 10/01/2011 ; 01/01/2013
NTN-F 01/01/2015 ; 01/01/2017 ; 01/01/2021
05/15/2013 ; 05/15/2015 ; 08/15/2020
08/15/2030 ; 08/15/2040 ; 08/15/2050
08/15/2030 ; 05/15/2035 ; 08/15/2040
05/15/2045 ; 08/15/2050
05/15/2013 ; 05/15/2015 ; 08/15/2020
08/15/2030 ; 08/15/2040 ; 08/15/2050
LTN 04/01/2011 ; 01/01/2013
LFT 03/07/2015 ; 03/07/2017
NTN-F 01/01/2015 ; 01/01/2017 ; 01/01/2021
Early Redemption NTN-F 01/01/2017 ; 01/01/2021
LTN 10/01/2011 ; 01/01/2013
NTN-F 01/01/2015 ; 01/01/2017 ; 01/01/2021
TREASURY CALENDAR - OCTOBER
Traditional Auction09/30/2010 10/01/2010
NTN-BExchange Auction
10/19/2010 10/20/2010
NTN-BTraditional Auction
10/21/201010/20/2010
NTN-BEarly Redemption
Traditional Auction10/15/201010/14/2010
Traditional Auction10/08/201010/07/2010
10/29/2010 Traditional Auction10/28/2010
Traditional Auction
10/21/2010 10/22/2010