Visual controls &_management_preview
•
10 likes•6,258 views

This document discusses visual management and its importance in operational excellence. It defines visual management as using visual displays, metrics, and controls to communicate information instead of using text. The objectives of visual management are outlined, including supporting safety culture, continuous improvement, and making standards visible. Common visual tools like Andon boards, error-proofing, standard work charts, and OEE boards are described. The document also categorizes visual management into visual displays, metrics, and controls and provides examples of each. Finally, it emphasizes that visual management should align with overall lean management systems to establish continuous flow and reinforce standards.

Recommended
More Related Content
What's hot
What's hot (20)
Viewers also liked
Viewers also liked (20)
Similar to Visual controls &_management_preview
Similar to Visual controls &_management_preview (20)
Recently uploaded
Recently uploaded (10)
Visual controls &_management_preview
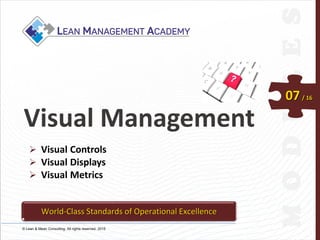
- 1. © Lean & Mean Consulting. All rights reserved. 2015 07/ 16 Visual Management Visual Controls Visual Displays Visual Metrics World-Class Standards of Operational Excellence
- 2. 2 Learning Objectives 1. Appreciate how Visual Management supports the Zero Injury Safety Culture 2. Understand that Visual Management is an integral part of the Continuous Improvement transformation 3. Become familiar with common visual tools such as Andon, Red Tagging, MOS boards, Kanban, error-proofing, standard work, OEE boards, etc. 4. Gain knowledge on how to apply visual tools to add structure and stability to operations, reducing variation and increasing efficiency
- 3. 3 Introduction 5S - The foundation for a visual workplace Types of visual management Visual display Visual metrics Visual control Contents Common visual tools Activity Boards MOS, OEE, Hourly attainment Standard work Kanban
- 4. 1 Visual Controls / Visual Metrics / Visual Displays Module. 07
- 5. 5 What is Visual Management Visual Management enhances the smooth flow of information by using visual and audio signals instead of texts or other written instructions Visual Management is the concept of making a workplace safe and more effective by making the current condition of a workplace obvious at a glance Visual Management includes a set of techniques that makes operation standards visible so that people can follow them more easily These techniques expose waste so that it can be prevented and eliminated
- 6. 6 The name given to a whole range of activities for communicating and controlling what needs to be done. What is this? Fundamentals of Gemba House Visual Management Visual Management
- 7. 7 Fundamentals of Gemba House Visual Management Visual Management allows us to: • See abnormal conditions as soon as they occur. • Tell at a glance how we are doing.
- 8. 8 • Safety & Health Information • Identification of people, places and objects • Procedures and methods of work • Quality standards, instructions, results • Status visibility • Problem visibility • Scheduling • Communication Types of Visual Management
- 10. 10 5 Disciplines for a Successful Visual Management System Disciplines Description Project identification • Define implementation areas and establish current conditions and baselines Workplace organization • Implement 6S as a strong foundation Visual display • Create a visual communication system providing the right information in the right format at the point of need Visual metrics • Quantify the path to targets for success Visual control • Create an error-proofed environment to promote easy adherence to standards
- 11. 11 5S workplace organization can be enhanced by the use of visual tools Visual tools help you to monitor results and look for things easily and quickly Creating a Visual Workplace Note: Visual management IS NOT decoration !
- 12. 12 3 Types of Visual Management • Label to make it perfectly clear where things belong and what the procedures are • Shadow boards, boundary samples Visual Display • Quantify the path to targets for success • OEE Boards, MOS Boards, Attainment Boards Visual Metrics • Create an error-proofed environment to promote easy adherence to standards • Poke Yoke, Red Rabbits Visual Controls
- 13. 13 Visual Displays Make it clear when something is out of place or missing Labeling is mandatory to make it obvious where things belong Labels are for everyone: those working in the area, those that are new to the area, and those that might need to know things about the area.
- 14. 14 Examples of Visual Display Floor markings Bin labels for different components Scheduling Labels to identify documentation locations Temporary work station or activity
- 15. 15 Andon refers to any visual display that shows status information Andon is the Japanese word for paper lantern Serves as warning system to signal and identify problems in the process What is an Andon?
- 16. 16 Andon Examples 4 Function andon system Warning sensors linked to andon and/or audio device Andon escalation process
- 17. 17 Visual Metrics Allow everyone to “know the score” and they make out-of- standard situations immediately obvious Enables everyone to ‘see’ how we’re performing Helps highlight problems, or variances from standard Encourages employee involvement and open discussions Facilitates the communication and identification of areas that need improvement
- 18. 18 • Gaps? Trends?What is happening? • Root causes?Why? • Correct the problem – implement containment action? • Prevent the problem – permanent corrective action? What needs to be done? • Who does what? • Any support needed? Who is going to do it? • Prioritization? • Deadline? • Milestones? When is it going to be done? Example of Visual Metrics Manufacturing Operating System (MOS) Visual Metrics provide a mechanism to take action…
- 19. 19 Create an error-proofed environment Promote easy adherence to standards Display goals and targets Are simple devices or visual standards to help prevent mistakes Make it easy to find things Visual Controls
- 20. 20 Examples of Visual Control E-stopLabeling of disposal bins Requirements Lock out procedure Stop before proceeding Shadow Board
- 21. 21 Error-proofing refers to techniques that make it impossible to make mistakes Also known as Poka Yoke Error-proofing helps people and processes work right the first time Error-proofing
- 22. 22 Error-Proofing Has Dual Focus DefectsMistakesProcess Prevention Poka-Yoke that focuses here works on mistake prevention or making mistakes impossible. Detection Poka-Yoke that focuses here works on mistake detection, or making sure mistakes do not turn into defects. People and systems do make mistakes. A portion of mistakes turn into defects.
- 23. Visual Controls / Visual Metrics / Visual Displays Module. 07
- 24. 24 What is an Activity Board? Activity board is a visual tool to guide teams to action It is a visual scorecard for the team’s progress toward company, departmental and team visions and targets It keeps everyone’s attention on the project, using colors and graphs to make information clear to everyone who sees it Is a focal point for team meetings, and a place for management’s feedback and encouragement Key TPM Tools
- 25. 25 MOS Board OEE Board Post the applicable schedule at each activity board so it is clear: • when the meetings occur • who needs to be present • what information will be reviewed Examples of Activity Boards
- 26. 26 Example of Hourly Attainment Board HOURLY ATTAINMENT BOARD Line X
- 27. 27 Visual management is an essential part of a Lean management system Visual management uses displays, metrics and controls to help establish and maintain continuous flow Visual tools reinforce standards, and help people detect abnormalities at a glance For visual management be effective and sustainable, it has to be integrated and align with management standard work - MOS, OEE, BP – the way we manage the business Summary
- 28. 28© Lean & Mean Consulting. All rights reserved. 2016