Technical and Economic Performance of 1MW Grid-connected PV system in Saudi A...
PV solar system with battery storage - design
1. Jaroslaw Iskierski – Foundation Degree in Science
Electrical Engineering and Renewable Energy
Plymouth University
1
PV system with battery storage – design
A customer requires a design proposal for a grid tied PV system with battery storage. It is anticipated
that the daily load requirement is between 1000-2000 average watt hours. The system is located in
Liskard, Cornwall. The costumers want this roof mounted PV system in order to reduce their
electricity bills. The two bedroom house is occupied by two persons. There is a gas boiler for central
heating as well as gas hob and gas oven.
Step One: Assessment of energy demand.
The costumers provided electricity bills from last two years with average usage of 1,400 kWh per
year which is 3,836 Wh/day. As the costumers want to obtain most of the energy from PV system
with battery storage this energy usage is too big. In order to find out in details what is the energy
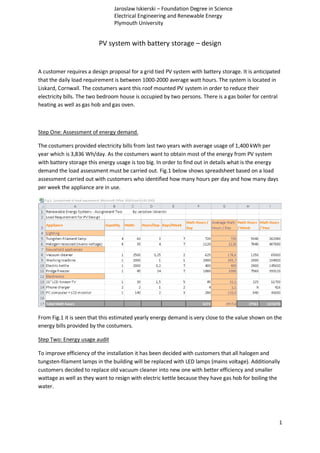
demand the load assessment must be carried out. Fig.1 below shows spreadsheet based on a load
assessment carried out with customers who identified how many hours per day and how many days
per week the appliance are in use.
From Fig.1 it is seen that this estimated yearly energy demand is very close to the value shown on the
energy bills provided by the costumers.
Step Two: Energy usage audit
To improve efficiency of the installation it has been decided with customers that all halogen and
tungsten-filament lamps in the building will be replaced with LED lamps (mains voltage). Additionally
customers decided to replace old vacuum cleaner into new one with better efficiency and smaller
wattage as well as they want to resign with electric kettle because they have gas hob for boiling the
water.
2. Jaroslaw Iskierski – Foundation Degree in Science
Electrical Engineering and Renewable Energy
Plymouth University
2
Step Three: Estimated Average Yearly Energy Usage
Fig.2. above shows improved load requirement. It is seen that the early energy demand dropped
significantly from about 1,433 kWh to estimated 681 kWh which is more than half less. The
estimated daily energy demand is now 1870.7 Wh. After discussion with customers it has been
decided that the future load may increase by additional laptop, therefore the estimated average
energy usage is 2000 Wh/day over the year with about 130 Wh/day spare capacities.
Step Four: Determining the Size of the Array
In this stage the size of the array should be selected with regard to the environmental effects present
at the proposed installation side and with regard to PV equipment used for the installation. The most
important data is average daily insolation for each month. This can be found from various web sites
like NASA or PV GIS. The longitude and latitude of Liskeard are:
Latitude 50.455520 North ; Longitude -4.464719 West
Data obtained from web site: LatLong.Net (http://www.latlong.net/). Accessed 05.03.2015.
3. Jaroslaw Iskierski – Foundation Degree in Science
Electrical Engineering and Renewable Energy
Plymouth University
3
From fig.3. it is seen that in Liskeard in average, each day during the year receive 3.85 kWh/m2
for
roof orientation due South and slope angle 45o
(measured with level-angle-finder from the rafters on
the loft). However, orientation of this roof is 15o
West of the geographical South measured with
compass. Therefore, taking magnetic declination into account which is 2.37o
West in March 2015, the
azimuth angle of the roof relative to due South is:
15° − 2.37° = 12.63° 𝑆𝑊
Fig.3. Monthly Average Insolation. Source: PVGIS-CMSAF http://re.jrc.ec.europa.eu/pvgis/apps4/MRcalc.php Accessed 05.03.2015.
4. Jaroslaw Iskierski – Foundation Degree in Science
Electrical Engineering and Renewable Energy
Plymouth University
4
Fig.4. Effectiveness of PV at 52 degrees North Latitude - % of total achievable. Source: City College Plymouth; HE Moodle;
Renewable Energy Systems; PV systems; lecture 4a.
Fig.4. shows that the azimuth angle 12.63o
West relative to due South causes 2% drop of PV
effectiveness. Derating factor for tilt of the roof is already taken into account by PVGIS CMSAF (Fig.3).
Therefore, the average monthly insolation on a plane of this roof is:
3.850𝑘𝑊ℎ/𝑚2 − 2% = 𝟑. 𝟕𝟕𝟑𝒌𝑾𝒉/𝒎 𝟐
The modern inverters have efficiency of about 95%. Additionally losses due cable resistance can be
estimated at 4%. These losses must be taken into account during calculation of daily energy demand.
Therefore, the daily energy usage is:
𝑑𝑎𝑖𝑙𝑦 𝑢𝑠𝑎𝑔𝑒 ÷ 𝑖𝑛𝑣𝑒𝑟𝑡𝑒𝑟 𝑙𝑜𝑠𝑠𝑒𝑠 ÷ 𝑠𝑦𝑠𝑡𝑒𝑚 𝑙𝑜𝑠𝑠𝑒𝑠
2000𝑊ℎ ÷ 0.95 ÷ 0.96 = 𝟐𝟏𝟗𝟑𝑾𝒉
The customers require battery storage to be installed with the PV system, therefore, estimated
battery bank efficiency of 85% needs to be applied to daily energy usage:
2193𝑊ℎ ÷ 0.85% = 𝟐𝟓𝟐𝟏𝑾𝒉
The losses of modern MPPT battery charge controller are negligible. Therefore 2521Wh is required
from the PV array per day.
To meet the requirement the PV array must have a peak power of:
𝑎𝑑𝑗𝑢𝑠𝑡𝑒𝑑 𝑑𝑎𝑖𝑙𝑦 𝑢𝑠𝑎𝑔𝑒 ÷ 𝑎𝑣𝑒𝑟𝑎𝑔𝑒 𝑑𝑎𝑖𝑙𝑦 𝑠𝑜𝑙𝑎𝑟 𝑟𝑎𝑑𝑖𝑎𝑡𝑖𝑜𝑛
2521𝑊ℎ ÷ 3.773𝑘𝑊ℎ/𝑚2
= 𝟔𝟔𝟖𝑾 𝒑
5. Jaroslaw Iskierski – Foundation Degree in Science
Electrical Engineering and Renewable Energy
Plymouth University
5
For this project, polycrystalline modules Sharp ND230A5 will be used. The rated output of PV
modules must be de-rated by the following factors:
- Power output tolerance is ± 3% according to manufacture data
230𝑊 × 0.97 = 𝟐𝟐𝟑. 𝟏𝑾
- Effects of dirt on the modules in this example is assumed at 5%
223.1𝑊 × 0.95 = 𝟐𝟏𝟏. 𝟗𝑾
- Temperature coefficient of power output is -0.44%/o
C according to manufacture data
The average daily temperature in Liskeard is 11.9o
C according to data from Fig.3.
The average daily cell temperature is:
11.7℃ + 25℃ = 36.9℃
The effective de-rating factor due to temperature, in ℃ for Liskeard is calculated from
formula:
1 − (36.9 − 25) × (−0.44%/℃) =
1 − 5.236% = 1 − 0.05236 = 0.9415
Thus the de-rated power output of the module is:
211.9𝑊 × 0.9415 = 𝟏𝟗𝟗. 𝟓𝑾
Minimum array size
𝑇ℎ𝑒 𝑛𝑢𝑚𝑏𝑒𝑟 𝑜𝑓 𝑚𝑜𝑑𝑢𝑙𝑒𝑠 𝑟𝑒𝑞𝑢𝑖𝑟𝑒𝑑 𝑖𝑛 𝑡ℎ𝑒 𝑎𝑟𝑟𝑎𝑦 =
= 𝑝𝑒𝑎𝑘 𝑝𝑜𝑤𝑒𝑟 𝑟𝑒𝑞𝑢𝑖𝑟𝑒𝑑 𝑏𝑦 𝑡ℎ𝑒 𝑎𝑟𝑟𝑎𝑦 𝑎𝑑𝑗𝑢𝑠𝑡𝑒𝑑 𝑜𝑢𝑡𝑝𝑢𝑡 𝑜𝑓 𝑡ℎ𝑒 𝑃𝑉 𝑚𝑜𝑑𝑢𝑙𝑒
668𝑊 ÷ 199.5𝑊 = 3.35 ≈ 4 𝑚𝑜𝑑𝑢𝑙𝑒𝑠
The array will provide power output of 4 × 230𝑊𝑝 = 920𝑊𝑝
Step Five: Calculating capacity of required battery bank
For this project a “deep discharge” 48V lead-acid battery is used. The DC side of the system has 48V.
1) DC load required by the system:
𝐷𝐶 𝑙𝑜𝑎𝑑 =
𝐴𝐶 𝑙𝑜𝑎𝑑
𝐼𝑛𝑣𝑒𝑟𝑡𝑒𝑟 𝑒𝑓𝑓𝑖𝑐𝑖𝑒𝑛𝑐𝑦
=
=
2000𝑊ℎ/𝑑𝑎𝑦
0.95
= 𝟐𝟏𝟎𝟓. 𝟑𝑾𝒉/𝒅𝒂𝒚
6. Jaroslaw Iskierski – Foundation Degree in Science
Electrical Engineering and Renewable Energy
Plymouth University
6
2) DC load in Ah (amp-hours):
𝐷𝐶 𝑙𝑜𝑎𝑑𝐴ℎ =
𝐷𝐶 𝑙𝑜𝑎𝑑
𝑠𝑦𝑠𝑡𝑒𝑚 𝑣𝑜𝑙𝑡𝑎𝑔𝑒
=
=
2105.3𝑊ℎ/𝑑𝑎𝑦
48𝑉
= 𝟒𝟑. 𝟖𝟔𝑨𝒉
3) As this system is grid connected the load is non-critical. It is explained with customers that
during the winter months the usage of energy is bigger and the energy generation from PV
array is smaller. The battery system is intended only to lower the consumption of energy
from national grid. Therefore it is agreed with costumers that during winter month they still
will need to buy electricity from grid. Installation of battery bank for critical load would cost
much more and would be greatly oversized during summer months. Additionally big battery
bank requires bigger PV array, this in turn requires bigger roof space. There is a risk that PV
array won’t be able to charge up bigger battery bank during winter months and it is known
that batteries operated in deep state of discharge can quickly be damaged. This particular
battery system has to provide additional energy for bigger load during the day and enough
energy to power some lights, TV and computer in the evening. Therefore this battery system
has only one day of storage.
4) Usable storage with respect to days of storage: as there is only one day of storage the usable
storage is the same as DC load in Ah which is 43.86Ah.
𝑈𝑠𝑎𝑏𝑙𝑒 𝑠𝑡𝑜𝑟𝑎𝑔𝑒 𝑑𝑎𝑦𝑠 𝑜𝑓 𝑠𝑡𝑜𝑟𝑎𝑔𝑒 = 𝐷𝐶 𝑙𝑜𝑎𝑑 (𝐴ℎ) × 𝑑𝑎𝑦𝑠𝑜𝑓 𝑠𝑡𝑜𝑟𝑎𝑔𝑒
𝑈𝑠𝑎𝑏𝑙𝑒 𝑠𝑡𝑜𝑟𝑎𝑔𝑒 𝑑𝑎𝑦𝑠 𝑜𝑓 𝑠𝑡𝑜𝑟𝑎𝑔𝑒 = 43.86𝐴ℎ × 1 = 𝟒𝟑. 𝟖𝟔𝑨𝒉/𝒅𝒂𝒚
5) Usable storage with respect to maximum deep of discharge: The maximum DoD of the
battery is set on 50% of rated capacity(to increase lifespan of the battery), thus:
𝑈𝑠𝑎𝑏𝑙𝑒 𝑠𝑡𝑜𝑟𝑎𝑔𝑒 𝑀𝑎𝑥𝑖𝑚𝑢𝑚 𝐷𝑜𝐷 =
𝑈𝑠𝑎𝑏𝑙𝑒 𝑠𝑡𝑜𝑟𝑎𝑔𝑒 𝑑𝑎𝑦𝑠 𝑜𝑓 𝑠𝑡𝑜𝑟𝑎𝑔𝑒
𝑀𝑎𝑥𝑖𝑚𝑢𝑚 𝐷𝑒𝑒𝑝 𝑜𝑓 𝐷𝑖𝑠𝑐ℎ𝑎𝑟𝑔𝑒
𝑈𝑠𝑎𝑏𝑙𝑒 𝑠𝑡𝑜𝑟𝑎𝑔𝑒 𝑀𝑎𝑥𝑖𝑚𝑢𝑚 𝐷𝑜𝐷 =
43.86𝐴ℎ/𝑑𝑎𝑦
50%
= 𝟖𝟕. 𝟕𝟐𝑨𝒉/𝒅𝒂𝒚
6) Usable storage with respect to minimum temperature of the batteries: As the operating
temperature of the battery decreases the actual capacity of the battery decreases as well.
The lowest possible temperature of the battery in this project during the winter months will
be 10o
C. This battery is C/20 rated for25o
C. The actual capacity of the battery with respect to
the temperature can be checked with the aim of the Fig.5.
7. Jaroslaw Iskierski – Foundation Degree in Science
Electrical Engineering and Renewable Energy
Plymouth University
7
Fig.5. Actual capacity of the battery with respect to minimum temperature and different rates of discharge. Source: City
College Plymouth; HE Moodle; Renewable Energy Principles; Solar Power Systems; lecture 8 – Battery system design for
renewables.
From Fig.5. it is seen that the actual capacity of this type of battery is about 92% of rated
capacity for 10o
C of battery.
𝑈𝑠𝑎𝑏𝑙𝑒 𝑠𝑡𝑜𝑟𝑎𝑔𝑒 𝑚𝑖𝑛𝑖𝑚𝑢𝑚 𝑡𝑒𝑚𝑝𝑒𝑟𝑎𝑡𝑢𝑟𝑒 =
𝑈𝑠𝑎𝑏𝑙𝑒 𝑠𝑡𝑜𝑟𝑎𝑔𝑒 𝑀𝑎𝑥𝑖𝑚𝑢𝑚 𝐷𝑜𝐷
92%
𝑈𝑠𝑎𝑏𝑙𝑒 𝑠𝑡𝑜𝑟𝑎𝑔𝑒 𝑚𝑖𝑛𝑖𝑚𝑢𝑚 𝑡𝑒𝑚𝑝𝑒𝑟𝑎𝑡𝑢𝑟𝑒 =
87.72𝐴ℎ/𝑑𝑎𝑦
0.92
= 𝟗𝟓. 𝟑𝟓𝑨𝒉/𝒅𝒂𝒚
7) Usable storage with respect to discharge rate of the battery: Discharge rate depends on
discharge current drown by the load. The discharge rate will be variable and will be
dependent on power demand in a particular moment.
Rated capacity of this battery has discharge rating C/20. However, as the battery bank is
intended to provide energy for evening hours it is assumed that discharge rating is C/10.
Fig.5. shows that for C/10 the actual capacity of the battery is 90% of the rated capacity. This
is because bigger current flows through internal battery resistance and it causes bigger losses
(I2
xR). Therefore, final requirement for battery bank capacity has to be increased again:
𝑅𝑒𝑞𝑢𝑖𝑟𝑒𝑑 𝐵𝑎𝑡𝑡𝑒𝑟𝑦 𝐵𝑎𝑛𝑘 𝐶𝑎𝑝𝑎𝑐𝑖𝑡𝑦 =
𝑈𝑠𝑎𝑏𝑙𝑒 𝑠𝑡𝑜𝑟𝑎𝑔𝑒 𝑛𝑖𝑚𝑢𝑚 𝑡𝑒𝑚𝑝𝑒𝑟𝑎𝑡𝑢𝑟𝑒
90%
𝑹𝒆𝒒𝒖𝒊𝒓𝒆𝒅 𝑩𝒂𝒕𝒕𝒆𝒓𝒚 𝑩𝒂𝒏𝒌 𝑪𝒂𝒑𝒂𝒄𝒊𝒕𝒚 =
𝟗𝟓. 𝟑𝟓𝑨𝒉/𝒅𝒂𝒚
𝟎. 𝟗
= 𝟏𝟎𝟓. 𝟗𝟒𝑨𝒉/𝒅𝒂𝒚
For this particular project a 48V deep cycle 110Ah battery will be used. For C/10 drawing
current is:
8. Jaroslaw Iskierski – Foundation Degree in Science
Electrical Engineering and Renewable Energy
Plymouth University
8
𝐷𝑖𝑠𝑐ℎ𝑎𝑟𝑔𝑒 𝑐𝑢𝑟𝑟𝑒𝑛𝑡 =
110𝐴ℎ
10ℎ
= 𝟏𝟏𝑨
8) Maximum discharge current: for short period of time during the day this system will draw
bigger current (for example washing machine or vacuum cleaner).
The total instantaneous load is taken from Fig.2. column C. The maximum current required
by the AC load is:
𝑀𝑎𝑥𝑖𝑚𝑢𝑚 𝑐𝑢𝑟𝑟𝑒𝑛𝑡 =
𝑡𝑜𝑡𝑎𝑙 𝑙𝑜𝑎𝑑(𝑊)
𝑚𝑎𝑖𝑛𝑠 𝑣𝑜𝑙𝑡𝑎𝑔𝑒(𝑉)
𝑀𝑎𝑥𝑖𝑚𝑢𝑚 𝑐𝑢𝑟𝑟𝑒𝑛𝑡 =
4183𝑊
230𝑉
= 𝟏𝟖. 𝟏𝟗𝑨
It is unlikely that all appliances will be switched on at the same time. To obtain more realistic
value of current demand the allowances for diversity can be applied. In this installation it will
be: (according to Table 1B ; appendix 1 of On-Site Guide BS 7671:2008)
- for lighting circuit 66% of total current demand
- for socket outlets 100% of current demand of largest point of utilisation + 40% of current
demand of every other point of utilisation
Taking values from Fig.2. column C for this installation
- lighting circuit 42.24W
- socket outlets 2847.6W
Total 42.24W+2847.6W=2889.84W
Thus, current drown by load, taking into account allowances for diversity is:
𝐶𝑢𝑟𝑟𝑒𝑛𝑡 𝑎𝑙𝑙𝑜𝑤𝑎𝑛𝑐𝑒𝑠 𝑓𝑜𝑟 𝑑𝑖𝑣𝑒𝑟𝑠𝑖𝑡𝑦 =
2889.84𝑊
230𝑉
= 𝟏𝟐. 𝟓𝟔𝑨
This is still bigger than discharge current for C/10 but it is assumed that bigger currents will
be drown by the system mainly during midday hours when battery is supported by PV array.
9. Jaroslaw Iskierski – Foundation Degree in Science
Electrical Engineering and Renewable Energy
Plymouth University
9
Step Six: Array configuration
It is important to correctly arrange the series, parallel or combined connection of the modules. The
number of modules connected in series will affect the output voltage of the array and the number of
modules connected in parallel will affect the output current of the array. System and battery voltage
is 48V; the module voltage is 30.3V therefore two series of two modules each will be connected in
parallel. This will give 60.6V output of array. The inverter integrated charge controller will control the
input battery voltage.
Step Seven: Inverter selection
Customers require grid tie PV system with additional battery bank. Traditional grid tie inverter
cannot be used for the following reasons:
- it switches off when grid is switched off; therefore energy stored in battery bank cannot be
used anyway
- it operate in much bigger range of voltage than battery voltage and much smaller rage of
current than battery current
- it doesn’t comprise build in charge controller (deep of discharge and charging and
discharging voltage and current) which can very quickly damage the battery
Because of this special inverter designed for this purpose will be installed “Battery Backup Inverter”.
They manage the energy charge it gets from the battery through on-board charger and brings the
surplus energy to domestic installation or utility grid. These battery backup inverters are able to
supply alternating current power to selected areas which require energy during a power outage. This
type, however, still comprise an anti-islandic protection. One of the existing on the market models of
these inverters is Outback Power, this one has “grid-assist mode” which gives the choice to connect
or disconnect from the grid.
For inverters rated at their output power as a result of earlier applied de-rating factors for PV
modules, cables and batteries it is accepted that chosen inverter has output rating of 80% of the
peak power of the array.
𝑃𝑒𝑎𝑘 𝑝𝑜𝑤𝑒𝑟 𝑜𝑓 𝑡ℎ𝑒 𝑎𝑟𝑟𝑎𝑦 = 𝑛𝑢𝑚𝑏𝑒𝑟 𝑜𝑓 𝑚𝑜𝑑𝑢𝑙𝑒𝑠 × 𝑟𝑎𝑡𝑒𝑑 𝑝𝑒𝑎𝑘 𝑝𝑜𝑤𝑒𝑟 𝑜𝑓 𝑒𝑎𝑐ℎ 𝑚𝑜𝑑𝑢𝑙𝑒
𝑃𝑜𝑤𝑒𝑟 𝑝𝑒𝑎𝑘 𝑜𝑓 𝑡ℎ𝑒 𝑎𝑟𝑟𝑎𝑦 = 4 × 230𝑊𝑝 = 920𝑊𝑝
Thus:
𝐼𝑛𝑣𝑒𝑟𝑡𝑒𝑟 𝑜𝑢𝑡𝑝𝑢𝑡 𝑟𝑎𝑡𝑖𝑛𝑔 = 𝑃𝑜𝑤𝑒𝑟 𝑝𝑒𝑎𝑘 𝑜𝑓 𝑡ℎ𝑒 𝑎𝑟𝑟𝑎𝑦 × 80%
𝐼𝑛𝑣𝑒𝑟𝑡𝑒𝑟 𝑜𝑢𝑡𝑝𝑢𝑡 𝑟𝑎𝑡𝑖𝑛𝑔 = 920𝑊𝑝 × 0.8 = 𝟕𝟑𝟔𝑾
10. Jaroslaw Iskierski – Foundation Degree in Science
Electrical Engineering and Renewable Energy
Plymouth University
10
Each inverter has specified: maximum input voltage, maximum input current and operating voltage
range in which Maximum Power Point of the array is tracked by inverter. In the case of “Battery
Backup Inverter“ above apply actually to charge controller which is part of the inverter.
- Maximum input current:
𝑚𝑎𝑥𝑖𝑚𝑢𝑚 𝑖𝑛𝑣𝑒𝑟𝑡𝑒𝑟(𝑐ℎ𝑎𝑟𝑔𝑒 𝑐𝑜𝑛𝑡𝑟𝑜𝑙𝑙𝑒𝑟) 𝑖𝑛𝑝𝑢𝑡 𝑐𝑢𝑟𝑟𝑒𝑛𝑡
= 𝑠ℎ𝑜𝑟𝑡 − 𝑐𝑖𝑟𝑐𝑢𝑖𝑡 𝑐𝑢𝑟𝑟𝑒𝑛𝑡 𝑜𝑓 𝑚𝑜𝑑𝑢𝑙𝑒 𝑆𝑇𝐶
× 𝑛𝑢𝑚𝑏𝑒𝑟 𝑜𝑓 𝑝𝑎𝑟𝑎𝑙𝑙𝑒𝑙 𝑐𝑜𝑛𝑛𝑒𝑐𝑡𝑒𝑑 𝑠𝑡𝑟𝑖𝑛𝑔𝑠
𝑚𝑎𝑥𝑖𝑚𝑢𝑚 𝑖𝑛𝑣𝑒𝑟𝑡𝑒𝑟(𝑐ℎ𝑎𝑟𝑔𝑒 𝑐𝑜𝑛𝑡𝑟𝑜𝑙𝑙𝑒𝑟) 𝑖𝑛𝑝𝑢𝑡 𝑐𝑢𝑟𝑟𝑒𝑛𝑡 = 8.41𝐴 × 2 = 𝟏𝟔. 𝟖𝟐𝑨
As the module current increases with increasing temperature the temperature coefficient for
current must be applied to the above value. The maximum expected temperature of the
module during the year is 80℃ and the temperature coefficient of module current is
+0.038%/℃. Thus:
𝐼𝑠𝑐(𝑎𝑡 + 80℃) = 16.82𝐴 + (55℃ × (16.82𝐴 × 0.038%)) = 𝟏𝟕. 𝟏𝟐𝑨
- Maximum input voltage:
𝑚𝑎𝑥𝑖𝑚𝑢𝑚 𝑖𝑛𝑣𝑒𝑟𝑡𝑒𝑟(𝑐ℎ𝑎𝑟𝑔𝑒 𝑐𝑜𝑛𝑡𝑟𝑜𝑙𝑙𝑒𝑟) 𝑖𝑛𝑝𝑢𝑡 𝑣𝑜𝑙𝑡𝑎𝑔𝑒
= 𝑜𝑝𝑒𝑛 − 𝑐𝑖𝑟𝑐𝑢𝑖𝑡 𝑣𝑜𝑙𝑡𝑎𝑔𝑒 𝑜𝑓 𝑚𝑜𝑑𝑢𝑙𝑒 𝑆𝑇𝐶
× 𝑛𝑢𝑚𝑏𝑒𝑟 𝑜𝑓 𝑚𝑜𝑑𝑢𝑙𝑒𝑠 𝑐𝑜𝑛𝑛𝑒𝑐𝑡𝑒𝑑 𝑖𝑛 𝑠𝑒𝑟𝑖𝑒𝑠
𝑚𝑎𝑥𝑖𝑚𝑢𝑚 𝑖𝑛𝑣𝑒𝑟𝑡𝑒𝑟(𝑐ℎ𝑎𝑟𝑔𝑒 𝑐𝑜𝑛𝑡𝑟𝑜𝑙𝑙𝑒𝑟) 𝑖𝑛𝑝𝑢𝑡 𝑣𝑜𝑙𝑡𝑎𝑔𝑒 = 36.4𝑉 × 2 = 𝟕𝟐. 𝟖𝑽
As the module voltage increases with decreasing temperature the temperature coefficient
for voltage must be applied to the above value. The minimum expected temperature of the
module during the year is -15℃ and the temperature coefficient of module voltage is -
0.328%/℃. Thus:
𝑉𝑜 𝑐(𝑎𝑡 − 15℃) = 72.8𝑉 + (40℃ × (72.8𝑉 × 0.328%)) = 𝟖𝟐. 𝟑𝟓𝑽
- Operating voltage range (MPPT):
𝑉 𝑀𝑃𝑃(𝑎𝑡 − 15℃) = 60.6𝑉 + (40℃ × (72.8𝑉 × 0.328%)) = 70.2𝑉
𝑉 𝑀𝑃𝑃(𝑎𝑡 + 80℃) = 60.6𝑉 − (55℃ × (72.8𝑉 × 0.328%)) = 47.47𝑉
Therefore, chosen inverter (charge controller) must have:
- Maximum input current bigger than 17.12A
- Maximum input voltage bigger than 82.35V
- Operating voltage range(MPPT) lower than 47.47V and bigger than 70.2V
11. Jaroslaw Iskierski – Foundation Degree in Science
Electrical Engineering and Renewable Energy
Plymouth University
11
1. Using approximately the same design criteria as above, design a similar system using
‘SolarSizer Xcel Ver 1.9’ taking into account any variations that may occur.
Fig.6. Assessment of energy demand. Source City College Plymouth HE Moodle.
12. Jaroslaw Iskierski – Foundation Degree in Science
Electrical Engineering and Renewable Energy
Plymouth University
12
Fig.7. PV system design with aid of SolarSizer. Source City College Plymouth HE Moodle.
13. Jaroslaw Iskierski – Foundation Degree in Science
Electrical Engineering and Renewable Energy
Plymouth University
13
2. Produce design procedure (including all formula)to take into account any further variables
that may occur, for example:
NOCT
Extreme cold conditions
Cable losses
Shading
Tilt (use tilt de-rating chart in notes)
PV system design procedure
Before any design procedure began you have to establish together with the customer what is the
main purpose of this installation and what they expect.
a) System to reduce energy bills with small battery bank just for one night.
b) System to help environment by generating renewable energy and feeding it to national grid;
grid tied inverter with no battery backup, preferably whole the available roof space covered
by PV modules.
c) System to provide energy for customer installation(load) during “black out”; battery backup
with much bigger capacity and much bigger PV array than in point a); inverter not necessary
grid tied.
Grid tied PV system with battery bank
This exercise shows a design procedure for PV system to reduce energy bills. It is in-depth step by
step design procedure with minimum description.
1. Determine the existing energy demand:
- Obtain from customer or DNO recent annually energy bills
- Perform load assessment together with customer (appliance, wattage, time of daily usage,
days per week) use available spreadsheets or create own
2. Establish and recommend to customer any possibility to improve energy efficiency of the
existing load.
3. Use spreadsheet again to determine improved energy demand of the system (daily average
energy demand in Wh) take into account future expansion of the load if necessary.
4. Determine latitude and longitude of the site (various websites; for example
http://www.latlong.net/.
14. Jaroslaw Iskierski – Foundation Degree in Science
Electrical Engineering and Renewable Energy
Plymouth University
14
5. Determine the magnetic declination of the proposed site for the time of site visit (various
websites).
6. Measure the roof tilt and orientation. For roof tilt use level-angle-finder on a rafter on the
loft. For orientation of the roof use compass and take magnetic declination into account;
𝑚𝑒𝑎𝑠𝑢𝑟𝑒𝑑 𝑜𝑟𝑖𝑒𝑛𝑡𝑎𝑡𝑖𝑜𝑛 ± 𝑚𝑎𝑔𝑛𝑒𝑡𝑖𝑐 𝑜𝑟𝑖𝑒𝑛𝑡𝑎𝑡𝑖𝑜𝑛
= 𝑟𝑜𝑜𝑓 𝑜𝑟𝑖𝑒𝑛𝑡𝑎𝑡𝑖𝑜𝑛 𝑑𝑢𝑒 𝑡𝑜 𝑔𝑒𝑜𝑔𝑟𝑎𝑝ℎ𝑖𝑐𝑎𝑙 𝑆𝑜𝑢𝑡ℎ (𝑓𝑜𝑟 𝑛𝑜𝑟𝑡ℎ𝑒𝑟𝑛 ℎ𝑒𝑚𝑖𝑠𝑝ℎ𝑒𝑟𝑒)
7. Determine average yearly insolation in Peak Sun Hours (PSH) in kWh/m2
/day for the optimal
tilt (use PV GIS website).
8. Determine the adjusted average yearly insolation in Peak Sun Hours taking into account
orientation of the roof due Geographical South and tilt of the roof; use table with
effectiveness of PV array in % of total achievable for particular latitude.
9. Calculate demand of the PV array taking into account losses of the system;
𝑃𝑉 𝑎𝑟𝑟𝑎𝑦 𝑟𝑒𝑞𝑢𝑖𝑟𝑒𝑚𝑒𝑛𝑡 (𝑊ℎ 𝑑𝑎𝑦⁄ )
= 𝑖𝑚𝑝𝑟𝑜𝑣𝑒𝑑𝑒𝑛𝑒𝑟𝑔𝑦 𝑑𝑒𝑚𝑎𝑛𝑑 (𝑊ℎ 𝑑𝑎𝑦⁄ ) × 𝑖𝑛𝑣𝑒𝑟𝑡𝑒𝑟𝑒𝑓𝑓𝑖𝑐𝑖𝑒𝑛𝑐𝑦 (%)
× 𝑠𝑦𝑠𝑡𝑒𝑚 𝑒𝑓𝑓𝑖𝑐𝑖𝑒𝑛𝑐𝑦(%) × 𝑏𝑎𝑡𝑡𝑒𝑟𝑦 𝑏𝑎𝑛𝑘 𝑒𝑓𝑓𝑖𝑐𝑖𝑒𝑛𝑐𝑦(%)
10. Calculate the PV array peak power;
𝑃𝑉 𝑎𝑟𝑟𝑎𝑦 𝑝𝑒𝑎𝑘 𝑝𝑜𝑤𝑒𝑟(𝑊𝑝)
= 𝑃𝑉 𝑎𝑟𝑟𝑎𝑦 𝑟𝑒𝑞𝑢𝑖𝑟𝑒𝑚𝑒𝑛𝑡(𝑊ℎ 𝑑𝑎𝑦)⁄
÷ 𝑎𝑑𝑗𝑢𝑠𝑡𝑒𝑑 𝑎𝑣𝑒𝑟𝑎𝑔𝑒 𝑦𝑒𝑎𝑟𝑙𝑦 𝑖𝑛𝑠𝑜𝑙𝑎𝑡𝑖𝑜𝑛(𝑘𝑊ℎ/𝑚2 𝑑𝑎𝑦)⁄
11. Choose type of PV modules you use for this project and apply all de-rating factors to rated
output of this panels;
𝐷𝑒𝑟𝑎𝑡𝑒𝑑 𝑚𝑜𝑑𝑢𝑙𝑒 𝑜𝑢𝑡𝑝𝑢𝑡(𝑊)
= 𝑟𝑎𝑡𝑒𝑑 𝑝𝑜𝑤𝑒𝑟(𝑊𝑝) − 𝑝𝑜𝑤𝑒𝑟 𝑜𝑢𝑡𝑝𝑢𝑡 𝑡𝑜𝑙𝑒𝑟𝑎𝑛𝑐𝑒(%)
− 𝑒𝑓𝑓𝑒𝑐𝑡 𝑜𝑓 𝑑𝑖𝑟𝑡 𝑐𝑜𝑙𝑙𝑒𝑐𝑡𝑒𝑑 𝑜𝑛 𝑡ℎ𝑒 𝑚𝑜𝑑𝑢𝑙𝑒(% 𝑐𝑎𝑛 𝑏𝑒 𝑑𝑖𝑓𝑓𝑒𝑟𝑒𝑛𝑡 𝑓𝑜𝑟 𝑒𝑎𝑐ℎ 𝑙𝑜𝑐𝑎𝑡𝑖𝑜𝑛𝑠)
12. Find out average yearly daytime temperature for this location (Tamb) (Use PV GIS website).
13. Calculate average yearly daytime cell temperature (Tcell);
𝑇𝑎𝑚𝑏 + 25℃ = 𝑇𝑐𝑒𝑙𝑙
14. Calculate effective de-rating factor with respect to temperature (ftemp);
15. Jaroslaw Iskierski – Foundation Degree in Science
Electrical Engineering and Renewable Energy
Plymouth University
15
𝑓𝑡𝑒𝑚𝑝 = 1 − (𝑇𝑐𝑒𝑙𝑙 − 25℃) × (𝑡𝑒𝑚𝑝 𝑐𝑜𝑒𝑓𝑓𝑖𝑐𝑖𝑒𝑛𝑡 𝑜𝑓 𝑚𝑜𝑑𝑢𝑙𝑒𝑠)
15. Calculate de-rated power output of the module taking into account ftemp;
𝑑𝑒𝑟𝑎𝑡𝑒𝑑 𝑚𝑜𝑑𝑢𝑙𝑒 𝑝𝑜𝑤𝑒𝑟(𝑊) = 𝑚𝑜𝑑𝑢𝑙𝑒 𝑝𝑜𝑤𝑒𝑟 × 𝑓𝑡𝑒𝑚𝑝
16. Calculate minimum array size;
𝑛𝑢𝑚𝑏𝑒𝑟 𝑜𝑓 𝑚𝑜𝑑𝑢𝑙𝑒𝑠 𝑟𝑒𝑞𝑢𝑖𝑟𝑒𝑑
= 𝑝𝑒𝑎𝑘 𝑝𝑜𝑤𝑒𝑟 𝑟𝑒𝑞𝑢𝑖𝑟𝑒𝑑 𝑓𝑟𝑜𝑚 𝑎𝑟𝑟𝑎𝑦(𝑊𝑝) ÷ 𝑑𝑒𝑟𝑎𝑡𝑒𝑑 𝑚𝑜𝑑𝑢𝑙𝑒 𝑝𝑜𝑤𝑒𝑟(𝑊)
17. Calculate total peak power output of the array;
𝑡𝑜𝑡𝑎𝑙 𝑝𝑒𝑎𝑘 𝑝𝑜𝑤𝑒𝑟 𝑜𝑢𝑡𝑝𝑢𝑡 𝑜𝑓 𝑡ℎ𝑒 𝑎𝑟𝑟𝑎𝑦
= 𝑛𝑢𝑚𝑏𝑒𝑟 𝑜𝑓 𝑚𝑜𝑑𝑢𝑙𝑒𝑠 𝑟𝑒𝑞𝑢𝑖𝑟𝑒𝑑
× 𝑝𝑒𝑎𝑘 𝑝𝑜𝑤𝑒𝑟 𝑜𝑢𝑡𝑝𝑢𝑡 𝑜𝑓 𝑠𝑖𝑛𝑔𝑙𝑒 𝑚𝑜𝑑𝑢𝑙𝑒
18. Choose DC system voltage (V).
19. Calculate DC load required from the system (Wh);
𝐷𝐶 𝑙𝑜𝑎𝑑(𝑊ℎ) =
𝐴𝐶 𝑙𝑜𝑎𝑑(𝑊ℎ)
𝑖𝑛𝑣𝑒𝑟𝑡𝑒𝑟 𝑒𝑓𝑓𝑖𝑐𝑖𝑒𝑛𝑐𝑦(%)
20. Calculate DC load in Ah;
𝐷𝐶 𝑙𝑜𝑎𝑑(𝐴ℎ) =
𝐷𝐶 𝑙𝑜𝑎𝑑(𝑊ℎ)
𝑠𝑦𝑠𝑡𝑒𝑚 𝑣𝑜𝑙𝑡𝑎𝑔𝑒(𝑉)
21. Decide with customer number of days storage for battery bank.
22. Calculate capacity of required battery bank taking into account days of storage and depth of
discharge (DoD);
𝑏𝑎𝑡𝑡𝑒𝑟𝑦 𝑏𝑎𝑛𝑘 𝑐𝑎𝑝𝑎𝑐𝑖𝑡𝑦1(𝐴ℎ) = 𝐷𝐶 𝑙𝑜𝑎𝑑(𝐴ℎ) × 𝑟𝑒𝑠𝑒𝑟𝑣𝑒 𝑑𝑎𝑦𝑠 ÷ 𝑚𝑎𝑥𝑖𝑚𝑢𝑚 𝐷𝑜𝐷(%)
23. Calculate final capacity of battery bank with respect to minimum temperature of batteries
and discharge rate; use specification provided by battery manufacture
𝑐𝑎𝑝𝑎𝑐𝑖𝑡𝑦
𝑟𝑎𝑡𝑒𝑑 𝑐𝑎𝑝𝑎𝑐𝑖𝑡𝑦
(%)
𝑏𝑎𝑡𝑡𝑒𝑟𝑦 𝑏𝑎𝑛𝑘 𝑐𝑎𝑝𝑎𝑐𝑖𝑡𝑦(𝐴ℎ) =
𝑏𝑎𝑡𝑡𝑒𝑟𝑦 𝑏𝑎𝑛𝑘 𝑐𝑎𝑝𝑎𝑐𝑖𝑡𝑦1
𝑐𝑎𝑝𝑎𝑐𝑖𝑡𝑦
𝑟𝑎𝑡𝑒𝑑 𝑐𝑎𝑝𝑎𝑐𝑖𝑡𝑦
(%)
16. Jaroslaw Iskierski – Foundation Degree in Science
Electrical Engineering and Renewable Energy
Plymouth University
16
24. Establish how many appliances can run in the same time and calculate maximum expected
current drown by load from the battery and compare with maximum discharge current on
battery specification.
𝑚𝑎𝑥𝑖𝑚𝑢𝑚 𝑑𝑖𝑠𝑐ℎ𝑎𝑟𝑔𝑒 𝑐𝑢𝑟𝑟𝑒𝑛𝑡(𝐴)
= 𝑖𝑛𝑠𝑡𝑎𝑛𝑡𝑎𝑛𝑒𝑜𝑢𝑠 𝑝𝑜𝑤𝑒𝑟 𝑑𝑒𝑚𝑎𝑛𝑑(𝑊) ÷ 𝐷𝐶𝑠𝑦𝑠𝑡𝑒𝑚 𝑣𝑜𝑙𝑡𝑎𝑔𝑒(𝑉)
Maximum calculated discharge current must be lower than maximum discharge current
which battery can withstand.
25. Choose correct array configuration; connect in series required number of modules to match
battery voltage and calculate number of parallel connected strings;
𝑛𝑢𝑚𝑏𝑒𝑟 𝑜𝑓 𝑝𝑎𝑟𝑎𝑙𝑙𝑒𝑙 𝑐𝑜𝑛𝑛𝑒𝑐𝑡𝑒𝑑 𝑠𝑡𝑟𝑖𝑛𝑔𝑠
= 𝑛𝑢𝑚𝑏𝑒𝑟 𝑜𝑓 𝑚𝑜𝑑𝑢𝑙𝑒𝑠 𝑟𝑒𝑞𝑢𝑖𝑟𝑒𝑑 𝑖𝑛 𝑎𝑟𝑟𝑎𝑦
÷ 𝑛𝑢𝑚𝑏𝑒𝑟 𝑜𝑓 𝑚𝑜𝑑𝑢𝑙𝑒𝑠 𝑖𝑛 𝑜𝑛𝑒 𝑠𝑡𝑟𝑖𝑛𝑔
26. Choose correct “Battery Backup Inverter” with build-in charge controller.
27. Calculate inverter output rating taking into account all losses in the system;
𝑖𝑛𝑣𝑒𝑟𝑡𝑒𝑟 𝑜𝑢𝑡𝑝𝑢𝑡 𝑟𝑎𝑡𝑖𝑛𝑔(𝑊) = 𝑃𝑉 𝑎𝑟𝑟𝑎𝑦 𝑊𝑝 × 0.8
28. Check if the maximum current drown from batteries doesn’t excess maximum input current
of inverter.
29. Check if the voltage range of PV array for extremes of temperature doesn’t excess upper and
lower operating voltage range of MPPT of inverter charge controller. Specific calculations of
worst case VMPP calculated from manufacture data for a module temperature range of -15℃
to +80℃.
The deviation from STC (25℃) for -15℃ is 40℃ and for 80℃ is 55℃
- Calculate VMPP for maximum temperature of the module;
𝑉 𝑀𝑃𝑃 (𝑎𝑡 max. 𝑡𝑒𝑚𝑝.)
= 𝑠𝑡𝑟𝑖𝑛𝑔 𝑣𝑜𝑙𝑡𝑎𝑔𝑒 𝑎𝑡 𝑀𝑃𝑃 − (55℃ × (𝑠𝑡𝑟𝑖𝑛𝑔 𝑣𝑜𝑙𝑡𝑎𝑔𝑒 𝑎𝑡 𝑆𝑇𝐶
× 𝑣𝑜𝑙𝑡𝑎𝑔𝑒 𝑡𝑒𝑚𝑝. 𝑐𝑜𝑒𝑓𝑓𝑖𝑐𝑖𝑒𝑛𝑡))
- Calculate VMPP for minimum temperature of the module;
𝑉 𝑀𝑃𝑃 (𝑎𝑡 min. 𝑡𝑒𝑚𝑝.)
= 𝑠𝑡𝑟𝑖𝑛𝑔 𝑣𝑜𝑙𝑡𝑎𝑔𝑒 𝑎𝑡 𝑀𝑃𝑃 + (40℃ × (𝑠𝑡𝑟𝑖𝑛𝑔 𝑣𝑜𝑙𝑡𝑎𝑔𝑒 𝑎𝑡 𝑆𝑇𝐶
× 𝑣𝑜𝑙𝑡𝑎𝑔𝑒 𝑡𝑒𝑚𝑝. 𝑐𝑜𝑒𝑓𝑓𝑖𝑐𝑖𝑒𝑛𝑡))
17. Jaroslaw Iskierski – Foundation Degree in Science
Electrical Engineering and Renewable Energy
Plymouth University
17
30. Assess the capacity of the roof space when modules are laid out in portrait format;
- The number of modules down the roof = width of roof ÷ length of module
- The number of modules across the roof = length of roof ÷ width of module
31. Assess the capacity of the roof space when modules are laid out in horizontal format;
- The number of modules down the roof = width of roof ÷ width of module
- The number of modules across the roof = length of roof ÷ length of module
Cross check the assessed capacity of the roof with required capacity.
32. If the number of required PV modules not cover whole the roof area then install them in
place where there is no shading effect.
33. Use acetate foil with marked horizontal line to scan the horizon and mark with marker all the
objects which can cast shadow on the PV array (use Solar Site Selector survey tool with
bracket to hold acetate foil and compass). Follow MCS Solar PV Guide shading method.
34. The reading should be taken from the midpoint of the array lower edge of the proposed
array e.g. through an upstairs window (for array with no near shading objects) or the reading
should be taken from the array location worse affected by shade.
Fig.8. sun path diagram with calculation for objects at distance bigger than 10 metres from
the array.
Source:http://www.microgenerationcertification.org/images/MCS%20Shading%201%20FINA
L%20v2.pdf
18. Jaroslaw Iskierski – Foundation Degree in Science
Electrical Engineering and Renewable Energy
Plymouth University
18
Fig.9. sun path diagram with calculation for objects at distance 10 or less metres from the
array.
Source:http://www.microgenerationcertification.org/images/MCS%20Shading%201%20FINA
L%20v2.pdf
35. Apply the estimated reduction in output in % to total peak power output of PV array (taken
from step 17);
𝑟𝑒𝑑𝑢𝑐𝑒𝑑 𝑡𝑜𝑡𝑎𝑙 𝑝𝑒𝑎𝑘 𝑝𝑜𝑤𝑒𝑟 𝑜𝑢𝑡𝑝𝑢𝑡
= 𝑡𝑜𝑡𝑎𝑙 𝑝𝑒𝑎𝑘 𝑝𝑜𝑤𝑒𝑟 𝑜𝑢𝑡𝑝𝑢𝑡 𝑜𝑓 𝑡ℎ𝑒 𝑎𝑟𝑟𝑎𝑦 (𝑊𝑝)
÷ 𝑟𝑒𝑑𝑢𝑐𝑡𝑖𝑜𝑛 𝑖𝑛 𝑜𝑢𝑡𝑝𝑢𝑡 𝑑𝑢𝑒 𝑡𝑜 𝑠ℎ𝑎𝑑𝑖𝑛𝑔 (%)
36. If array is significantly affected by shading effect use inverters with multiple (independent)
MPP tracker inputs, move array to less affected area of the roof, redesign the system, use
more efficient modules which take less roof area or in the worst case consider if the site is
suitable for PV system.
19. Jaroslaw Iskierski – Foundation Degree in Science
Electrical Engineering and Renewable Energy
Plymouth University
19
Bibliography:
1. Planning & Installing Photovoltaic Systems; A guide for installers, architects and engineers;
Earthscan London; Second edition 2010
2. IEE Wiring Regulations, Seventeenth Edition ; BS 7671:2008 ; Requirements for Electrical
Installations
3. Trevor Linsley; Advanced Electrical Installation Work; Nevnes Oxford; Fifth edition 2008
4. NICEIC training 2011; Solar PV; printed document
5. Hankins, Mark; Stand-alone solar electric systems : the expert handbook for planning, design,
and installation; Earthscan (2010)
Websites:
1. LatLong.Net (http://www.latlong.net/). Accessed 05.03.2015.
2. PVGIS-CMSAF http://re.jrc.ec.europa.eu/pvgis/apps4/MRcalc.php Accessed 05.03.2015
3. http://www.microgenerationcertification.org/images/MCS%20Shading%201%20FINAL%20v2
.pdf