SlideShare a Scribd company logo
1 of 1
Download to read offline
Electric Utility, Inc. – Balanced Scorecard Example
                                 Objectives                                   Measures (D=Drivers)                            Targets                       Initiatives
                                                                                                                     FY01      FY02     FY03
  Customer Financial


                       •Maximize returns                    •ROCE
                                                                                                                     14%       14.5%    15%
                       •Profitable growth                   •Revenue growth                                           6%         8%     12%
                       •Leverage asset base                 •Asset utilization rate                                  80%        85%     90%
                                                                                                                     $150       $140    $125
                       •Manage operating costs              •Operating costs / customer
                       •Industry leading customer loyalty   •Customer Satisfaction Rating                            80%        85%     90%      •Customer loyalty program


                       Business Growth                      •% revenue from deregulated products/services              5%        7%      10%     •Telecom infrastructure development
                       •Capitalize on deregulation          •% trading revenue                                        10%       12%      15%     •Trading risk assessment
                       opportunities                        •Revenue from new services                               $500M     $550M    $600M
                       •Optimize trading opportunities      •% customers serviced through alliances/joint ventures    10%       20%      25%
                       •Develop innovative services         •NPV product/service pipeline                            $500M     $550M    $600M
                       •Use alliances and joint ventures    •% R&D projects meeting protocol gates (D)                90%       95%      100%    •Research alliance program
                       •Leverage cross-group R&D

                       Continued Public Support             •Customer/partner satisfaction (5 point scale)             4.0       4.5      4.5    •Preventative maintenance
  Internal Processes


                       •Proactively manage relationships    •Reliability index                                       90/100    92/100   95/100
                       •Ensure reliable services            •% communication/education coverage                      100%      100%     100%     •Community outreach
                       •Communicate/educate customers       •% communication/education plans executed (D)             80%       85%      90%

                       Customer Service Excellence          •Promise delivery %                                       90%       95%      97%     •Cross-selling marketing program
                       •Seamless cross-group delivery       •New product uptake rate                                  20%       25%      30%     •Service dispatch automation
                       •Understand customer drivers         •On-time market projects (D)                              90%       95%     100%

                       •Effective customer services         •Customer satisfaction rating C.S.D. (see above)          85%       89%      95%     •CIS upgrade
                                                            •Problem resolution cycle time C.S.D. (D)                  6hr       4hr      3hr    •Call center software integration
                       Optimize Core Business
                       •Optimize asset utilization          •% rate capacity attained                                 80%       85%      90%     •Fossil maintenance benchmark

                       •Max return on resource allocation   •Employee productivity improvement                         2%        3%      4%      •Shared service
                                                            •% cost reduction                                          4%        5%      6%      benchmark/outsourcing initiative
                       •Continued cost management           •Cost of disruption vs. plan                             +/-15%    +/-10%   +/-5%
                       •Enterprise-wide risk management     •Time to recovery (D)                                      8hr       4hr     2hr     •ERP Implementation

                       •Ensure market-driven skill          •Strategic skill coverage ratio                           65%       75%     85%      •Competency profiling
  L&G


                       •Leading employee satisfaction       •Hours in strategic skills training (D)                    10        12      15
                       •World Class Leadership              •Employee satisfaction rating (5 point scale)              3.0       4.0     4.5     •Performance compensation link
                                                            •Leadership effectiveness ratio (5 point scale)            4.0       4.5     4.5     •Leadership training program


©2010 Palladium Group, Inc                                                                                                                                                              1

More Related Content

What's hot

How to implement a strategic IT vendor management program
How to implement a strategic IT vendor management programHow to implement a strategic IT vendor management program
How to implement a strategic IT vendor management programJeff Kubacki
 
Project Management: Integrating a PMO Case Study by David Bustin
Project Management: Integrating a PMO Case Study by David BustinProject Management: Integrating a PMO Case Study by David Bustin
Project Management: Integrating a PMO Case Study by David BustinDavid Bustin
 
Overview of Key Performance Indicators
Overview of Key Performance IndicatorsOverview of Key Performance Indicators
Overview of Key Performance IndicatorsMicheal Axelsen
 
Business Strategy Presentation Template 2023 - By ex-Mckinsey and BCG consult...
Business Strategy Presentation Template 2023 - By ex-Mckinsey and BCG consult...Business Strategy Presentation Template 2023 - By ex-Mckinsey and BCG consult...
Business Strategy Presentation Template 2023 - By ex-Mckinsey and BCG consult...Slideworks
 
Fueling the Energy Future
Fueling the Energy FutureFueling the Energy Future
Fueling the Energy Futureaccenture
 
New horizons in transportation: mobility, innovation, economic development an...
New horizons in transportation: mobility, innovation, economic development an...New horizons in transportation: mobility, innovation, economic development an...
New horizons in transportation: mobility, innovation, economic development an...McKinsey & Company
 
Turning big data into big revenue
Turning big data into big revenueTurning big data into big revenue
Turning big data into big revenuePwC
 
The Decade to Deliver: A Call to Business Action
The Decade to Deliver: A Call to Business Action The Decade to Deliver: A Call to Business Action
The Decade to Deliver: A Call to Business Action accenture
 
The Press Forward Discussion: Pipeline to Leadership for Women in News
The Press Forward Discussion: Pipeline to Leadership for Women in NewsThe Press Forward Discussion: Pipeline to Leadership for Women in News
The Press Forward Discussion: Pipeline to Leadership for Women in NewsMcKinsey & Company
 
Comment le LACE de SAFe permet la transformation Agile à l'échelle du groupe ...
Comment le LACE de SAFe permet la transformation Agile à l'échelle du groupe ...Comment le LACE de SAFe permet la transformation Agile à l'échelle du groupe ...
Comment le LACE de SAFe permet la transformation Agile à l'échelle du groupe ...Agile En Seine
 
When, Where & How AI Will Boost Federal Workforce Productivity
When, Where & How AI Will Boost Federal Workforce ProductivityWhen, Where & How AI Will Boost Federal Workforce Productivity
When, Where & How AI Will Boost Federal Workforce Productivityaccenture
 
Dyer at kearny presentation
Dyer at kearny presentationDyer at kearny presentation
Dyer at kearny presentationCALSTART
 
Horváth & Partners: Office of Strategy Management
Horváth & Partners: Office of Strategy ManagementHorváth & Partners: Office of Strategy Management
Horváth & Partners: Office of Strategy ManagementDr. Tim Wolf
 
25 KPIs Every Manager Needs To Know
25 KPIs Every Manager Needs To Know25 KPIs Every Manager Needs To Know
25 KPIs Every Manager Needs To KnowBernard Marr
 
Presentation winning strategies for shared services in the public sector
Presentation winning strategies for shared services in the public sectorPresentation winning strategies for shared services in the public sector
Presentation winning strategies for shared services in the public sectorChazey Partners
 
Strategy Study 2014 | A.T. Kearney
Strategy Study 2014 | A.T. KearneyStrategy Study 2014 | A.T. Kearney
Strategy Study 2014 | A.T. KearneyKearney
 
Federal Technology Vision 2021: Full U.S. Federal Survey Findings | Accenture
Federal Technology Vision 2021: Full U.S. Federal Survey Findings | AccentureFederal Technology Vision 2021: Full U.S. Federal Survey Findings | Accenture
Federal Technology Vision 2021: Full U.S. Federal Survey Findings | Accentureaccenture
 
PwC Insurance -Stress-testing
PwC Insurance -Stress-testingPwC Insurance -Stress-testing
PwC Insurance -Stress-testingPwC
 

What's hot (20)

How to implement a strategic IT vendor management program
How to implement a strategic IT vendor management programHow to implement a strategic IT vendor management program
How to implement a strategic IT vendor management program
 
Project Management: Integrating a PMO Case Study by David Bustin
Project Management: Integrating a PMO Case Study by David BustinProject Management: Integrating a PMO Case Study by David Bustin
Project Management: Integrating a PMO Case Study by David Bustin
 
Overview of Key Performance Indicators
Overview of Key Performance IndicatorsOverview of Key Performance Indicators
Overview of Key Performance Indicators
 
Business Strategy Presentation Template 2023 - By ex-Mckinsey and BCG consult...
Business Strategy Presentation Template 2023 - By ex-Mckinsey and BCG consult...Business Strategy Presentation Template 2023 - By ex-Mckinsey and BCG consult...
Business Strategy Presentation Template 2023 - By ex-Mckinsey and BCG consult...
 
BCG Telco Sustainability Index
BCG Telco Sustainability IndexBCG Telco Sustainability Index
BCG Telco Sustainability Index
 
Fueling the Energy Future
Fueling the Energy FutureFueling the Energy Future
Fueling the Energy Future
 
New horizons in transportation: mobility, innovation, economic development an...
New horizons in transportation: mobility, innovation, economic development an...New horizons in transportation: mobility, innovation, economic development an...
New horizons in transportation: mobility, innovation, economic development an...
 
Turning big data into big revenue
Turning big data into big revenueTurning big data into big revenue
Turning big data into big revenue
 
The Decade to Deliver: A Call to Business Action
The Decade to Deliver: A Call to Business Action The Decade to Deliver: A Call to Business Action
The Decade to Deliver: A Call to Business Action
 
The Press Forward Discussion: Pipeline to Leadership for Women in News
The Press Forward Discussion: Pipeline to Leadership for Women in NewsThe Press Forward Discussion: Pipeline to Leadership for Women in News
The Press Forward Discussion: Pipeline to Leadership for Women in News
 
Comment le LACE de SAFe permet la transformation Agile à l'échelle du groupe ...
Comment le LACE de SAFe permet la transformation Agile à l'échelle du groupe ...Comment le LACE de SAFe permet la transformation Agile à l'échelle du groupe ...
Comment le LACE de SAFe permet la transformation Agile à l'échelle du groupe ...
 
When, Where & How AI Will Boost Federal Workforce Productivity
When, Where & How AI Will Boost Federal Workforce ProductivityWhen, Where & How AI Will Boost Federal Workforce Productivity
When, Where & How AI Will Boost Federal Workforce Productivity
 
Dyer at kearny presentation
Dyer at kearny presentationDyer at kearny presentation
Dyer at kearny presentation
 
Horváth & Partners: Office of Strategy Management
Horváth & Partners: Office of Strategy ManagementHorváth & Partners: Office of Strategy Management
Horváth & Partners: Office of Strategy Management
 
The Electric Car Tipping Point
The Electric Car Tipping PointThe Electric Car Tipping Point
The Electric Car Tipping Point
 
25 KPIs Every Manager Needs To Know
25 KPIs Every Manager Needs To Know25 KPIs Every Manager Needs To Know
25 KPIs Every Manager Needs To Know
 
Presentation winning strategies for shared services in the public sector
Presentation winning strategies for shared services in the public sectorPresentation winning strategies for shared services in the public sector
Presentation winning strategies for shared services in the public sector
 
Strategy Study 2014 | A.T. Kearney
Strategy Study 2014 | A.T. KearneyStrategy Study 2014 | A.T. Kearney
Strategy Study 2014 | A.T. Kearney
 
Federal Technology Vision 2021: Full U.S. Federal Survey Findings | Accenture
Federal Technology Vision 2021: Full U.S. Federal Survey Findings | AccentureFederal Technology Vision 2021: Full U.S. Federal Survey Findings | Accenture
Federal Technology Vision 2021: Full U.S. Federal Survey Findings | Accenture
 
PwC Insurance -Stress-testing
PwC Insurance -Stress-testingPwC Insurance -Stress-testing
PwC Insurance -Stress-testing
 

Viewers also liked

Balanced Scorecard Presentation
Balanced Scorecard PresentationBalanced Scorecard Presentation
Balanced Scorecard Presentationtimadams2323
 
CUADRO DE MANDO INTEGRAL BALANCED SCORECARD
CUADRO DE MANDO INTEGRAL BALANCED SCORECARDCUADRO DE MANDO INTEGRAL BALANCED SCORECARD
CUADRO DE MANDO INTEGRAL BALANCED SCORECARDjeshuko
 
8995951 sustainability-balanced-scorecard
8995951 sustainability-balanced-scorecard8995951 sustainability-balanced-scorecard
8995951 sustainability-balanced-scorecardSoumya Sahoo
 
Cuadro de Mando Integral CMI
Cuadro de Mando Integral CMICuadro de Mando Integral CMI
Cuadro de Mando Integral CMILili Cueva
 
Sesion 3 indicadores perspectiva aprendizaje
Sesion 3 indicadores perspectiva aprendizajeSesion 3 indicadores perspectiva aprendizaje
Sesion 3 indicadores perspectiva aprendizajeAugusto Javes Sanchez
 
Really Simple Balanced Scorecard
Really Simple Balanced ScorecardReally Simple Balanced Scorecard
Really Simple Balanced ScorecardSamuli Pahkala
 
Cuadro De Mando Integral Perspectivas
Cuadro De Mando Integral   PerspectivasCuadro De Mando Integral   Perspectivas
Cuadro De Mando Integral PerspectivasIsaac Enciso
 
Sesion 4 indicadores procesos internos
Sesion 4 indicadores procesos internosSesion 4 indicadores procesos internos
Sesion 4 indicadores procesos internosAugusto Javes Sanchez
 
Balanace score card ppt
Balanace score card pptBalanace score card ppt
Balanace score card pptAravind Reddy
 
Balanced Scorecard Aplicación e Implementación
Balanced Scorecard Aplicación e ImplementaciónBalanced Scorecard Aplicación e Implementación
Balanced Scorecard Aplicación e ImplementaciónJuan Carlos Fernandez
 

Viewers also liked (14)

Balanced Scorecard Presentation
Balanced Scorecard PresentationBalanced Scorecard Presentation
Balanced Scorecard Presentation
 
CUADRO DE MANDO INTEGRAL BALANCED SCORECARD
CUADRO DE MANDO INTEGRAL BALANCED SCORECARDCUADRO DE MANDO INTEGRAL BALANCED SCORECARD
CUADRO DE MANDO INTEGRAL BALANCED SCORECARD
 
8995951 sustainability-balanced-scorecard
8995951 sustainability-balanced-scorecard8995951 sustainability-balanced-scorecard
8995951 sustainability-balanced-scorecard
 
Nestle Performance Management (1)
Nestle Performance Management (1)Nestle Performance Management (1)
Nestle Performance Management (1)
 
Cuadro de Mando Integral CMI
Cuadro de Mando Integral CMICuadro de Mando Integral CMI
Cuadro de Mando Integral CMI
 
Pepsico Final project
Pepsico Final projectPepsico Final project
Pepsico Final project
 
Sesion 3 indicadores perspectiva aprendizaje
Sesion 3 indicadores perspectiva aprendizajeSesion 3 indicadores perspectiva aprendizaje
Sesion 3 indicadores perspectiva aprendizaje
 
Adidas bsc
Adidas bsc Adidas bsc
Adidas bsc
 
Really Simple Balanced Scorecard
Really Simple Balanced ScorecardReally Simple Balanced Scorecard
Really Simple Balanced Scorecard
 
Cuadro De Mando Integral Perspectivas
Cuadro De Mando Integral   PerspectivasCuadro De Mando Integral   Perspectivas
Cuadro De Mando Integral Perspectivas
 
Sesion 4 indicadores procesos internos
Sesion 4 indicadores procesos internosSesion 4 indicadores procesos internos
Sesion 4 indicadores procesos internos
 
Nestle Performance Management (2)
Nestle Performance Management (2)Nestle Performance Management (2)
Nestle Performance Management (2)
 
Balanace score card ppt
Balanace score card pptBalanace score card ppt
Balanace score card ppt
 
Balanced Scorecard Aplicación e Implementación
Balanced Scorecard Aplicación e ImplementaciónBalanced Scorecard Aplicación e Implementación
Balanced Scorecard Aplicación e Implementación
 

Similar to Sample balanced scorecard

Making case for a virtual support center
Making case for a virtual support centerMaking case for a virtual support center
Making case for a virtual support centerIT Service and Support
 
Baldrige Quality 09c
Baldrige Quality 09cBaldrige Quality 09c
Baldrige Quality 09cBritt Watwood
 
Business Objectives Matrix
Business Objectives MatrixBusiness Objectives Matrix
Business Objectives MatrixDemand Metric
 
Six Sigma Simplified for Service Organizations
Six Sigma Simplified for Service OrganizationsSix Sigma Simplified for Service Organizations
Six Sigma Simplified for Service OrganizationsRobert Jasper
 
Differential Value Proposition presented by GE and Valkre
Differential Value Proposition presented by GE and ValkreDifferential Value Proposition presented by GE and Valkre
Differential Value Proposition presented by GE and ValkreBMAChicago
 
Product Spotlight: Oracle Profitability and Cost Management
Product Spotlight: Oracle Profitability and Cost ManagementProduct Spotlight: Oracle Profitability and Cost Management
Product Spotlight: Oracle Profitability and Cost ManagementInnovusPartners
 
Logistics as Customer Service
Logistics as Customer ServiceLogistics as Customer Service
Logistics as Customer ServiceYonus Siddiqui
 
Key performance indicators 2010
Key performance indicators 2010Key performance indicators 2010
Key performance indicators 2010Hj Arriffin Mansor
 
Uni Solutions Overview
Uni Solutions OverviewUni Solutions Overview
Uni Solutions Overviewsanthosh9000
 
Business Value Articulation In Software Projects
Business Value Articulation In Software ProjectsBusiness Value Articulation In Software Projects
Business Value Articulation In Software ProjectsHARMAN Services
 
Bug deBug Chennai 2012 Talk - Business value articulation in software project...
Bug deBug Chennai 2012 Talk - Business value articulation in software project...Bug deBug Chennai 2012 Talk - Business value articulation in software project...
Bug deBug Chennai 2012 Talk - Business value articulation in software project...RIA RUI Society
 
Introductory Advantage Presentation 4 1 09
Introductory Advantage Presentation 4 1 09Introductory Advantage Presentation 4 1 09
Introductory Advantage Presentation 4 1 09Earlynn373
 
Softtek Break Through Savings No Need Offshore 2011 Asug Final
Softtek Break Through Savings No Need Offshore 2011 Asug FinalSofttek Break Through Savings No Need Offshore 2011 Asug Final
Softtek Break Through Savings No Need Offshore 2011 Asug FinalMauro Okamoto
 
Cai Overview
Cai OverviewCai Overview
Cai Overviewdeyoepw
 
Key Performance Indicators Worksheet
Key Performance Indicators WorksheetKey Performance Indicators Worksheet
Key Performance Indicators WorksheetDemand Metric
 
Guest satisfaction hospitality_industry
Guest satisfaction hospitality_industryGuest satisfaction hospitality_industry
Guest satisfaction hospitality_industry6EXCEL CONSULTING
 
Key Business Processes And Activities For Excellence PowerPoint Presentation ...
Key Business Processes And Activities For Excellence PowerPoint Presentation ...Key Business Processes And Activities For Excellence PowerPoint Presentation ...
Key Business Processes And Activities For Excellence PowerPoint Presentation ...SlideTeam
 

Similar to Sample balanced scorecard (20)

Making case for a virtual support center
Making case for a virtual support centerMaking case for a virtual support center
Making case for a virtual support center
 
Baldrige Quality 09c
Baldrige Quality 09cBaldrige Quality 09c
Baldrige Quality 09c
 
Business Objectives Matrix
Business Objectives MatrixBusiness Objectives Matrix
Business Objectives Matrix
 
Six Sigma Simplified for Service Organizations
Six Sigma Simplified for Service OrganizationsSix Sigma Simplified for Service Organizations
Six Sigma Simplified for Service Organizations
 
Differential Value Proposition presented by GE and Valkre
Differential Value Proposition presented by GE and ValkreDifferential Value Proposition presented by GE and Valkre
Differential Value Proposition presented by GE and Valkre
 
Product Spotlight: Oracle Profitability and Cost Management
Product Spotlight: Oracle Profitability and Cost ManagementProduct Spotlight: Oracle Profitability and Cost Management
Product Spotlight: Oracle Profitability and Cost Management
 
Logistics as Customer Service
Logistics as Customer ServiceLogistics as Customer Service
Logistics as Customer Service
 
Key performance indicators 2010
Key performance indicators 2010Key performance indicators 2010
Key performance indicators 2010
 
Uni Solutions Overview
Uni Solutions OverviewUni Solutions Overview
Uni Solutions Overview
 
Six Sigma
Six SigmaSix Sigma
Six Sigma
 
Business Value Articulation In Software Projects
Business Value Articulation In Software ProjectsBusiness Value Articulation In Software Projects
Business Value Articulation In Software Projects
 
Bug deBug Chennai 2012 Talk - Business value articulation in software project...
Bug deBug Chennai 2012 Talk - Business value articulation in software project...Bug deBug Chennai 2012 Talk - Business value articulation in software project...
Bug deBug Chennai 2012 Talk - Business value articulation in software project...
 
Introductory Advantage Presentation 4 1 09
Introductory Advantage Presentation 4 1 09Introductory Advantage Presentation 4 1 09
Introductory Advantage Presentation 4 1 09
 
Quality Management .pptx
Quality Management .pptxQuality Management .pptx
Quality Management .pptx
 
Softtek Break Through Savings No Need Offshore 2011 Asug Final
Softtek Break Through Savings No Need Offshore 2011 Asug FinalSofttek Break Through Savings No Need Offshore 2011 Asug Final
Softtek Break Through Savings No Need Offshore 2011 Asug Final
 
Cai Overview
Cai OverviewCai Overview
Cai Overview
 
Workforce Productivity in BPO
Workforce Productivity in BPOWorkforce Productivity in BPO
Workforce Productivity in BPO
 
Key Performance Indicators Worksheet
Key Performance Indicators WorksheetKey Performance Indicators Worksheet
Key Performance Indicators Worksheet
 
Guest satisfaction hospitality_industry
Guest satisfaction hospitality_industryGuest satisfaction hospitality_industry
Guest satisfaction hospitality_industry
 
Key Business Processes And Activities For Excellence PowerPoint Presentation ...
Key Business Processes And Activities For Excellence PowerPoint Presentation ...Key Business Processes And Activities For Excellence PowerPoint Presentation ...
Key Business Processes And Activities For Excellence PowerPoint Presentation ...
 

Sample balanced scorecard

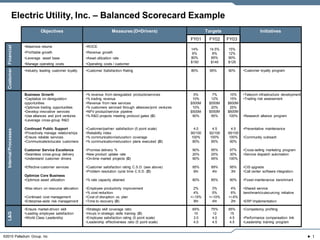
  • 1. Electric Utility, Inc. – Balanced Scorecard Example Objectives Measures (D=Drivers) Targets Initiatives FY01 FY02 FY03 Customer Financial •Maximize returns •ROCE 14% 14.5% 15% •Profitable growth •Revenue growth 6% 8% 12% •Leverage asset base •Asset utilization rate 80% 85% 90% $150 $140 $125 •Manage operating costs •Operating costs / customer •Industry leading customer loyalty •Customer Satisfaction Rating 80% 85% 90% •Customer loyalty program Business Growth •% revenue from deregulated products/services 5% 7% 10% •Telecom infrastructure development •Capitalize on deregulation •% trading revenue 10% 12% 15% •Trading risk assessment opportunities •Revenue from new services $500M $550M $600M •Optimize trading opportunities •% customers serviced through alliances/joint ventures 10% 20% 25% •Develop innovative services •NPV product/service pipeline $500M $550M $600M •Use alliances and joint ventures •% R&D projects meeting protocol gates (D) 90% 95% 100% •Research alliance program •Leverage cross-group R&D Continued Public Support •Customer/partner satisfaction (5 point scale) 4.0 4.5 4.5 •Preventative maintenance Internal Processes •Proactively manage relationships •Reliability index 90/100 92/100 95/100 •Ensure reliable services •% communication/education coverage 100% 100% 100% •Community outreach •Communicate/educate customers •% communication/education plans executed (D) 80% 85% 90% Customer Service Excellence •Promise delivery % 90% 95% 97% •Cross-selling marketing program •Seamless cross-group delivery •New product uptake rate 20% 25% 30% •Service dispatch automation •Understand customer drivers •On-time market projects (D) 90% 95% 100% •Effective customer services •Customer satisfaction rating C.S.D. (see above) 85% 89% 95% •CIS upgrade •Problem resolution cycle time C.S.D. (D) 6hr 4hr 3hr •Call center software integration Optimize Core Business •Optimize asset utilization •% rate capacity attained 80% 85% 90% •Fossil maintenance benchmark •Max return on resource allocation •Employee productivity improvement 2% 3% 4% •Shared service •% cost reduction 4% 5% 6% benchmark/outsourcing initiative •Continued cost management •Cost of disruption vs. plan +/-15% +/-10% +/-5% •Enterprise-wide risk management •Time to recovery (D) 8hr 4hr 2hr •ERP Implementation •Ensure market-driven skill •Strategic skill coverage ratio 65% 75% 85% •Competency profiling L&G •Leading employee satisfaction •Hours in strategic skills training (D) 10 12 15 •World Class Leadership •Employee satisfaction rating (5 point scale) 3.0 4.0 4.5 •Performance compensation link •Leadership effectiveness ratio (5 point scale) 4.0 4.5 4.5 •Leadership training program ©2010 Palladium Group, Inc  1