Project Management - Project Measuring
•Download as PPTX, PDF•
1 like•634 views

This is a project management measuring tool that is one of the coolest things I've ever seen for how to look at a big project. They should do these for any government or Big IT project. It seems complicated at first, but I tried to explain exactly how it works in this. I did not create it, first saw it in 1994/1995. I made this file to try to explain it to others (still is confusing), but please comment if you know its origins.

Recommended
Recommended
More Related Content
Similar to Project Management - Project Measuring
Similar to Project Management - Project Measuring (20)
More from Chief Innovation
More from Chief Innovation (20)
Recently uploaded
Recently uploaded (20)
Project Management - Project Measuring
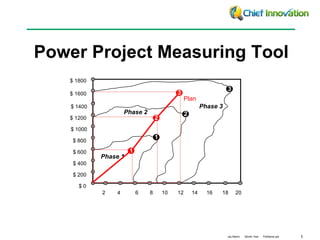
- 1. 1Jay Martin Month Year FileName.ppt Powerful Project Measuring Tool $ 0 $ 200 $ 400 $ 600 $ 800 $ 1000 $ 1200 $ 1400 $ 1600 $ 1800 2 4 6 8 10 12 14 16 18 20 2 Phase 1 Phase 2 Phase 3 1 3 Plan 1 2 3
- 2. 2Jay Martin Month Year FileName.ppt Measuring the performance of a project, during the project, is complicated but requires monitoring two things – time & resources. Project Measurement Introduction • The team or people concerned with the project need to know: • Status - current status with respect to Milestones completed • Expenses to Date - Value of resources expended to date • Elapsed Time - Time elapsed since start • Projected Completion Date(s) – for current and future milestones • Projected Expenditures for Completion – dollars, man-hours, etc. • As the project progresses, it is only logical to assume the the dates and dollars will change with time and that as completion nears (either for the entire project or specific milestones), those estimates will become more accurate. Though quality of the results of the process is important, it is more of an end-process measure versus a metric to be monitored in-process.
- 3. 3Jay Martin Month Year FileName.ppt It appears complicated at first, but it is actually simple and powerful. Project Measurement The Tool $ 0 $ 200 $ 400 $ 600 $ 800 $ 1000 $ 1200 $ 1400 $ 1600 $ 1800 2 4 6 8 10 12 14 16 18 20 2 Phase 1 Phase 2 Phase 3 1 3 Plan Red lines signifies initial planned dates and dollars 1 2 3
- 4. 4Jay Martin Month Year FileName.ppt The example on the previous page is for a 3-Phase Project which has already been completed. From the chart we can deduce the following. Project Measurement Understanding the Example • The original completion dates and expenditures for the phases were: • Phase 1 – Week 6, $600k • Phase 2 – Week 9, $1.2 MM • Phase 3 – Week 12, $1.6 MM • The actual completion dates and expenditures for the project were: • Phase 1 – Week 8.5, $800 K • Phase 2 – Week 13, $1.15 MM • Phase 3 – Week 18.25, $1.65 MM The initial projections are the intersections with the X & Y axis while the actuals are at the intersection of the two lines (Black Balls).
- 5. 5Jay Martin Month Year FileName.ppt To explain how to read and create this, we will take the previous example (only Phase 1) and show where the info might come from. Project Measurement Explanation 2 4 6 8 10 $ 0 $ 200 $ 400 $ 600 $ 800 Phase 1 During ? 1. (In our example we will only do one phase, but same rules apply for all). The first 2 points are the initial projections for Total Project Time (X, Y=0) and Total Resources (X=0, Y). In the example you can see it was projected at the start that Phase 1 would need 6 Weeks (6, 0) and $600K (0, 600). These two points which intersect the axes become the starting points for the two lines which end at Ball 1. 2. Points A and B represent two separate lines which start at either axis. The points on the line ending with A are the “Expected Value” of the cost of Phase 1 at each time on the X Axis during the progression of Phase 1. The other line, B, is the “Expected End Date” of Phase 1 at each given dollar level spent. (X,Y) = Line A – (Real Time, Projected Total Dollars) Line B – (Projected Total Time, Real Dollars) 3. The confusing part is when to plot another point. You can do this at selected times or dollars (does not matter). If you use only time, then remember that the dollar numbers will not be nice and even as in the example. This example has A taken at Week 6 with a projection of $775k to finish. B is after $550K, they expect to finish in 6.5 weeks. Here Week 6 & $550k are the time this point was plotted and the actual dollars spent to date. 4. As you plot the two lines during Phase 1, you notice that as the end draws near, their accuracy increases and they begin to converge, just as “Actuals” and “Projections” would naturally come closer (Ball 1). Steps Needed to Create/Update Tool 2 4 6 8 10 $ 0 $ 200 $ 400 $ 600 $ 800 Phase 1 Complete 1 A B $ 775 6 $ 550 6.25 Weeks Plan
- 6. 6Jay Martin Month Year FileName.ppt Some tips on using this. Project Measurement Additional Comments • When doing this, you plot all of the lines (for all phases) whenever you take a data point (you can simply add on slippage from current phase to recalculate others). • Study the example and understand that: • There are two lines which use four datum: • (1) Actual time (today) versus (2) Expected Complete dollars of the Phase • (3) Actual dollars spent versus (4) Expected Date of Phase Completion • Points can be plotted whenever you wish, with the lines coming together at the end of the Phase. • Anyone you use this with will need it explained in person until they get it. • I have no idea who invented it, nor have I ever seen it explained thoroughly, BUT I did find a reference in Shina’s Concurrent Engineering (p45), though they have no reference to its creators nor is it explained well other than a name “the Bug Chart”.