1. 641817
The effect of exercise intensity on carbohydrate and fat metabolism
Introduction
Fats and carbohydrates (CHO) are the main fuels that generate the synthesis of ATP (Van
loon et al, 2001). The hydrolysis of ATP releases energy which is essential for muscle
contraction (McCullagh et al., 2014). Due to different sports have different exercise
intensities, it is essential to see how intensity effects fuel use to produce ATP. Therefore the
aim of this study is to see if exercise intensity effects the metabolism of CHO and fats.
There are three energy systems that generate ATP. The first energy system is the glycolytic
system. Glycolysis is the breakdown of glucose, producing pyruvate and ATP. Aerobic
glycolysis is breakdown of glucose to pyruvate which is then used for the oxidative
phosphorylation pathway (Tiidus et al, 2012). However if there’s an oxygen deficit, lactate is
produced due to the reduction of pyruvate, catalysed by lactate dehydrogenase (LDH). This
anaerobic glycolytic system takes place at a high intensity where oxygen is insufficient (Katz
and Sahlin, 1988) however aerobic glycolytic system takes place at moderate intensity.
The second system is the oxidative phosphorylation system. This is also called aerobic
respiration (Tiidus et al, 2012). This is the complete oxidation of CHO and fats, which
produces according to MacLaren & Morton (2012): carbon dioxide, water and ATP. This
process requires oxygen and CHO goes through aerobic glycolysis, producing pyruvate.
Pyruvate is then converted to acetyl-coA through oxidative decarboxylation, catalysed by
pyruvate dehydrogenase (Parolin et al, 1999). Fatty acids go through carnitine shuttle and β-
oxidation to produce acetyl CoA. Acetyl CoA initiates TCA cycle and the electron transport
chain in the mitochondria. This aerobic process takes place at a low-to-moderate intensity,
and during prolonged exercise (Göktepe, 2007). This process produces the most ATP
compared to the two energy systems and takes the longest.
The last energy system is the PCR system. This process is a reaction where ATP can be
regenerated from ADP and phosphocreatine (PCR), by PCR donating its phosphate group to
ADP. The enzyme creatine kinase (CK) catalyses this reaction (MacLaren and Morton,
2012). This reaction is very quick (Baker et al, 2010), therefore PCR is the main energy
source for high intensity contractions and for short 10s burst at a maximal workload
(Göktepe, 2007).
Based on these three energy systems, CHO sources will be dominantly utilised at high
exercise intensity. However looking at a low to moderate intensity, fat utilisation will be
2. 641817
more dominant. Romijn et al (1993) found the proportion of CHO oxidation increased as
intensity increased and also the highest fat oxidation rate was at moderate intensity. Therefore
the hypothesis is that exercise intensity will effect carbohydrate and fat utilisation. So as
exercise intensity increases, CHO sources will be more dominantly used compared to fat
sources. Lastly at low to moderate intensity, fat sources are more dominantly used.
Methods
Participants: There were 5 male participants that volunteered to take part in the study. With a
mean (±SD) age, height, weight and BMI of 20.4±1.14 years, 1.80±0.05 m, 80.4±2.89 kg and
25±2.01 respectively.
Design: The design of the study was a one-way within design. There were 3 phases, the
resting phase, 60W phase and the 180 W phase. Each phase lasted for 5 minutes (15mins in
total).
Experimental protocol: Firstly the participant’s height and weight was measured in kg and
metres respectively. The temperature of the room was measured using a thermometer. Also
the barometer was used to measure the atmospheric pressure and humidity. Douglas bags
were also vacuumed. There was a resting phase where participant sat still for 5 minutes, then
the participant exercised workload at 60W for 5 minutes and then the work load increased to
180 W (high intensity) for the last 5 minutes. For every minute of each phase, heart rate was
monitored. During the 3rd minute, the participant inserted the mouth piece which was
connected to the Douglas Bag. A Nose clip was placed on the participant’s nose and was told
to breathe normally. At the fourth minute, gas was collected in the Douglas bags. Gas was
collected for one minute and at the end of the minute, the mouth piece was taken off.
Analysis: The gas was analysed by the Servomex which measured the % of expired O2 and
the % of expired CO2. Dry Gas meter was used to measure the volume of gas expired in the
Douglas bags in litres and also the temperature of the gas which was recorded in °C. By using
excel, the data collected in the experimental protocol was used to calculate the mean ± SD of
energy expenditure (kJ/min), fat oxidation (g/min), carbohydrate oxidation (g/min) and
respiratory exchange ratio (RER) at each work load. Then SPSS was used to identify
differences between the dependant variables measured at each work load by generating a one-
way within subjects ANOVA.
3. 641817
Results
CHO Oxidation: There was a significant effect of exercise intensity on CHO oxidation (F1.09,
4.39 =514.30, P<0.001). On figure 1, CHO oxidation was significantly (P<0.05) higher at 60W
(0.3 g/min, s=0.13) compared to resting carbohydrate oxidation (0.03 g/min, s=0.02), where
the 95% CI of the mean difference was from 0.01 to 0.54 g/min. CHO oxidation was also
significantly higher at 180W (4.18 g/min, s=0.33) compared to rest, where the 95% CI of the
mean difference was from 3.58 to 4.72 g/min. Lastly there was a significantly higher
carbohydrate oxidation at 180W compared to 60W, where the 95% CI of the mean difference
was from 3.1 to 4.64 g/min.
Fat Oxidation:There was a significant overall effect of workload on fat oxidation (F1.09, 4.34
=144.33, P<0.001). On figure 2, fat oxidation was significantly higher at 60W (1.13 g/min,
s=0.04) compared to 0W (0.22 g/min, s=0.04), where the 95% CI of the mean difference was
from 0.81 to 1 g/min. Fat oxidation at 60W was also significantly higher compared to 180W
(0.25 g/min, s=0.14), where the 95% CI of the mean difference was from 0.56 to 1.2 g/min.
However there was not a significant difference (P>0.05) in fat oxidation between 180W and
0W (95% CI of the mean difference= -0.224 to 0.28 g/min)
RER: There was a significant effect of workload on RER (F2, 8=216.88, P<0.001). On figure
3, RER at workload 180W (0.96, s=0.02) was significantly higher RER compared to 0W
(0.72, s=0.02), where the 95% CI of the mean difference between 180W and 0W was from
0.2 to 0.28. RER at 180W was also significantly higher compared to 60W (0.74, s=0.01),
where the 95% CI of the mean difference between 180W and 60W was from 0.16 to 0.3.
However there was not a significant difference (P>0.05) of RER between 60W and 0W (95%
CI of mean difference=-0.34 to 0.06).
Energy Expenditure: There was a significant effect of workload on energy expenditure
(F1.10, 4.40=3994.53, P<0.001). There was a significantly higher energy expenditure at 60W
(49.16 kJ/min, s=2.04) compared to 0W (9.24 kJ/min, s=1.05), where the 95% CI of the mean
difference between 60W and 0W was from 37.94 to 41.9 kJ/min. Energy expenditure at
180W (81.44 kJ/min, s=1.05)was significantly higher compared to energy expenditure at 0W,
where the 95% CI of the mean difference between 180W and 0W was between 69.45 to 74.95
kJ/min. Lastly the was a significantly higher energy expenditure at 180W compared to 60W,
where the 95% CI of the mean difference between 180W and 60W was from 27.89 to 36.68
kJ/min.
4. 641817
Table 1. The mean ± S.D for CHO oxidation (g/min), fat oxidation (g/min), respiratory exchange
ratio and energy expenditure (kJ/min) which was measured at an exercise intensity 0W, 60W and
180W.
Power (W) CHO Oxidation
(g/min)
Fat Oxidation
(g/min)
RER Energy
Expenditure
(kJ/min)
0 0 0.2 ± 0 0.72 ± 0.01 9.3 ± 1.1
60 0.3 ± 0.1 1.1 ± 0 0.74 ± 0.01 49.2 ± 1.8
180 4.2 ± 0.3 0.3 ± 0.1 0.96 ± 0.02 81.4 ± 1.0
Figure 1: The mean ± standard deviation of carbohydrate oxidation (g/min) whilst at rest and
exercising at an intensity of 60W and 180W. There is a directly proportional relationship between
exercise intensity and carbohydrate oxidation. When exercise intensity increases the carbohydrate
oxidation rate increases. Carbohydrate oxidation was at its highest at high intensity (180W) at a rate of
4.2 g/min compared to rest (0W) and moderate (60W) intensity. There was an increase in carbohydrate
oxidation between rest (0.03 g/min) and moderate intensity (0.3 g/min) however by a small difference
(0.27 g/min)
0
0.5
1
1.5
Rest 60 180
FatOxidation(g/min)
Power (W)
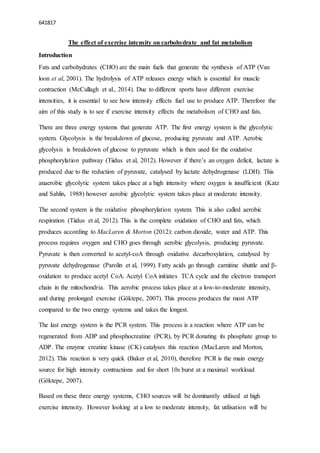
Figure 2: The mean ± standard deviation of fat oxidation (g/min), measured at rest and at an exercising
intensity of 60W and 180W. Figure 2 shows that moderate intensity (60W) had the highest mean fat
oxidation (1.1 g/min) compared to other two intensities. There was not much difference in fat oxidation
between high intensity (0.3 g/min) and at rest (0.2 g/min), only by a small difference of 0.1 g/min.
0.00
1.00
2.00
3.00
4.00
5.00
Rest 60 180
CHOoxidation(g/min)
Power (W)
5. 641817
Figure 4: The mean ± standard deviation of energy expenditure (kJ/min), measured at rest and at
exercise intensities of 60W and 180W. Figure 4 shows that there is a directly proportional relationship
between exercise intensity and energy expenditure. At high intensity (81.4 kJ/min), there was a larger
energy expenditure compared to rest (9.3 g/min) and moderate (49.2 g/min) intensity. Energy
expenditure rate almost doubles as intensity increases between moderate and high intensity.
0
10
20
30
40
50
60
70
80
90
Rest 60 180
EnergyExpenditure(kJ/min)
Power (W)
0.7
0.8
0.9
1
Rest 60 180
RespiratoryExchangeRatio
Power (W)
Figure 3: The mean ± SD of RER, measured at rest, and at an intensity of 60W and 180W. There is a
direct proportional relationship between exercise intensity and RER. So when exercise intensity
increases, the RER also increases. The highest mean RER was at high intensity (0.96) and was closer
to 1, however at rest (0.72) and 60W (0.74) was closer to 0.7.
6. 641817
Discussion
Looking at figure 1, there was direct proportional relationship between exercise intensity and
CHO oxidation, and was at its highest at high intensity (4.2±0.3 g/min). Also on figure 2, fat
oxidation was dominant at moderate intensity (1.1 g/min). The RER obtained (figure 3)
supports this, showing that at rest-to-moderate intensity, the mean RER was closer to 0.7
showing fats were more oxidised. Also at high intensity, mean RER was closer to 1 showing
that CHO was dominantly oxidised. Previous studies supports these findings (Romijn et al,
1993; van Loon et al., 2001) by finding that an increase in exercise intensity will increase
CHO reliance compared to fat and at a moderate intensity, fat oxidation was at its maximum.
However van Loon et al (2001) found that the proportion of CHO and fat energy expenditure
at moderate intensity were similar however our results show that fat sources are more utilised
than CHO at moderate intensity. Energy expenditure (figure 4) does increase as exercise
intensity increases however other fuel sources such as protein and ketone bodies should be
taken into consideration as they can also contribute to the overall energy expenditure.
High intensity exercise involves a large power output, therefore large amounts of ATP is
needed at a quicker rate (Gastin, 2001). According to Medbø and Tabata (1989), ATP stores
are limited therefore rate of ATP synthesis needs to be the same as ATP breakdown in order
to maintain ATP levels. The reactions PCR breakdown, glycogenolysis and anaerobic
glycolysis will maintain ATP levels due to its rapid production of ATP (Howlett et al, 1999).
Therefore metabolism of CHO will be essential for high intensity exercise (figure 1).
According to Spencer & Gastin (2001), there was a higher anaerobic contribution at high
intensity. Therefore anaerobic glycolysis is performed, due to rapid depletion of PCR in order
to maintain ATP levels, causing an increase in lactate accumulation (Maughan & Gleeson,
2010). Lactate accumulation is due to the reduction of PDH activity due to increase in [H+],
and accumulation of ADP, Pi and pyruvate therefore activating the near-equilibrium enzyme
LDH (Howlett et al, 1999). PDH is essential for the decarboxylation of pyruvate (Howlett et
al, 1998) into acetyl CoA which initiates the TCA cycle and electron transport chain
(MacLaren & Morton, 2012). However a small proportion of CHO oxidation will go through
oxidative phosphorylation. Two key non-equilibrium enzymes that also regulates CHO
oxidation are glycogen phosphorylase (glycogenolysis) and phosphofructokinase (PFK)
(phosphorylation of fructose-6-phosphate). Hormones (e.g. catecholamines) and allosteric
factors can affect the activity of these enzymes, effecting the regulation of CHO utilisation
(Watt et al, 2001)
7. 641817
Fat oxidation goes through different processes compared to CHO, and fat oxidation produces
the most ATP (palmitate =130 ATP) which is sufficient for the balance of ATP synthesis and
breakdown. According to Romijn et al (1993), fat oxidation was at its highest at moderate
intensity (65% Wmax) which is similar to figure 2. Fat oxidation is low at high intensity
because the increase in lactate production causes a counter effect on lipolysis (Brouns & van
der Vusse, 1998). Also Van Loon et al (2001) assumed that this reduction was due to the
down regulation of carnitine palmitoyltransferase (CPT-1), caused by low availability of
carnitine and the reduction in pH. There was also less CHO oxidation (figure 1) at moderate
intensity due to an increase in citrate and acetyl CoA concentration in fat oxidation, causing a
down-regulation of CHO metabolism due to inhibition of PFK and PDH (Dyck et al, 1993),
therefore fat oxidation will be dominant at low-to-moderate intensity which increases fat
utilisation. The increase in citrate and acetyl CoA will cause an increase the activation of the
TCA cycle in the mitochondria. The activation of enzymes adipose triglyceride lipase and
hormone sensitive lipase is essential in lipolysis to produce free fatty acids (FFA) for the
carnitine shuttle (Maughan & Gleeson, 2010). The increase in acetyl CoA production found
by Dyck et al (1993) was due to increases in muscle acetyl carnitine, which is essential for
the transfer of fatty acyl CoA from the cytosol into the mitochondrial matrix, catalysed by
CPT-1 and CPT-2 (Kunau et al, 1995). Then the process β-oxidation will produce acetyl CoA
which will also initiate the TCA cycle and the electron transport chain. Based on these
sources, at moderate intensity, fat oxidation will reduce carbohydrate oxidation which
supports results obtained on figures 1 & 2.
In the study, there are limitations which will reduce internal validity. Firstly the participants
will have different glucose and FFA content in the blood due to different eating status which
can affect the overall rate and total fuel metabolism making results less valid. Also training
status of the participants can affect the proportion of fuel utilisation. Future research can
involve the effect of gender difference and exercise intensity on fuel utilisation. Also look at
the energy expenditure contribution of other fuel sources such as amino acids and ketone
bodies. Lastly look at hormone levels (insulin and catecholamine’s) and how they affect fuel
utilisation at different exercise intensities. Based on my hypothesis, the observational
outcomes of the study supports hypothesis, that exercise intensity does effect fuel utilisation.
So at high intensity, CHO utilisation is dominant to fat utilisation, however at low-to-
moderate intensity, fat utilisation is more dominant that CHO utilisation.
8. 641817
1. Van Loon, L.J.C., Greenhaff, P.L., Constantin-Teodosiu, D., Saris W.H.M.,
Wagenmakers, A.J.M. (2001). The effects of increasing exercise intensity on muscle
fuel utilisation in humans. Journal of Physiology, 536.1, 295-304.
2. McCullagh, M., Saunders, M.G., Voth, G.A. (2014). Unraveling the mystery of ATP
hydrolysis in actin filaments. Journal of the American Chemical Society, 136, 13053-
13058.
3. Tiidus, P.M., Tupling, A.R., Houston, M.E. (2012). Biochemistry Primer for Exercise
Science. Leeds: Human Kinetics.
4. Katz, A. & Sahlin, K. (1988). Regulation of lactic acid production during exercise.
Journal of Applied Physiology, 65(2), 509-518.
5. MacLaren, D. & Morton, J. (2012). Biochemistry for sport and exercise metabolism.
Oxford: Wiley-Blackwell.
6. Parolin, M.L., Chesley, A., Matsos, M.P., Spreit, L.L., Jones, N.L. & Heigenhauser,
G.J.F. (1999). Regulation of skeletal muscle glycogen phosphorylase and PDH during
maximal intermittent exercise. Am. J. Physiol. 277, E890-E900.
7. Göketepe, A.S. (2007). Energy Systems in Sport. NATO Science for Peace and
Security Series - E: Human and Societal Dynamics, 31, 24-31.
8. Baker, J.S., McCormick, M.C., & Robergs, R.A. (2010). Interaction among Skeletal
Muscle Metabolic Energy Systems during Intense Exercise. Journal of Nutrition and
Metabolism, page 1-13.
9. Romijn, J.A., Coyle, E.F., Sidossis, L.S., Gastaldelli, A., Horowitz, J.F., Endert, E. et
al. (1993). Regulation of edogenous fat and carbohydrate metabolism in relation to
exercise intensity and duration. Am. J. Physiol, 265 (Endocrinol. Metab. 28): E380-
E391.
10. Gastin, P.B. (2001). Energy system interaction and relative contribution during
maximal exercise. Sports Medicine, 31 (10), 725-741.
11. Medbø, J.I. & Tabata, I. (1989). Relative importance of aerobic and anaerobic energy
release during short-lasting exhausting bicycle exercise. J. Appl. Physiol., 67(5),
1881-1886.
12. Howlett, R.A., Heigenhausser, G.J.F., Hultman, E., Hollidge-Horvat, M.G. & Spreit,
L.L. (1999). Effects of dichloroacetate infusion of human skeletal muscle metabolism
at the onset of exercise. Am. J.Physiol. 277(Endocrinal. Metab. 40), E18- E25.
13. Spencer, M.R. & Gastin, P.B. (2001). Energy system contribution during 200- to
1500-m running in highly trained athletes. Med. Sci. Sports Exerc., 33(1), 157-162.
9. 641817
14. Maughan, R. & Gleeson, M. (2010). The Biochemical Basis of Sports Performance.
Oxford: Oxford University Press.
15. Howlett, R.A., Parolin, M.L., Dyck, D.J., Hultman, E., Jones, N.L, Heigenhauser,
G.J.F. et al. (1998). Regulation of skeletal muscle glycogen phosphorylase and PDH
at varying power outputs. Am. J. Physiol., 275(Regulatory Integrative Comp. Physiol.
44), R418- R425.
16. Watt, M.J., Howlett, K.F., Febbraio, M.A, Spreit, L.L., & Hargreaves, M. (2001).
Adrenaline increases muscle glycogenolysis, PDH activation and carbohydrate
oxidation during moderate exercise in humans. J. Physiol. (London)., 534: 269-278.
17. Brouns, F. & van der Vusse, G.J. (1998). Utilisation of lipids during exercise of
human subjects: metabolic and dietary constraints. British Journal of Nutrition, 79,
117-128.
18. Dyck, D.J., Putman, C.T., Heigenhauser, G.J.F., Hultman, E., & Spreit, L.L. (1993).
Regulation of Fat-Carbohydrate Interaction in Skeletal-Muscle during Intense Aerobic
Cycling. American Journal of Physiology, 265(6), E852-E859.
19. Kunau, W.H., Dommes, V., & Schulz, H. (1995). Β-oxidation of fatty acids in
mitochondria, peroxisomes, and bacteria: a century of continued progress. Prog. Lipid
Res., 34(4), 267-342.