Project Risk Assessment Worked Example
•
5 likes•8,838 views

A simple to follow storyboard showing how to perform a structured assessment of project risks, to enable a comparative analysis of a collection of project risks, to inform decision making and risk management planning, following assessment. 'how to' storyboard containing clear guidance, tips and instruction.

Recommended
Recommended
More Related Content
Recently uploaded
Recently uploaded (17)
Featured
Featured (20)
Project Risk Assessment Worked Example
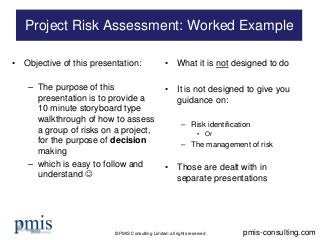
- 1. © PMIS Consulting Limited: all rights reserved • Objective of this presentation: – The purpose of this presentation is to provide a 10 minute storyboard type walkthrough of how to assess a group of risks on a project, for the purpose of decision making – which is easy to follow and understand • What it is not designed to do • It is not designed to give you guidance on: – Risk identification • Or – The management of risk • Those are dealt with in separate presentations Project Risk Assessment: Worked Example pmis-consulting.com
- 2. © PMIS Consulting Limited: all rights reserved • This presentation assumes you and your team have identified a series of risks, and now you need to assess them, and use this process and the information it produces to help you make decisions, such as: – Which risks require action – How to use Assessment to help prioritise actions Project Risk Assessment: Worked Example pmis-consulting.com H M L Probability 20% 40% Impact H M L 1 9 4 3 level schema: (Low = 1, Med = 2, High = 3) also 5 level schema.
- 3. © PMIS Consulting Limited: all rights reserved • It examines and assesses both the probability of occurrence of each risk, together with the impact of each risk if it occurs. • Using common values (e.g. H/M/L) (or thresholds) can provide each risk a score, allowing a comparative analysis of risks across a whole project. Project Risk Assessment: Worked Example pmis-consulting.com H M L Probability 20% 40% Impact H M L 1 9 4 3 level schema: (Low = 1, Med = 2, High = 3) also 5 level schema.
- 4. © PMIS Consulting Limited: all rights reserved • Before we can assess the risks we must: – Decide if we are going to assess just overall impact or assess impact on cost, schedule and performance (of our end product, aka Technical) separately – If we are doing the latter, we must define values for L/M/H for each of these, e.g. for schedule • E.g. L=<1 week, M=< 1 month, and H=>1 month – Then we do the same for cost etc. Project Risk Assessment: Worked Example pmis-consulting.com H M L Probability 20% 40% Impact H M L 1 9 4 So, what do we have to do? 3 level schema: (Low = 1, Med = 2, High = 3) also 5 level schema.
- 5. © PMIS Consulting Limited: all rights reserved • N.B: Impact Values – Despite it seeming logical, percentages do not work for cost impact – actual ‘threshold’ values must be agreed per project, sometimes even with the key stakeholders – For probabilities, people often start out with percentages way to high for probability, e.g. high > 80% - this is far too high - a probability of greater than 1 in 2 (50%) chance of occurring is a high risk item Project Risk Assessment: Worked Example pmis-consulting.com H M L Probability 20% 40% Impact H M L 1 9 4 Tips on Impact Values / Ranges 3 level schema: (Low = 1, Med = 2, High = 3) also 5 level schema.
- 6. © PMIS Consulting Limited: all rights reserved Example Thresholds: pmis-consulting.com Impact 1 2 3 4 5 Very Low Low Moderate High Very High Objective Time Thresholds Less than 1 week Up to 2 weeks Up to 4 weeks 5-10 weeks 11 weeks and above Cost Thresholds $ up to 100K (in 000s) $ up to 200K (in 000s) $ up to 500K (in 000s) $ up to 1M $ >1M Quality No safety issues, C, O, M deficiencies approved by project team No safety issues, C, O, M deficiencies require District management approval Quality may be made acceptable through mitigation or agreement (i.e. Fact Sheet) Quality does not meet one or all of the following Safety, C, O, & M Probability of occurrence 1-9 % 10-19% 20-39% 40-59% 60-99%
- 7. © PMIS Consulting Limited: all rights reserved • Risk Score – When we go through the assessment of individual risks and allocate them a value for probability and impact, we can translate this at the same time into a risk score, e.g.: • Low = 1 • Med = 2 • High = 3 – Therefore: • H/H = 3 * 3 =9 • H/L = 3 * 1 = 3, etc. – If we use C/S & T impact values, we multiply their average by the probability Project Risk Assessment: Worked Example pmis-consulting.com H M L Probability 20% 40% Impact H M L 1 9 4 Producing the risk ‘score’ 3 level schema: (Low = 1, Med = 2, High = 3) also 5 level schema.
- 8. © PMIS Consulting Limited: all rights reserved • Risk Score – The risk score is useful, but must never be used on its own as an absolute driver of the need for actions etc. following assessment – in other words it is simply wrong to write a process that says ‘accept’ all risks with a risk score less than ….. this is taking process driven management far to far and will result in important risks being ignored Project Risk Assessment: Worked Example pmis-consulting.com H M L Probability 20% 40% Impact H M L 1 9 4 How not to use the risk ‘score’ 3 level schema: (Low = 1, Med = 2, High = 3) also 5 level schema.
- 9. © PMIS Consulting Limited: all rights reserved • Risk Score – Developing the risk score itself should be a team task – no one person can do this. – Developing the score allows the team to better understand risk, which is a challenging task in itself – This then allows much better informed, structured and successful decision making and actions to follow this phase of the overall project risk management process Project Risk Assessment: Worked Example pmis-consulting.com H M L Probability 20% 40% Impact H M L 1 9 4 How to use the risk ‘score’ 3 level schema: (Low = 1, Med = 2, High = 3) also 5 level schema.
- 10. © PMIS Consulting Limited: all rights reserved • Please feel free to share this presentation or embed this presentation in your website and respect our Copyright at all times. • Thank you ! • Please click on the link below for more information or training on this topic. Thank you http://pmis-consulting.com/articles/project-risk-management/ H M L Probability 20% 40% Impact H M L 1 9 4 3 level schema: (Low = 1, Med = 2, High = 3) also 5 level schema.