1. 1
8. Clustering Algorithms. K- Means Algorithms .EM Clustering
Clustering Algorithms
Clustering is an unsupervised machine learning technique used for data modeling. As
compared with the supervised learning methodology in unsupervised learning there is no
indication regarding the class to which an item belongs to. This means that for a data
representation there is no such thing as target class or variable. From this point of view all
features that describe an instance have equal importance. The first consequence of this
approach is that the unsupervised modeling does not have as goal prediction ( e.g.,
classification for nominal or discrete values or regression for continuous real- valued
features ) of values for the target feature given the values of all other features. The main
task of unsupervised algorithms is to determine patterns in data. The main goal is to
determine some structure within input dataset.
There are many applications of clustering: market segmentation, social network
analysis, computing clusters,galaxy formation, on-line educational environments etc.
The main goal of clustering algorithms is to group a set of items into subset or
clusters. The obtained clustersshould coherent internally, but as different as possible from
each other. The clustering process is considered successful when it discovers subset of items
that aare as similar as possible and at the same time the items from one cluster should be as
dissimilar as possible from items in all other clusters.
The different flavors of clustering algorithms need to take into consideration the data
types of the features representing the items, the need for crisp or overlapping clusters, the
hierarchical and flat representations or the access method to data. For crisp clustering each
item may belong to only one cluster. This is hard constrained as compared to soft computing
paradigms where an item may belong simultaneously to many clusters. In hierarchical
clustering the output presents a “parent-child relation” between clusters as in classical tree
data structures as compared to flat clustering where there is no relation between obtained
clusters. The acces method to data may be full or incremental. In full access mode all the
data is available and is processed as compared to incremental learning ( or on-line learning)
when the algorithm builds the clusters with each instance that is available.
The classical examples of clustering algorithms are k-Means which is flat crisp
clustering, EM which is also flat crisp but for which is flat soft clustering and hierarchical
clustering which is crisp but non-flat.
From another perspective the algorithms may also vary by linkage method and
computational efficiency and, of course, measure of similarity.
Here are the mostly used similarity measures.
2. 2
Euclidian distance :
Square Euclidian distance :
Minkowski distance:
Manhattan distance:
Cosine similarity :
Hausdorff distance: H (x, y)=max( h(x, y), h(x, y) ) where , h(x,y) = max min ||a - b||
K- Means Algorithms
K-Means is perhaps the most well-known clustering algorithm and is among the top
ten data mining algorithms. The key inputs to a K-Means clustering algorithm ( beside the
data itself) are the number of clusters and the distance/similarity measure. The basic
approach of K-Means assumes that the data analyst knows from advance the number of
clusters that he wants to obtain from input dataset. Of course, there are also standard
methodologies for determining the optimal number of clusters that produces the highet
quality of cluster distribution but this is an issue that need a proper data analysis procedure.
The second input represents the distance measure and is closely related to the defined
distance between analyzed items. The most used functions is normalized Euclidian distance
but other distances such as squared Euclidian, Minkowski, Manhattan or previously
presented cosine similarity. These distances are well suited for items defined by a set of real
values feature vectors. In the situation when the items have other type ( e.g. images,
soundes, etc.) custom similarity function need to be used in the clustering process.
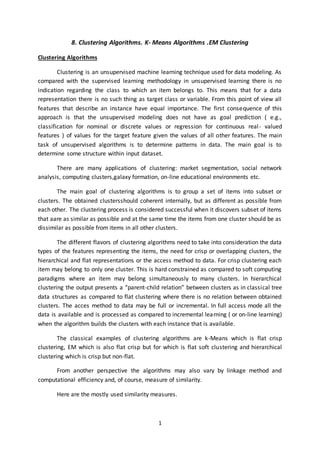
Fig 1. Sample output of a clustering process
In above figure, the distance measure is Euclidian distance in the two-dimensional
(2D) plane. This measure suggests three different clusters in for the available data. In this
case each rhombus represents an item which is defined by two real valued features. If a
3. 3
vector representation is used in a document custering application the distance measures is
often normalized Euclidean distance or coine similarity. Still, different distance measures
give rise to different cluster distributions and is the task of the data analyst and the domain
knowledge person to actually specify the one which is obtains the most significant results.
Thus, the distance measure is an important means by which we can influence the outcome
of clustering.
In data analysis,K-Means clustering is a method of cluster analysis which aims to
partition n items into k clusters in which each itembelongs to the cluster with the nearest
mean. The K-Means algorithm take the input parmeter k, and partitions a set of n items into
k clusters so that the resulting intracluster similarity is high but the intercluster similarity is
low. Cluster intra and inter similarity may be seen as a cost function which guides the
algorithm towards the solution. The similarity is always measured in regard to mean value of
the items ( also known as centroid) in a cluster and can beintuitively be seen as the center of
gravity.
The k-Means algorithm proceeds iteratively. First, it randomly selects k of the items,
each of which initially represents a cluster mean or center. These are the initial centroids or
seeds of the clusters. For each of the remaining items, an item is asigned to the cluster to
which is most similar (i.e to the closest centroid), based on the distance beween the item
and the cluster mean.Once all the items have been assigned to corresponding centroids a
new centroid needs to be computed for each cluster.The new centroid represents the mean
among all current items from cluster. This process iterates until the criterion function
converges which happens when centroids do not change after their computation for two
consecutive runs. Intuitively, if items assignments to centroids determine the same centroids
it means that the assignment procedure should stop. Another option would be to check the
items instead to check the centroids. From this perspective, if items remain in the same
distribution ( i.e. „linked” to the same centroids) in two consecutive runs it means that the
clustering algorithm must stop.
The more formal description of the K-Means algorithm from the input- output is
presented below.
Input:
a) A set of items D = {d1 , ... , dN},
b) A desired number of clusters k
c) An objective function that evaluates the quality of clustering.
Output:
A function y : D ->{1, ... , k} that minimizes ( or, in other cases, maximizes) the
objective function. The function maps each item from D to on of the k clusters. In
most cases, it is required that function y to be surjective, that is ,that none of the k
clusters to remain empty after running the algorithm. The objective function is often
4. 4
defined in terms of similarity or distance between items. Below, we will see that the
aim in k-Means clustering is to minimize the average distance between items and
their centroids or, equivalently, to maximize the similarity between items and their
centroids.The pseudocode for the K-Means algorithm is presented below.
//D is the input dataset conataining the items x1,x2 ...xN
//k is the number of clusters that will be contained
procedureK-Means(D={x1 , ... , xN} , k){
(u1, ...,uk) <- initializeCentroids(D,k);
while (centroids are not the same){
//reassignment for loop
for n=1 to N {
//j is the index of cluster to wich instance xn is reassigned
j = argminj |ui - xN|;
Cj <- Cj U xj ;
}//end for
//centroids re-computation
for k=1 to K {
}//end for
}//end wile
return { u1, ...,uk }}
The algorithm start by initializing the centroids.Intuitively, the centroids are
recomputed as many times as they are distinct from the former ones.From this
perspectiv the number of re-computations of centroids is a critical issue since it
involves all the items for distance calculation s and reassignement. The simple
solution may be to randomly pick k items as initial centroids or just pick the first k
items.Once the centroids are initialized a while loop may start.The condition for the
body of the loop is that new consecutive iterations the centroids remain the same
than the while loop must end.
Within the while loop there are two main actions that are performed.One
regards the assignment of items to the current clusters.This is performed by a for
loop that iterates through all the items and assigning them to the closest
centroid.The second action performs centroids re-computation.This is performed also
by a loop that iterates to each cluster computing its centorid.In this way a new setof
5. 5
centroids is obtained.This set of centroids is compared with the former one to see if
another running of the while loop is needed. Finall y, the centroids are returned as
output.
The complexity of k-means is O (n *K *I *d). Where n is the number of points,
k the number of clusters, l the number of iterations and d the number of attributes.
This algorithm is easily parallelized.
EM Clustering
The general purpose is to detect clusters within an input dataset and assign
each item to one of the clusters. A typical example application is market
segmentation.In this type of analysis a possibly large number of customer behavior
related variables are gathered for possibily a large sample of customers.The behavior
related variables are computed according with the activity performed by users.The
same type of analysis is also suited for on-line educational environments with the
difference that items are now students and variables represent ativity indicators. The
purpose of the clustering is to detect „market segments”, i.e., groups of items that
are somehow more similar to each other when compared to respondents that
„belong to” other clusters.
The EM (expectation maximization) algorithm extends and generalizes the basic
approach of K-Means in two important ways :
1.instead of assigning items to clusters in order to maximize the difference in means
for continous variables, the EM clustering algorithm computes probabilities of cluster
membership based on one or more probability distributions.The goal of the
clustering algorihm is therefor to maximize the overall probability or likelihood of the
data items, given the clusters.
2.unlike the classic implementaion of k_means clustering, the general EM algorithm
can be applied to both continuous and categorical variables.