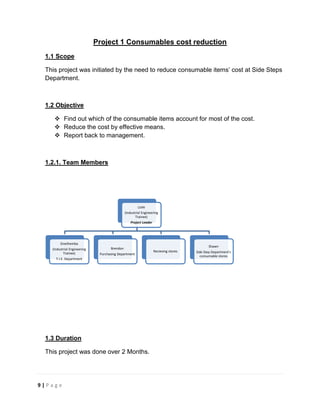
1. Sinethemba
(Industrial Engineering
T.I.E. Department
9 | P a g e
Project 1 Consumables cost reduction
1.1 Scope
This project was initiated by the need to reduce consumable items’ cost at Side Steps
Department.
1.2 Objective
Find out which of the consumable items account for most of the cost.
Reduce the cost by effective means.
Report back to management.
1.2.1. Team Members
Trainee)
1.3 Duration
Lizile
(Industrial Engineering
Trainee)
Project Leader
Brendon
Purchasing Department
This project was done over 2 Months.
Recieving stores
Shawn
Side Step Department's
consumable stores
2. 1.4 Methodology
List all consumables used at the department.
Get hold of information regarding frequency of usage.
Obtain the cost of each consumable item.
Multiply the monthly usage of each item by its relative cost.
Record this information on a tabular format.
Arrange all items in a descending manner with reference to their cost.
Compile a frequency column on the above mentioned table.
Compile a cumulative frequency column on the on the above mentioned table.
Use the tabular data to draw up a bar graph that depicts the tabular
information.
Draw a dotted line that cut the Y-axis at 80%.
1.5 Analysis
Calculating the amount of each used per month.
Average daily usage of each item is taken and since the company operates 20 days a month
so the monthly usage is calculated as follows: e.g. taken from Table 1a Gloves (wool) 25
Pairs×20 days = 500 pairs/month.
Calculate the monthly cost of each item as follows: e.g. taken from Table 1a; Gloves
(wool) 500 pairs/month ×R1.60 = R800.
10 | P a g e
3. Table 1.5 a
Consumables Daily Usage
11 | P a g e
Monthly
Usage
Unit Cost Of
Items
Monthly
Cost Of
Items
Gloves (wool) 25 Pairs 500 Pairs R1.60 each R 800
Gloves (plastic) 1 Pair 20 Pairs R8.95 each R 179
Spark Spray 6 Cans 120 Cans
R34.90 /
400ml R 4,188
Silicone Spray 2 Cans 40 Cans
R24.50/
400ml R 980
Windowlene 5 Bottles 100 Bottles
R34.90/
750ml R 3,490
Paraffin 750ml 15 ℓ R9.75/ℓ R 146
Sanding Disks 4 Disks 80 Disks R8.50 each R 680
Tabulate all consumable items in descending order; as shown below on table 1b.
Table 1.5 b
Cumulative Percentage
Cutoff: 80%
# Consumables Cost (Rands) Cumulative%
1 Spark Spray 4188 40.0%
2 Windowlene 3490 73.4%
3 Silicone Spray 980 82.7%
4 Gloves (wool) 800 90.4%
5 Sanding Disks 680 96.9%
6 Gloves (plastics) 179 98.6%
7 Paraffin 146.25 100.0%
Develop a bar graph of the consumables in descending order.
On the same chart plot consumables on x- axis and cumulative percentage on y-axis
Join the points marked on the chart to form a curve.
4. Graph 1.5
Spark Spray
4500
4000
3500
3000
2500
2000
1500
1000
500
[Consumables Pareto chart]
The first 3 Consumables cover 80.84% of the Total Cost (Rands).
12 | P a g e
Windowlene
Silicone Spray
Gloves (wool)
Sanding Disks
Gloves (plastics)
Paraffin
100%
80%
60%
40%
20%
0%
0
Cumulative %
Cost (Rands)
Consumables
Vital Few Useful Many Cumulative% Cut Off % [42]
5. 1.6 Summary
The first 3 consumables were found to be major contributors to the total cost of all
consumables so after studies had been done and research, alternative cheaper
products were then used instead and careful consideration was taken into account
when choosing these alternative consumables as to not jeopardize the quality
standards.
The cost savings are as follows:
13 | P a g e
Current Proposed
Product Spark Spray
Anti-corit G70
Unit price R34.90/400mℓ
R29.83/ ℓ
Monthly price R4188/48ℓ R1431.84/48ℓ
After implementation of proposal there will be a 65.8% saving
Current Proposed
Product Windowlene Window cleaner
Unit price R34.90/750mℓ R141.25/25ℓ
Monthly price R3490/75ℓ R423.75/75ℓ
After implementation of proposal there will be a 87.9% saving
Current Proposed
Product Silicone spray NSD
Unit price R24.50/400mℓ R438.41/25ℓ
Monthly price R980/16ℓ R280.58/16ℓ
After implementation of proposal there will be a 71.4% saving