Blue Zone Impact Report at 100 Days
•
2 likes•284 views

Results of the application of a Blue Zone Corporate Lifestyle at 100 days designed to improve health, happiness, productivity, creativity and encourage innovation.

Recommended
More Related Content
Recently uploaded
Recently uploaded (20)
Featured
Featured (20)
Blue Zone Impact Report at 100 Days
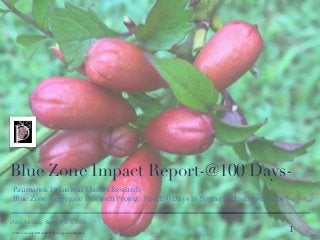
- 1. Date: Monday September 5, 2016 Blue Zone Impact Report-@100 Days- Paumanok Industrial Market Research Blue Zone Aggregate Research Project: First 100 Days in Spring and Summer 2016 ©2016 Paumanok IMR and Blue Zone Aggregate Research 1
- 2. Background and Scope ✤ Paumanok HQ Implemented Phase I of A Blue Zone Plan March 20th 2016. Food and worker health focus only. ✤ Blue Zone Phase I: Only eat foods from the five regions of the world identified as a Blue Zone by National Geographic Magazine Special Edition (Display Until 10/21/16). ✤ Medical Results by LabCorp.® ©2016 Paumanok IMR and Blue Zone Aggregate Research 2
- 3. Blue Zone Impact Report-@100 Days-Triglycerides 0 125 250 375 500 May 20 2016 September 1, 2016 Triglycerides -62% ©2016 Paumanok IMR and Blue Zone Aggregate Research 3
- 4. Blue Zone Impact Report-@100 Days- Cholesterol 0 75 150 225 300 May 20 2016 September 1, 2016 Cholesterol -23% ©2016 Paumanok IMR and Blue Zone Aggregate Research 4
- 5. Blue Zone Impact Report-@100 Days-Weight 0 75 150 225 300 May 20 2016 September 1, 2016 Weight in Pounds -9.5% ©2016 Paumanok IMR and Blue Zone Aggregate Research 5
- 6. FiveYearTrend Line- Benchmarking ©2016 Paumanok IMR and Blue Zone Aggregate Research 6
- 7. Blue Zone Impact Report-@100 Days- Required Sleep 0 2.5 5 7.5 10 May 20 2016 September 1, 2016 Hours of Sleep Required in 24 Hour Cycle -30.0% ©2016 Paumanok IMR and Blue Zone Aggregate Research 7
- 8. Blue Zone Impact Report-@100 Days- Productivity 0 2.25 4.5 6.75 9 May 20 2016 September 1, 2016 Productivity Level and Increase in ROI +28.0% ©2016 Paumanok IMR and Blue Zone Aggregate Research 8
- 9. Blue Zone Aggregate Research Phase II- Next 100 Days Relocation of The Corporate Office Creative Zone Development For more information contact info@paumanokgroup.com ©2016 Paumanok IMR and Blue Zone Aggregate Research 9