More Related Content
More from Malcolm Harrison
More from Malcolm Harrison (20)
Ch07
- 1. Decisions Facing Firms
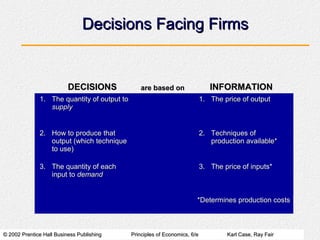
DECISIONS are based on INFORMATION
1. The quantity of output to 1. The price of output
supply
2. How to produce that 2. Techniques of
output (which technique production available*
to use)
3. The quantity of each 3. The price of inputs*
input to demand
*Determines production costs
© 2002 Prentice Hall Business Publishing Principles of Economics, 6/e Karl Case, Ray Fair
- 2. Costs in the Short Run
• The short run is a period of time
for which two conditions hold:
1. The firm is operating under a fixed
scale (fixed factor) of production, and
2. Firms can neither enter nor exit an
industry.
• In the short run, all firms have
costs that they must bear
regardless of their output. These
kinds of costs are called fixed
costs.
© 2002 Prentice Hall Business Publishing Principles of Economics, 6/e Karl Case, Ray Fair
- 3. Costs in the Short Run
• Fixed cost is any cost that does not
depend on the firm’s level of output. These
costs are incurred even if the firm is
producing nothing.
• Variable cost is a cost that depends on
the level of production chosen.
TC = TFC + TVC
Total Cost = Total Fixed + Total Variable
Cost Cost
© 2002 Prentice Hall Business Publishing Principles of Economics, 6/e Karl Case, Ray Fair
- 4. Fixed Costs
• Firms have no control over fixed
costs in the short run. For this
reason, fixed costs are sometimes
called sunk costs.
• Average fixed cost (AFC) is the
total fixed cost (TFC) divided by the
number of units of output (q):
TFC
AFC =
q
© 2002 Prentice Hall Business Publishing Principles of Economics, 6/e Karl Case, Ray Fair
- 5. Short-Run Fixed Cost (Total and
Average) of a Hypothetical Firm
(1) (2) (3)
q TFC AFC (TFC/q)
0 $1,000 $ −−
1 1,000 1,000
2 1,000 500
3 1,000 333
4 1,000 250
5 1,000 200
• AFC falls as output
rises; a phenomenon
sometimes called
spreading overhead.
© 2002 Prentice Hall Business Publishing Principles of Economics, 6/e Karl Case, Ray Fair
- 6. Variable Costs
• The total variable cost curve is a graph
that shows the relationship between total
variable cost and the level of a firm’s output.
• The total variable
cost is derived from
production
requirements and
input prices.
© 2002 Prentice Hall Business Publishing Principles of Economics, 6/e Karl Case, Ray Fair
- 7. Derivation of Total Variable Cost Schedule
from Technology and Factor Prices
UNITS OF
INPUT REQUIRED
(PRODUCTION FUNCTION)
TOTAL VARIABLE
COST ASSUMING
USING PK = $2, PL = $1
PRODUCT TECHNIQUE K L TVC = (K x PK) + (L x PL)
$10
1 Units of A 4 4 (4 x $2) + (4 x $1) = $12
output B 2 6 (2 x $2) + (6 x $1) =
$18
2 Units of A 7 6 (7 x $2) + (6 x $1) = $20
$24
output B 4 10 (4 x $2) + (10 x $1) =
3 Units of A 9 6 (9 x $2) + (6 x $1) =
• The
output B 6 curve14
shows the$2) + (14 x $1) = $26
The total variable cost curve shows the cost of
variable cost (6 x cost of
production using the best available technique at
each output level, given current factor prices.
© 2002 Prentice Hall Business Publishing Principles of Economics, 6/e Karl Case, Ray Fair
- 8. Marginal Cost
• Marginal cost (MC) is the increase
in total cost that results from
producing one more unit of output.
• Marginal cost reflects changes in
variable costs.
∆TC ∆TFC ∆TVC
M C = = +
∆Q ∆Q ∆Q
© 2002 Prentice Hall Business Publishing Principles of Economics, 6/e Karl Case, Ray Fair
- 9. Derivation of Marginal Cost from
Total Variable Cost
TOTAL VARIABLE COSTS MARGINAL COSTS
UNITS OF OUTPUT ($) ($)
0 0 0
1 10 10
2 18 8
3 24 6
• Marginal cost measures the additional
cost of inputs required to produce each
successive unit of output.
© 2002 Prentice Hall Business Publishing Principles of Economics, 6/e Karl Case, Ray Fair
- 10. The Shape of the Marginal Cost Curve
in the Short Run
• The fact that in the short run every firm is
constrained by some fixed input means
that:
1. The firm faces diminishing returns to variable
inputs, and
2. The firm has limited capacity to produce
output.
• As a firm approaches that capacity, it
becomes increasingly costly to produce
successively higher levels of output.
© 2002 Prentice Hall Business Publishing Principles of Economics, 6/e Karl Case, Ray Fair
- 11. The Shape of the Marginal Cost Curve
in the Short Run
• Marginal costs ultimately increase with
output in the short run.
© 2002 Prentice Hall Business Publishing Principles of Economics, 6/e Karl Case, Ray Fair
- 12. Graphing Total Variable Costs and
Marginal Costs
• Total variable costs always
increase with output. The
marginal cost curve shows
how total variable cost
changes with single unit
increases in total output.
• Below 100 units of output,
TVC increases at a
decreasing rate. Beyond
100 units of output, TVC
increases at an increasing
rate.
© 2002 Prentice Hall Business Publishing Principles of Economics, 6/e Karl Case, Ray Fair
- 13. Average Variable Cost
• Average variable cost (AVC) is the
total variable cost divided by the
number of units of output.
• Marginal cost is the cost of one
additional unit. Average variable
cost is the average variable cost per
unit of all the units being produced.
• Average variable cost follows
marginal cost, but lags behind.
© 2002 Prentice Hall Business Publishing Principles of Economics, 6/e Karl Case, Ray Fair
- 14. Relationship Between Average
Variable Cost and Marginal Cost
• When marginal cost is
below average cost,
average cost is declining.
• When marginal cost is
above average cost,
average cost is increasing.
• Rising marginal cost
intersects average variable
• At 200 units of output, AVC is cost at the minimum point
minimum, and MC = AVC. of AVC.
© 2002 Prentice Hall Business Publishing Principles of Economics, 6/e Karl Case, Ray Fair
- 15. Short-Run Costs of a Hypothetical Firm
(3) (4) (6) (7) (8)
(1) (2) MC AVC (5) TC AFC ATC
q TVC (∆ TVC) (TVC/q) TFC (TVC + TFC) (TFC/q) (TC/q or AFC + AVC)
0 $ 0 $ − $ − $ 1,000 $ 1,000 $ − $ −
1 10 10 10 1,000 1,010 1,000 1,010
2 18 8 9 1,000 1,018 500 509
3 24 6 8 1,000 1,024 333 341
4 32 8 8 1,000 1,032 250 258
5 42 10 8.4 1,000 1,042 200 208.4
− − − − − − − −
− − − − − − − −
− − − − − − − −
500 8,000 20 16 1,000 9,000 2 18
© 2002 Prentice Hall Business Publishing Principles of Economics, 6/e Karl Case, Ray Fair
- 16. Total Costs
• Adding TFC to TVC means
adding the same amount of
total fixed cost to every
level of total variable cost.
• Thus, the total cost curve
has the same shape as the
total variable cost curve; it
is simply higher by an
amount equal to TFC.
TC = TFC + TVC
© 2002 Prentice Hall Business Publishing Principles of Economics, 6/e Karl Case, Ray Fair
- 17. Average Total Cost
• Average total cost (ATC) is
total cost divided by the
number of units of output
(q).
ATC = AFC + AVC
TC TFC TVC
ATC = = +
q q q
• Because AFC falls with
output, an ever-declining
amount is added to AVC.
© 2002 Prentice Hall Business Publishing Principles of Economics, 6/e Karl Case, Ray Fair
- 18. Relationship Between Average Total
Cost and Marginal Cost
• If marginal cost is below
average total cost, average
total cost will decline
toward marginal cost.
• If marginal cost is above
average total cost, average
total cost will increase.
• Marginal cost intersects
average total cost and
average variable cost
curves at their minimum
points.
© 2002 Prentice Hall Business Publishing Principles of Economics, 6/e Karl Case, Ray Fair
- 19. Output Decisions: Revenues, Costs,
and Profit Maximization
• In the short run, a competitive firm faces a
demand curve that is simply a horizontal line at
the market equilibrium price.
© 2002 Prentice Hall Business Publishing Principles of Economics, 6/e Karl Case, Ray Fair
- 20. Total Revenue (TR) and
Marginal Revenue (MR)
• Total revenue (TR) is the total amount that a firm
takes in from the sale of its output.
TR = P × q
• Marginal revenue (MR) is the additional revenue
that a firm takes in when it increases output by
one additional unit.
• In perfect competition, P = MR.
∆TR P (∆q )
M R = = = P
∆q ∆q
© 2002 Prentice Hall Business Publishing Principles of Economics, 6/e Karl Case, Ray Fair
- 21. Comparing Costs and Revenues to
Maximize Profit
• The profit-maximizing level of output for all
firms is the output level where MR = MC.
• In perfect competition, MR = P, therefore,
the profit-maximizing perfectly competitive
firm will produce up to the point where the
price of its output is just equal to short-run
marginal cost.
• The key idea here is that firms will produce
as long as marginal revenue exceeds
marginal cost.
© 2002 Prentice Hall Business Publishing Principles of Economics, 6/e Karl Case, Ray Fair
- 22. Profit Analysis for a Simple Firm
(6) (7) (8)
(1) (2) (3) (4) (5) TR TC PROFIT
q TFC TVC MC P = MR (P x q) (TFC + TVC) (TR − TC)
0 $ 10 $ 0 $ − $ 15 $ 0 $ 10 $ -10
1 10 10 10 15 15 20 -5
2 10 15 5 15 30 25 5
3 10 20 5 15 45 30 15
4 10 30 10 15 60 40 20
5 10 50 20 15 75 60 15
6 10 80 30 15 90 90 0
© 2002 Prentice Hall Business Publishing Principles of Economics, 6/e Karl Case, Ray Fair
- 23. The Short-Run Supply Curve
• At any market price, the marginal cost curve shows the output level
that maximizes profit. Thus, the marginal cost curve of a perfectly
competitive profit-maximizing firm is the firm’s short-run supply curve.
© 2002 Prentice Hall Business Publishing Principles of Economics, 6/e Karl Case, Ray Fair