McKinsey Survey: Filipino consumer sentiment during the coronavirus crisis

Filipino consumers generally remained as optimistic in October as they were in April; however, optimism among lower-income groups declined significantly. As the government’s COVID-19 restrictions ease, Filipino consumers are cautiously resuming spending activity. While overall optimism remained the same from April to October, optimism in the lowest income group dropped significantly, while those in the highest income group increased. Optimism among 20- to 24-year-olds also declined. Additionally, approximately 50 percent of respondents believe their finances will be impacted for at least six more months, up from only about 10 percent last April. Overall decreases in spending are expected to soften after the pandemic, but most categories will likely see spending declines linger for the long term. These exhibits are based on survey data collected in the Philippines from April 17 to 20, and October 1 to 12, 2020.

Recommended
Recommended
More Related Content
What's hot
What's hot (20)
Similar to McKinsey Survey: Filipino consumer sentiment during the coronavirus crisis
Similar to McKinsey Survey: Filipino consumer sentiment during the coronavirus crisis (20)
More from McKinsey on Marketing & Sales
More from McKinsey on Marketing & Sales (20)
Recently uploaded
Recently uploaded (20)
McKinsey Survey: Filipino consumer sentiment during the coronavirus crisis
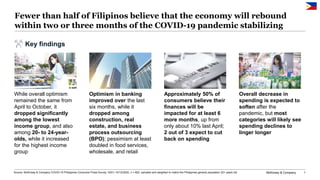
- 1. McKinsey & Company 1 Fewer than half of Filipinos believe that the economy will rebound within two or three months of the COVID-19 pandemic stabilizing Source: McKinsey & Company COVID-19 Philippines Consumer Pulse Survey 10/01–10/12/2020, n = 602, sampled and weighted to match the Philippines general population 20+ years old Key findings While overall optimism remained the same from April to October, it dropped significantly among the lowest income group, and also among 20- to 24-year- olds, while it increased for the highest income group Optimism in banking improved over the last six months, while it dropped among construction, real estate, and business process outsourcing (BPO); pessimism at least doubled in food services, wholesale, and retail Approximately 50% of consumers believe their finances will be impacted for at least 6 more months, up from only about 10% last April; 2 out of 3 expect to cut back on spending Overall decrease in spending is expected to soften after the pandemic, but most categories will likely see spending declines to linger longer
- 2. McKinsey & Company 2 Confidence in own country’s economic recovery after COVID-191 % of respondents 1 Q: How is your overall confidence level on economic conditions after the COVID-19 situation? Rated from 1 “very optimistic” to 6 “very pessimistic”; figures may not sum to 100% because of rounding. Source: McKinsey & Company COVID-19 Consumer Pulse Surveys Spain 9/21–29 UK 9/18–27 Italy 9/21–27 China 9/16–24 Brazil 9/21–25 France 9/21–27 9 10 8 17 20 28 17 37 26 35 42 31 49 32 38 38 45 52 51 66 47 60 53 47 62 42 58 58 53 28 20 17 17 14 12 11 7 4 39 US 9/18–24 S. Africa 9/18–29 Japan 9/22–28 India 9/18–27 Unsure: The economy will be impacted for 6–12 months or longer and will stagnate or show slow growth thereafter Pessimistic: COVID-19 will have lasting impact on the economy and show regression/ fall into lengthy recession Optimistic: The economy will rebound within 2–3 months and grow just as strong as or stronger than before COVID-19 The Philippines is more optimistic than European countries but less so than India, China, or Indonesia Indonesia 9/21–30 Germany 9/21–29 Philippines 10/1–12
- 3. McKinsey & Company Overall optimism among consumers did not change much between April and October 7 9 9 6 22 19 20 33 32 26 36 49 49 46 41 38 53 58 52 54 54 60 57 42 42 48 56 58 25 23 28 13 14 14 3 4 Confidence in own country’s economic recovery after-COVID-191 Percent of respondents Source: McKinsey & Company COVID-19 Consumer Pulse Surveys Mar 31– Apr 1 1 Q: How is your overall confidence level on economic conditions after the COVID-19 situation? Rated from 1 “very optimistic “to 6 “very pessimistic”; figures may not sum to 100% because of rounding. Apr 17-–20 Philippines March 20–23 Apr 8-–3 China March 21–24 Apr 2–5 Brazil Mar 21–22 Apr 2–5 Italy Unsure: The economy will be impacted for 6–12 months or longer and will stagnate or show slow growth thereafter Pessimistic: COVID- 19 will have a long lasting impact on the economy and show regression / fall into lengthy recession Optimistic: The economy will rebound within 2–3 months and grow just as strong or stronger than before COVID-19 Oct 1–12 Sept 16–24 Sept 21–25 Sept 21–27
- 4. McKinsey & Company 4 About half of Filipinos believe that the personal and financial impacts from COVID-19 will last well beyond the next six months 12% More than one year 41% 6% 11% 30% April 17 to 20 9% 22% 23% 22% 24% October 1 to 12 4–6 months 0–1 month 2–3 months 7–12 months 9% 7% 41% 31% 18% 10% 22% 6% 23% 26% 0–1 month October 1 to 12 3% April 17 to 20 5% No impact 2–3 months 4–6 months 7–12 months More than one year Adjustments to routines1 % of respondents Impact to personal/household finances2 % of respondents 1 Q: How long do you believe you need to adjust your routines, given the current COVID-19 situation, before things return back to normal in the Philippines (e.g., government lifts restrictions on events/travel)? Figures may not sum to 100% because of rounding. 2 Q: How long do you believe your personal/household finances will be impacted by the COVID-19 situation? Figures may not sum to 100% because of rounding. Source: McKinsey & Company COVID-19 Philippines Consumer Pulse Survey 4/17–4/20/2020, n = 639; 10/01–10/12/2020, n = 602, sampled and weighted to match the Philippines general population 20+ years old ~46% believe it will take 6+ months before routines can return to normal, with more people, up from only 17% last April ~50% believe their finances will be impacted for 6+ months by the COVID-19 pandemic, up from only ~10% last April
- 5. McKinsey & Company 5 Consumer perception is getting slightly better, with fewer people cutting back and more people going back to work, but a large portion remain unsure Overall sentiment in the Philippines1 % of respondents 1 Q: To what extent do you currently agree with following statements? Rated from 1 “strongly disagree” to 5 “strongly agree”; figures may not sum to 100% because of rounding. 88% 74% 63% 59% 58% 54% 53% 44% 8% 21% 24% 25% 36% 32% 33% 36% 13% 16% 7% 14% 14% 21% Given the economy and my personal finances, I have to be very careful how I spend my money My income has been negatively impacted by COVID-19 I am cutting back on my spending My ability to work has been reduced by COVID-19 Uncertainty about the economy is preventing me from making purchases or investments My ability to make financial ends meet has been negatively impacted by COVID-19 My job feels less secure because of COVID-19 My health or my family/friends’ health has been negatively affected by COVID-19 4% 5% Strongly agree / agree Somewhat disagree / agree Strongly disagree / disagree Source: McKinsey & Company COVID-19 Philippines Consumer Pulse Survey 4/17–4/20/2020, n = 639; 10/01–10/12/2020, n = 602, sampled and weighted to match the Philippines general population 20+ years old April 17–20 October 1–12 88% 66% 52% 54% 50% 49% 55% 43% 9% 28% 33% 30% 42% 38% 31% 36% 15% 16% 9% 13% 13% 22% 3% 5%
- 6. McKinsey & Company 6 Fewer people are now afraid to go outside for groceries, and more people are focusing on exercising and healthy eating Overall sentiment in the Philippines1 % of respondents 1 Q: To what extent do you currently agree with following statements? Rated from 1 “strongly disagree” to 5 “strongly agree”; figures may not sum to 100% because of rounding. 83% 80% 72% 53% 49% 34% 15% 15% 24% 36% 44% 48% 17% 3% I will consider grocery products that are more environmentally-friendly after COVID-19 I am focused on improving my immunity through more exercise and healthy eating My trust for my regular/primary grocery store has become stronger during the COVID-19 outbreak 4% I will care more about product safety after the COVID-19 situation 4% 11% I am afraid to go outside to shop for groceries now 7% I think the media coverage of COVID-19 is getting too sensational and creating more panic Strongly agree / agree Somewhat disagree / agree Strongly disagree / disagree Source: McKinsey & Company COVID-19 Philippines Consumer Pulse Survey 4/17–4/20/2020, n = 639; 10/01–10/12/2020, n = 602, sampled and weighted to match the Philippines general population 20+ years old April 17 to 20 October 1 to 12 86% 79% 71% 38% 48% 40% 12% 16% 26% 50% 43% 46% 12% 9% 14% 2% 5% 3%
- 7. McKinsey & Company 7 Anticipated spending after COVID-19 vs before2 % of respondents 31 35 83 30 39 67 68 51 15 44 69 54 66 57 52 73 81 74 15 51 45 7 55 48 13 10 22 65 34 22 26 17 21 17 13 8 11 58 Groceries Ready-made food from grocery Food: Restaurant, indoors Food: Delivery Food: Takeout Furnishings & appliances Apparel Jewelry & accessories -Personal-care services Entertainment at home Consumer electronics Out-of-home entertainment Fitness & wellness Gasoline Vehicle purchases International flights Hotel/resort stays Domestic flights Telecommunications Spending during COVID-19 vs before1 % of respondents Decrease Stay the same Increase 1 Q: How has your spending per month changed during the COVID-19 outbreak compared to before the COVID-19 outbreak for each of the below items? Figures may not sum to 100% because of rounding. 2 Q: For each of the following product/service options, how do you expect your spending per month to change after the COVID-19 outbreak compared to before the COVID-19 outbreak? Figures may not sum to 100% because of rounding. 3 Net behavior and net intent are calculated by subtracting the percent of respondents stating they expect to decrease spend from the percent of respondents stating they expect to increase spend. 4 Net inflow is calculated by subtracting the % of respondents stating they stopping spending on this category vs those that just started using during or after the outbreak. Net inflow4 -2% -14% -17% -3% -7% -22% -3% -8% -20% -29% -22% -2% -17% -30% -17% -19% -29% -25% 1% 21 30 53 32 31 45 51 44 21 36 49 43 48 36 37 53 56 55 16 49 42 32 47 47 28 18 27 49 36 30 36 31 37 25 32 24 31 48 Net inflow4 -1% -6% Source: McKinsey & Company COVID-19 Philippines Consumer Pulse Survey 10/01–10/12/2020, n = 602, sampled and weighted to match the Philippines general population 20+ years old Below -5% -5 to 5% Above 5% -5% -3% -9% -2% -4% -9% -13% -12% -3% -9% -16% -3% -7% -5% -12% -7% 2% Net behavior3 20% -28% -48% 43% 9% -75% 25% 9% -54% -58% -29% 50% -10% -47% -35% -60% -72% -63% -36% Net intent3 28% -17% -6% 13% -21% 15% 16% -18% -33% -17% 28% 0% -19% 32% -12% -21% -32% -23% 1% Overall decrease in spending is expected to soften after pandemic, but most categories will likely see spending declines linger Increase in spend likely to remain after pandemic Decrease in spend likely to linger longer after pandemic
- 8. McKinsey & Company 8 Consumption of grocery products increased except for alcoholic beverages, which is likely to suffer an even longer decline in spend after the pandemic 8 13 8 9 12 11 12 17 15 25 24 22 16 14 19 36 31 27 43 52 25 21 20 19 27 26 25 27 26 25 30 28 33 38 40 28 31 43 35 29 67 65 72 72 61 63 62 56 59 50 46 50 51 48 41 36 38 30 22 20 Fresh meat and seafood Eggs Packaged food Household care Rice, bread, pasta Healthcare Fresh food Personal care Household paper goods Frozen food Snacks Deli meats Dairy Food prepared in stores Bottled water Baby products Beverages Pet care Nonbeer alcoholic bev. Beer Stay the same Increase Decrease 1 Q: For each of the following typical grocery items, how did you or your family’s spending per month change during the COVID-19 outbreak compared to before the COVID-19 outbreak? Figures may not sum to 100% because of rounding. 2 Q: For each of the following typical grocery items, how would you expect you or your family’s spending per month to change after the COVID-19 outbreak compared to before the COVID-19 outbreak? 3 Net behavior and net intent are calculated by subtracting the percent of respondents stating they expect to decrease spend from the percent of respondents stating they expect to increase spend. 4 Net inflow is calculated by subtracting the % of respondents stating they stopping spending on this category vs those that just started using during or after the outbreak. 0% -1% -8% -1% -1% 0% -1% 0% 0% -1% -1% -1% -3% -4% -1% -5% Net Inflow4 Consumption during COVID-19 situation vs before,1 % of respondents who buy each item Anticipated consumption after COVID-19 situation vs before,2 % of respondents who buy each item -2% -8% Net Inflow4 Source: McKinsey & Company COVID-19 Philippines Consumer Pulse Survey 10/01–10/12/2020, n = 602, sampled and weighted to match the Philippines general population 20+ years old Below -5% -5 to 5% Above 5% 1% -2% 11 23 11 10 13 12 13 13 18 29 26 27 17 15 20 35 29 24 38 43 38 36 29 29 39 35 36 34 38 34 40 36 41 46 45 31 40 51 40 34 50 41 60 61 48 53 51 52 45 37 34 37 42 39 35 34 32 25 22 23 0% -1% -4% 0% 0% 0% 0% 0% 0% 0% 0% -2% -1% -1% -1% -2% 0% -4% 1% -2% 59% 3% -22% 52% 64% 62% 49% 52% 50% 39% 45% 25% 22% 28% 36% 0% Net Behavior3 34% -32% 21% 6% Net Intent3 39% 1% -15% 19% 49% 51% 34% 41% 38% 39% 27% 7% 7% 10% 26% -1% 24% -20% 16% 3%
- 9. McKinsey & Company 9 The shift in consumers’ preference toward grocery and food delivery/takeout could linger post-COVID-19 1 Q: How has your spending per month changed during the COVID-19 outbreak compared to before the COVID-19 outbreak for each of the below items? 2 Q: For each of the following product/service, how do you expect your spending per month to change after the COVID-19 outbreak compared to before the COVID-19 outbreak? 3 Net behavior and net intent are calculated by subtracting the percent of respondents stating they expect to decrease spend from the percent of respondents stating they expect to increase spend. Indoor dining at restaurants could potentially see longer lingering effects from COVID-19 Spend preference during COVID-19 vs before,1 Net behavior3 Anticipated spend preference after COVID-19 vs before,2 Net intent3 Food: Restaurant, indoors -19% +2% Grocery +36% +33% Food: Takeout -75% -15% Food: Delivery +5% +8% Ready-made food purchased from grocery stores +29% +16% Decrease Stay the same Increase Source: McKinsey & Company COVID-19 Philippines Consumer Pulse Survey 4/17–4/20/2020, n = 639 ; 10/01–10/12/2020, n = 602, sampled and weighted to match the Philippines general population 20+ years old April 17–20 April 17–20 +9% +16% +20% +28% -75% -21% +25% +15% +9% +13% Oct 1–12 Oct 1–12
- 10. McKinsey & Company 10 Disclaimer McKinsey does not provide legal, medical, or other regulated advice or guarantee results. These materials reflect general insight and best practice based on information currently available and do not contain all of the information needed to determine a future course of action. Such information has not been generated or independently verified by McKinsey and is inherently uncertain and subject to change. McKinsey has no obligation to update these materials and makes no representation or warranty and expressly disclaims any liability with respect thereto.