SlideShare a Scribd company logo
1 of 29
McKinsey & Company 1
We have seen six fundamental shifts to consumer behavior,
some of which will have a lasting impact
Source: McKinsey & Company COVID-19 US Consumer Pulse Survey 2/18–2/22/2021, n = 2,076, sampled and weighted to match the US general population 18+ years
+35%
January 2021 year-
over-year online
credit-card and
debit-card
penetration
increase, as a % of
total spend
51%
of consumers plan
to splurge or treat
themselves, some
starting immediately
and some waiting
for COVID-19 to
subside
39%
of consumers have
tried new brands
over the course of
COVID-19
28%
of consumers have
invested in new
uses of their living
space at home
+50%
vaccinated
consumers
engaging in usual
out-of-home
activities vs. those
interested in
vaccination
~40%
of consumers are
optimistic about an
economic recovery
post-COVID-19
4. Continued
digital
stickiness
2. Signs of
spend recovery
5. Rebalancing
of homebody
economy
6. Evolution
of loyalty
3. Vaccination
accelerating
recovery
1. Steady
overall optimism
McKinsey & Company 2
Confidence in own country’s economic recovery after COVID-191
% of respondents
10 14 18 17
32
21
31
20
25
37
43
46
53 59
50
62
52 67
71
61
47
39
30 24 18 17 17 12
4 2
14
45
41
Mixed: The economy will be
impacted for 6–12 months or
longer and will stagnate or show
slow growth thereafter
Pessimistic: COVID-19 will
have lasting impact on the
economy and show regression/
fall into lengthy recession
Optimistic: The economy will
rebound within 2–3 months and
grow just as strong as or
stronger than before COVID-19
The United States is more optimistic than European countries but
less so than India, China, or Mexico
Steady overall optimism
1 Q: What is your overall confidence level surrounding economic conditions after the coronavirus (COVID-19) crisis subsides (i.e., once there is herd immunity)? Rated from 1 “very optimistic” to 6 “very pessimistic.”
Bars may not sum to 100% due to rounding.
2.China’s increase in optimism was compared to September instead of November.
US India China Brazil Germany
UK Spain
Italy
France Japan
2/18–22 2/20–3/3 2/20–3/8 2/20–3/1 2/23–27
2/23–27 2/23–27
2/23–27
2/23–27 2/24–27
Source: McKinsey & Company COVID-19 Consumer Pulse Survey
Mexico
2/20–3/2
0 +9 +9
+3 +6 +13 +1 +7 +4 +3 +5
X Increase in optimism since
November 2020, percentage point2
McKinsey & Company 3
Confidence in own country’s economic recovery after COVID-191
% of respondents
13% 16% 14% 15% 16% 16% 16% 15% 15%
20% 18% 17% 18% 19% 21% 17% 17% 14% 13% 14%
43%
45%
45%
47% 46%
48% 48% 52% 52%
49% 49% 49% 47% 46%
46%
46% 45%
44% 46% 45%
44%
39% 41% 37% 39% 35% 36% 33% 34% 32% 33% 34% 36% 35% 32% 36% 39% 42% 41% 41%
Apr 27–
May 3
Mar
16–17
Mar
20–22
Mar
23–29
Jul 30–
Aug 2
Mar 30–
Apr 5
April
6–12
Apr
13–19
May
18–24
May
4–10
May
11–17
Sep
18–24
Jun
1–7
Apr
20–26
Jun
15–21
Jul
7–12
Aug
19–23
Oct
23–27
Nov
9–13
Feb
18-22
Mixed: The economy will
be impacted for 6–12
months or longer and will
stagnate or show slow
growth thereafter
Pessimistic: COVID-19
will have lasting impact
on the economy and
show regression / fall into
lengthy recession
Optimistic: The
economy will rebound
within 2–3 months and
grow just as strong as or
stronger than before
COVID-19
Optimism regarding US economic recovery has improved since the
height of the pandemic, but has remained stable since September
Steady overall optimism
1 Q: What is your overall confidence level surrounding economic conditions after the coronavirus (COVID-19) crisis subsides (i.e., once there is herd immunity)? Rated from 1 “very optimistic” to 6 “very pessimistic.”
Figures may not sum to 100% because of rounding.
Source: McKinsey & Company COVID-19 US Consumer Pulse Survey 2/18–2/22/2021, n = 2,076; 11/9–11/13/2020, n = 2,024; 10/23–10/27/2020, n = 2,021; 9/18–9/24/2020, n = 1,026; 8/19–8/23/2020, n = 2,026; 7/30–8/2/2020, n = 2,024;
7/7–7/12/2020, n = 1,923; 6/15–6/21/2020, n = 2,006; 6/1–6/7/2020, n = 1,966; 5/18–5/24/2020, n = 1,975; 5/11–5/17/2020, n = 2,002; 5/4–5/10/2020, n = 1,993; 4/27–5/3/2020, n = 2,105; 4/20–4/26/2020, n = 1,052; 4/13–4/19/2020, n =
1,052; 4/6–4/12/2020, n = 1,063; 3/30–4/5/2020, n = 1,484; 3/23–3/29/2020, n = 1,119; 3/20–3/22/2020, n = 1,073; 3/16–3/17/2020, n = 1,042; sampled and weighted to match the US general population 18+ years
2020 2021
McKinsey & Company 4
Consumers engaging in “normal” out-of-home activities1
% of respondents
Engagement in out-of-home activities has leveled off in recent months,
with notable differences by generation and vaccination openness/status
Steady overall optimism
33
36
36
36
32
30
27
20
May 24
Jul 12
Feb 22
Sep 24
Nov 13
Jun 21
Oct 27
Aug 23
Overall
Cautious Unlikely
33%
Vaccinated Interested
54%
29%
22%
Baby boomers
Gen Z
28%
Millennials Gen X
28%
35% 38%
Medium
($50K–$100K)
Low
(<$50K)
High
(>$100K)
35%
30% 33%
~33%
of vaccinated people
are doing out-of-home
activities
~37%
of millennials are
doing out-of-home
activities
By
generation2
By income
By
vaccination
adoption3
30–35%
of all income groups
are doing out-of-home
activities
1 Q: Which best describes when you will regularly return to stores, restaurants, and other out-of-home activities? Chart shows those already participating in these activities.
2 Members of Gen Z were born from 1997–2012, millennials from 1981-1996, Gen X from 1965–1980, and baby boomers from 1946–1964. The Traditionalist/Silent Generation is not included due to a low sample size.
3 Category definitions: Vaccinated = “I have already received at least one shot”; Interested = “I am likely / very likely to get vaccinated”; Cautious = “I am somewhat likely / somewhat unlikely to get vaccinated”; Unlikely = “I am unlikely / very
unlikely to get vaccinated.”
Source: McKinsey & Company COVID-19 US Consumer Pulse Survey 2/18–2/22/2021, n = 2,076; 11/9–11/13/2020, n = 2,024; 10/23–10/27/2020, n = 2,021; 9/18–9/24/2020, n = 1,026; 8/19–8/23/2020, n = 2,026; 7/7–7/12/2020, n = 1,923;
6/15–6/21/2020, n = 2,006; 5/18–5/24/2020, n = 1,975; sampled and weighted to match the US general population 18+ years
McKinsey & Company 5
While most consumers limit out-of-home activities now, they expect
to visit friends, shop, and dine out more once COVID-19 subsides
Steady overall optimism
Out-of-home activities done in the past two weeks1
% of respondents who did activity within last 2 weeks
+17
+39
+50
+25
+8
+29
+6
+8
+25
+9
+15
+23
+24
+29
+36
+1
+12
+27
+42
+37
Net intent: 1–15 Net intent: 16–30 Net intent: 31–50
Source: McKinsey & Company COVID-19 US Consumer Pulse Survey 2/18–2/22/2021, n = 2,076, sampled and weighted to match the US general population 18+ years
1 Q: Did you leave your house for the following activities over the past two weeks? Responder % is based on those who previously selected “Yes” to having done the activity once per year prior to the COVID-19 crisis.
2 Q: Once the coronavirus (COVID-19) crisis subsides (i.e., once there is herd immunity), how do you think the amount of time you spend doing the following activities will change relative to how often you did them before COVID-19 began?
Possible answers: “I will not do this at all”; “I will do this less often than I did before COVID-19 started”; “I will do this about the same as I did before COVID-19”; “I will do this more than I did before COVID-19.” Net intent is calculated from adding
% of respondents stating they will do more or about the same, and subtracting % of respondents stating they will do less or not at all.
Net intent
post-
COVID-192
Net intent
post-
COVID-192
30
Go to a hair or nail salon
Attend an outdoor event
Go to the gym or fitness studio
Dine at a restaurant or bar
Visit a crowded outdoor public place
12
Get together with family
9
10
Go out for family entertainment
Attend an indoor cultural event
Get together with friends
35
15
30
24
35
13
Use public transportation
Shop for non-necessities
Work outside my home
Travel more than 2 hrs by car
Shop for groceries/necessities
Use ride-sharing service
Go to a shopping mall
Travel by train
Rent a short-term home
Stay in a hotel
Travel by airplane
22
50
81
59
25
28
26
22
15
11
Work
Shopping
Transport/
Travel
Social
Personal
care
Entertain
-ment
McKinsey & Company 6
Early signs of spend recovery are expected to continue with
stimulus checks deployment and consumers’ eagerness to splurge
3. Consumers are eager to
spend and splurge
2. Stimulus payments and
holiday pull-through have
influenced the recovery
1. Spend is fluctuating but
showing an upward trend
Year-on-year credit-card spend September
to February was flat vs. a contraction of 8%
during March to August
~15–20%
Uplift in spend from stimulus recipients the
first weeks after the stimulus payment
51%
of consumers plan to splurge or treat
themselves, some starting immediately and
some waiting for COVID-19 to subside
Signs of spend recovery
Source: McKinsey & Company COVID-19 US Consumer Pulse Survey 2/18–2/22/2021, n = 2,076, sampled and weighted to match the US general population 18+ years; Affinity Solutions credit-card and debit-
card spend data from 2/2019–1/2021; Earnest Research “Impact of Stimulus Payments on Consumer Spending” February 2021
Flat year-on-year spend
McKinsey & Company 7
Spend has shown early signs of recovery in the past six months, aided
by holiday pull-through and stimulus payments
Signs of spend recovery
Year-over-year credit-card spend,1 %
Source: Affinity Solutions credit-card and debit-card spend data from 2/2019–2/2021; Earnest Research “Impact of Stimulus Payments on Consumer Spending” February 2021
1 Includes credit-card and some debit-card spending data among banked consumers; does not include cash. Year-over-year growth in monthly sales during current period (2/2020–2/2021) compared to monthly sales in prior period (2/2019–2/2020).
2 Year-over-year spend in March–August 2020 decreased by 8% compared to same period in previous year, whereas September–February remained flat compared to same period in previous year.
3 Year-over-year change in spend for stimulus recipients versus those who did not receive stimulus payments.
10%
-6%
-18%
-9%
-6% -5%
-3%
1%
2% 1%
-2%
3%
-4%
Feb Mar Apr Jan
Jun
May Jul Aug Sep Oct Nov Dec Feb
First round of
stimulus payment
Second round of
stimulus payment
Holiday pull-
forward spend
Spend is fluctuating but
showing an upward trend
Stimulus payments and
holiday-influenced recovery
Those who received stimulus money in
April/May and January showed a 15–20%
uplift in spend.3 Early holiday shopping in
October and November helped support
positive growth in those months.
Mar-Aug
6 month YoY: –8%2
Sep-Feb
6 month YoY: 0%2
McKinsey & Company 8
Around half of US consumers plan to spend extra to splurge or treat
themselves, with notable differences by income and generation
Signs of spend recovery
Expected leisure spend in 20211
% of respondents who plan to splurge or treat themselves
~51%
Plan to splurge or treat
themselves
45%
Vaccinated Interested
45%
Unlikely
Cautious
56% 54%
Gen X
Gen Z
48%
Millennials
68%
Baby boomers
59%
35%
38%
Low
(<$50K)
Mid
($50K–$100K)
High
(>$100K)
51%
67%
1 Q: With regard to products and services you will spend money on, do you plan to splurge/treat yourself in 2021? Figures may not sum to 100% because of rounding.
2 Members of Gen Z were born from 1997–2012, millennials from 1981-1996, Gen X from 1965–1980, and baby boomers from 1946–1964. The Traditionalist/Silent Generation is not included due to a low sample size.
3 Category definitions: Vaccinated = “I have already received at least one shot”; Interested = “I am likely / very likely to get vaccinated”; Cautious = “I am somewhat likely / somewhat unlikely to get vaccinated”; Unlikely = “I am unlikely / very
unlikely to get vaccinated.”
~67%
of millennials
By
generation2
~67%
of more wealthy
households
By income
~56%
of fully or partially
vaccinated people
By
vaccination
adoption3
Source: McKinsey & Company COVID-19 US Consumer Pulse Survey 2/18–2/22/2021, n = 2,076, sampled and weighted to match the US general population 18+ years
McKinsey & Company 9
High-income millennials intend to splurge the most, but intent is
also high among Gen Z, all millennials and higher-income Gen X
Signs of spend recovery
>70%
<30% 50–70%
30–49%
32%
50%
53%
29%
51%
66%
63%
34%
65%
82%
66%
46%
1 Q: With regard to products and services you will spend money on, do you plan to splurge/treat yourself in 2021? Figures may not sum to 100% because of rounding.
2 Members of Gen Z were born from 1997–2012, millennials from 1981-1996, Gen X from 1965–1980, and baby boomers from 1946–1964. The Traditionalist/Silent Generation is not included due to a low sample size.
Source: McKinsey & Company COVID-19 US Consumer Pulse Survey 2/18–2/22/2021, n = 2,076, sampled and weighted to match the US general population 18+ years
Expected leisure spend in 20211
% of respondents who plan to treat themselves or splurge
~51%
Plan to splurge or
treat themselves Gen Z
Millennials
Gen X
Generation2
Mid
Low High
Baby boomers
Household income
($50–$100K/year)
(<$50K/year) (>$100K/year)
McKinsey & Company 10
This extra spend is expected across categories, and more than half
of consumers plan to treat themselves before COVID-19 subsides
Signs of spend recovery
Expected leisure categories on which people
plan to splurge or treat themselves in 20211
% of respondents who plan to splurge or treat themselves
46
44
43
37
32
30
28
28
27
Out-of-home entertainment
Restaurants, dining out, bars
​Apparel, shoes, accessories
Travel, lodging, vacation
Beauty & personal care
Electronics
Items for your home
Household essentials
Fitness, sports, outdoors
Trigger for when people plan to splurge or treat themselves2
% of respondents who plan to splurge or treat themselves on that category
24
16
32
29
32
37
15
26
20
22
26
23
26
21
20
27
22
28
15
13
13
12
14
10
14
18
17
40
45
32
34
33
34
44
34
36
Anytime Family is vaccinated
Govt restrictions lifted / COVID-19 stops spreading
I am vaccinated
1 Q: You mentioned that you plan to splurge/treat yourself in 2021. Which categories do you intend to treat yourself to? Please select all that apply.
2 Q: Which best describes when you will most likely splurge/treat yourself? Figures may not sum to 100% because of rounding.
Source: McKinsey & Company COVID-19 US Consumer Pulse Survey 2/18–2/22/2021, n = 2,076, sampled and weighted to match the US general population 18+ years
McKinsey & Company 11
-80
-20
-10
-30
-70
0
-60
-50
-40
10
20
Jun
21
Mar
22
Apr
19
Jun
7
Mar
17
Mar
29
Apr
5
Jul
12
Apr
12
Apr
26
May
3
May
10
May
17
May
24
Aug
2
Aug
23
Oct
23
Sep
24
Nov
9
Feb
22
Expected spending per category over the next two weeks compared to usual1
Net intent2
While net intent for discretionary spend is still negative,
spend intent has recovered steadily since April 2020
Signs of spend recovery
​Personal-care products
Groceries
Household supplies
Skin care & makeup
Consumer electronics
Fitness & wellness
Apparel
International flights
Domestic flights
Out-of-home
entertainment
Source: McKinsey & Company COVID-19 US Consumer Pulse Survey 2/18–2/22/2021, n = 2,076; 11/9–11/13/2020, n = 2,024; 10/23–10/27/2020, n = 2,021; 9/18–9/24/2020, n = 1,026; 8/19–8/23/2020, n = 2,026; 7/30–8/2/2020, n =
2,024; 7/7–7/12/2020, n = 1,923; 6/15–6/21/2020, n = 2,006; 6/1–6/7/2020, n = 1,966; 5/18–5/24/2020, n = 1,975; 5/11–5/17/2020, n = 2,002; 5/4–5/10/2020, n = 1,993; 4/27–5/3/2020, n = 2,105; 4/20–4/26/2020, n = 1,052; 4/13–
4/19/2020, n = 1,052; 4/6–4/12/2020, n = 1,063; 3/30–4/5/2020, n = 1,484; 3/23–3/29/2020, n = 1,119; 3/20–3/22/2020, n = 1,073; 3/16–3/17/2020, n = 1,042; sampled and weighted to match the US general population 18+ years
1 Q: Over the next two weeks, do you expect that you will spend more, about the same, or less money on these categories than usual? Figures may not sum to 100% because of rounding.
2 Net intent is calculated by subtracting the % of respondents stating they expect to decrease spending from the % of respondents stating they expect to increase spending.
McKinsey & Company 12
Consumers indicate they will spend extra on travel and mobility,
out-of-home entertainment, and restaurants after the pandemic
Signs of spend recovery
1 Q: Over the next two weeks, do you expect that you will spend more, about the same, or less money on these categories than usual?
2 Q: Once the COVID-19 crisis subsides (i.e., once there is herd immunity), do you expect that you will spend more, about the same, or less money on these categories than during the COVID-19 pandemic?
3 Net intent is calculated by subtracting the % of respondents stating they expect to decrease spending from the % of respondents stating they expect to increase spending.
Source: McKinsey & Company COVID-19 US Consumer Pulse Survey 2/18–2/22/2021, n = 2,076, sampled and weighted to match the US general population 18+ years
–15 to 0 Below –15
Above +1 Below 0
Above +25 +15 to +25 0 to +15
Net intent3
Post-
COVID-19
Next 2
weeks Evolution
Groceries/food for home 11
17
Household supplies 6
4
Tobacco products & smoking supplies -4
-3
Food takeout & delivery -10
-10
Meal at quick-service restaurants -6
-13
Toys & baby supplies -1
-15
Personal-care products 4
0
Jewelry -13
-35
Meal at restaurant 13
-27
Apparel 0
-32
Kitchen & dining -4
-21
Footwear -4
-31
Skin care & makeup 0
-21
Home decor & furniture -7
-32
Home improvement & gardening supplies 8
-17
​Sports/outdoors equipment & supplies 0
-26
Accessories (e.g., handbags, sunglasses) -7
-35
Net intent3
Next 2
weeks
Post-
COVID-19 Evolution
Pet food & supplies 2 5
​Vitamins, supplements, OTC medicines 1 7
Domestic flights -40 14
Hotel/resort stays -42 10
Adventures & tours -27 18
Entertainment out of home -32 16
Pet-care services -9 3
Fitness & wellness services (e.g., gym) -12 8
Personal-care services (e.g., hair salon) -19 4
Gasoline 1 25
Short-term apartment or house rental -29 13
Cruises -21 18
Travel by car -16 21
International flights -26 20
​Books, magazines, newspapers -11 -4
Consumer electronics -30 -5
Entertainment at home 1 0
Vehicles -15 -3
Expected spending per category over the next two weeks1 compared to post-COVID-192
% of respondents
McKinsey & Company 13
Vaccinated people are more confident that their routines and
finances will return to normal by the end of 2021
Vaccination accelerating recovery
34
36
26
32
52
42
42
39 71
78
86
68
7
4
12
27
68
66
52
40
Vaccinated
67
Unlikely
Interested
Cautious
75
64
70
Already back to normal By Dec 2021
Overindexed on rural consumers vs
all respondents (index 116)
1 Q: When do you expect your routines will return to normal? Figures may not sum to 100% because of rounding.
2 Q: When do you expect your personal/household finances will return to normal? Figures may not sum to 100% because of rounding.
3 Q: How likely are you to get the coronavirus vaccine once it is made available to you? Rated from 1 “not at all likely” to 6 “very likely,” including “I have received the first dose of the vaccine (partially vaccinated)” and “I have already received both
doses of the vaccine (fully vaccinated).” Bars may not sum to 100% due to rounding. Respondents who stated “very likely” (6) and “likely” (5) are considered “interested”; respondents who stated “somewhat likely” (4) or “somewhat unlikely” (3)
are considered “cautious”; respondents who stated “unlikely” (2) or “very unlikely” (1) are considered “unlikely.”
Source: McKinsey & Company COVID-19 US Consumer Pulse Survey 2/18–2/22/2021, n = 2,076, sampled and weighted to match the US general population 18+ years
Expectations on routines returning to normal1,3
% of respondents
Expectations on finances returning to normal2,3
% of respondents
McKinsey & Company 14
Vaccinated consumers are beginning to return to out-of-home
activities and spend at near pre-pandemic levels
Vaccination accelerating recovery
Already engaging in
out-of-home activity2
Vaccination
status1
1 Q: How likely are you to get the coronavirus vaccine once it is made available to you? Rated from 1 “not at all likely” to 6 “very likely,” including “I have received the first dose of the vaccine (partially vaccinated)” and “I have already received both
doses of the vaccine (fully vaccinated).” Bars may not sum to 100% due to rounding. Respondents who stated “very likely” (6) and “likely” (5) are considered “interested”; respondents who stated “somewhat likely” (4) or “somewhat unlikely” (3)
are considered “cautious”; respondents who stated “unlikely” (2) or “very unlikely” (1) are considered “unlikely.”
2 Q: Which best describes when you will regularly return to stores, restaurants, and other out-of-home activities? Chart shows those already participating in these activities.
3 Q: Over the next 2 weeks, do you expect that you will spend more, about the same or less money on these categories than usual?
4 Net intent is calculated by subtracting the % of respondents stating they expect to decrease spending from the % of respondents stating they expect to increase spending. It is then multiplied by the % of people who respond as typically
purchasing in that category, to effectively weight the average across categories.
Source: McKinsey & Company COVID-19 US Consumer Pulse Survey 2/18–2/22/2021, n = 2,076, sampled and weighted to match the US general population 18+ years
19%
11%
24%
28% 15%
12%
33%
30%
Net spend intent
next 2 weeks over usual3
Spend Less Spend more
Spend the same
33%
22%
29%
54%
Net intent4
-4
-13
-20
-19
27%
increase
in net intent to spend in next 2
weeks for those vaccinated vs
those interested in vaccination
50% more
vaccinated consumers say they
are engaging in usual out-of-
home activities vs those
interested in vaccination
Vaccinated
Interested
Cautious
Unlikely
McKinsey & Company 15
Although still cautious, vaccinated consumers have engaged in
more out-of-home activities than ‘vaccine interested’ consumers
Vaccination accelerating recovery
Out-of-home activities done in the past two weeks by those vaccinated1
% of respondents who did activity within last 2 weeks
17
Get together with family
Go to the gym or fitness studio
Dine at a restaurant or bar
Attend an outdoor event
Go out for family entertainment
Visit a crowded outdoor public place
35
Attend an indoor cultural event
Go to a hair or nail salon
Get together with friends
39
23
18
18
32
32
25
Use public transportation
Shop for groceries/necessities
Travel more than 2 hrs by car
Shop for non-necessities
24
Work outside my home
Travel by train
Go to a shopping mall
Use ride-sharing service
Rent a short-term home
Travel by airplane
25
Stay in a hotel
62
80
18
56
33
36
23
22
17
Increase over
those interested
in being
vaccinated2
1.3x
1.1x
1.0x
1.6x
1.4x
1.5x
1.0x
2.0x
2.4x
1.6x
1.7x
Work
Shopping
Transport/
Travel
Social
Personal
care
Entertain
-ment
2.6x
1.8x
2.7x
1.3x
2.9x
1.2x
1.4x
1.0x
1.2x
1 Q: Did you leave your house for the following activities over the past two weeks? Showing respondents who selected “yes” and also reported as being at least partially vaccinated. The responder base is comprised only of those who have
answered as having done the activity at least once per year prior to COVID-19.
2 Increase in having done the activity is determined between those who indicate being at least partially vaccinated and those who indicate as only “interested” in being vaccinated.
Increase: Below 1x Increase: 1x Difference: 2x+
Source: McKinsey & Company COVID-19 US Consumer Pulse Survey 2/18–2/22/2021, n = 2,076, sampled and weighted to match the US general population 18+ years
Increase over
those interested
in being
vaccinated2
Increase: 1.1–1.9x
McKinsey & Company 16
-2%
1 Net intent is calculated by subtracting the % of respondents stating they expect to decrease spending from the % of respondents stating they expect to increase spending.
2 Q: Over the next 2 weeks, do you expect that you will spend more, about the same or less money on these categories than usual?
Source: McKinsey & Company COVID-19 US Consumer Pulse Survey 2/18–2/22/2021, n = 2,076, sampled and weighted to match the US general population 18+ years
Footwear -20%
-31%
Apparel -28%
-31%
Home improvement & gardening supplies -5%
-17%
Kitchen & dining -4%
-18%
Skin care & makeup -13%
-19%
Food takeout & delivery -1%
-5%
Tobacco products & smoking supplies 9%
2%
Personal-care products 3%
1%
Groceries/food for home 19%
19%
Meal at quick-service restaurants 2%
-17%
Meal at restaurant -12%
-30%
Accessories (e.g., handbags, sunglasses) -21%
-34%
-16%
Jewelry -33%
Toys & baby supplies 6%
-17%
Home decor & furniture -16%
-32%
Sports/outdoors equipment & supplies -8%
-27%
Pet food & supplies 6%
7%
Vitamins, supplements, OTC medicines 8%
3%
Domestic flights -41%
-41%
Hotel/resort stays -31%
-44%
Adventures & tours -20%
-27%
Pet-care services 2%
-6%
Gasoline 6%
-4%
Short-term apartment or house rental -24%
-26%
Cruises -15%
-24%
Books, magazines, newspapers -1%
-4%
Consumer electronics -20%
-30%
Entertainment at home 8%
8%
Vehicles -11%
Entertainment out of home -17%
-32%
Fitness & wellness services (e.g., gym) 4%
-11%
Personal-care services (e.g., hair salon) -1%
-21%
Travel by car -4%
-19%
International flights -10%
-29%
Household supplies 5%
9%
Vaccinated consumers have a higher net intent to spend, including
for restaurants, in-person services, and out-of-home entertainment
Vaccination accelerating recovery
Net intent1 for expected spending per category over the next two weeks compared to usual2 Net intent between 0 and –15 Net intent below –15
Net intent Above +1
Below 1
Categories with >10 percentage-point
increase in net intent for interested
consumers vs cautious consumers
+1 to +9 –/+1
For vaccinated consumers vs those interested in receiving the vaccine
Net intent2
Net intent2
Vaccinated
Interested Difference Vaccinated
Interested Difference
McKinsey & Company 17
Consumers indicate that new digital behaviors developed during
the COVID-19 pandemic will stick
3. Sticky behaviors across
in-home entertainment and
digital wellness
2. Sustained use of novel
purchasing methods
1. Increased online purchasing
+35%
Overall increase in online penetration,
based on credit-card and debit-card spend
~70–80%
of consumers who accelerated their digital
health/wellness engagement say they will
continue post-COVID-19
+60%
growth in restaurant/store curbside pickup
during COVID-19, ~50% expect to continue
using it
Continued digital stickiness
Source: McKinsey & Company COVID-19 US Consumer Pulse Survey 2/18–2/22/2021, n = 2,076, sampled and weighted to match the US general population 18+ years; Affinity Solutions credit-card and debit-
card spend data from 2/2019–1/2021; Facteus debit-card spend data from 2/2019–1/2021
McKinsey & Company 18
Online spend penetration has accelerated in the past 12 months
across categories, sustaining April’s peak
+35%
Year-over-year
increase in online
penetration, based on
credit-card and debit-
card spend
19%
18%
20%
27% 27%
25% 25% 25% 24% 24%
28%
29%
26%
Aug
Jan
2020
Feb Mar May
Apr Jun Jul Sep Oct Nov Dec Jan
2021
+35%
Retail-oriented online credit-card and debit-card spend as percent of total1
Source: Affinity Solutions credit-card and debit-card spend data from 2/2019–1/2021; Facteus debit-card spend data from 2/2019–1/2021
1 Year-over-year growth of total sales in last 12 months (2/2020–1/2021) compared to total sales in the prior 12 months (2/2019–1/2020); including the following retailer categories: Amazon, apparel, software & electronics, cosmetic stores; pet
shops, home stores, mass stores, club stores, restaurants, grocery stores, drug stores, discount stores.
Continued digital stickiness
McKinsey & Company 19
Retail saw online sales increase during COVID-19; categories with already
high online penetration saw a dramatic spike during April’s lockdowns
37%
81%
48%
2021
(Jan)
Pre-
COVID-19
(Jan/Feb
2020)
Apr 2020
spike
+29%
8%
14% 14%
Pre-
COVID-19
(Jan/Feb
2020)
Apr 2020
spike
2021
(Jan)
+65%
3%
6% 6%
Apr 2020
spike
Pre-
COVID-19
(Jan/Feb
2020)
2021
(Jan)
+112%
Continued digital stickiness
Source: Affinity Solutions credit-card and debit-card spend data from 2/2019–1/2021; Facteus debit-card spend data from 2/2019–1/2021
1“High online penetration retail categories” includes those with >20% pre-COVID-19 internet penetration, i.e., apparel, software & electronics, cosmetic stores; pet shops.
2 “Medium online penetration retail categories” includes those with 7–20% pre-COVID-19 internet penetration, i.e., home stores, mass stores, club stores.
3“Low online penetration retail categories” includes those with <7% pre-COVID-19 internet penetration, i.e., restaurants, grocery stores, drug stores, discount stores.
4 Certain retailers (e.g., Amazon) don’t have categories broken down within credit card and debit card data. Amazon is not included in these groupings.
Online sales as a % of overall sales for credit-card and debit-card spend1,2,3,4
High pre-COVID-19 penetration (>20%)1 Moderate pre-COVID-19 penetration (7–20%)2 Low pre-COVID-19 penetration (<7%)3
McKinsey & Company 20
Consumers expect more digital acceleration in categories such as
apparel, consumer electronics, and pet supplies
Greater online presence
Less-accelerated online shift Sustained shift to online
Net intent to continue to purchase online after COVID-191,3
Percent of users who intend to keep doing activity after COVID-19 at same or higher level
Penetration
since
COVID-19
2
1 Q: Will you continue to purchase these categories online after the COVID-19 situation subsides (i.e., once there is herd immunity)? Possible answers: “no, I will stop purchasing online altogether”; “buy less online”; “buy about the same amount
online”; and “buy more online.” Number indicates net intent, calculated by subtracting % of respondents stating they expect to decrease or stop use from % of respondents stating they expect to increase or maintain use.
2 Q: Have you purchased the following categories online since the coronavirus (COVID-19) began? Please select yes or no for each category. Includes % respondents who selected “yes” for the category.
3 Thresholds of categories are defined by the tercile. The first tercile of intent occurs at 18%, and the second occurs at 26%.
Continued digital stickiness
Source: McKinsey & Company COVID-19 US Consumer Pulse Survey 2/18–2/22/2021, n = 2,076, sampled and weighted to match the US general population 18+ years
75
12 25
20
15
9 16 27
10 21 42
11 13 14 17 18 19
45
65
22 23 37
24 26 28 29
80
30 35
31 43
32
55
33 34 36 38 39 40 41 44
30
35
50
Food takeout & delivery
Home decor & furniture Pet supplies
Personal-care products
Groceries
Alcoholic beverages
Apparel
Household supplies
Pet-care services
Kitchen
Accessories
Home improvement
Personal-care services
Fitness & wellness services
Sports & outdoors equipment
Skin care & makeup
Jewelry
Footwear
Consumer electronics
Entertainment out of home
Adventures & tours
Books
Tobacco products
Vitamins, supplements, OTC medicines
Toys & baby supplies
McKinsey & Company 21
Intent to use after COVID-191
Percent of users who intend to keep doing activity after COVID-19
Consumers say most food-related pickup and delivery works; social
shopping, apps, and plug-ins have a smaller but loyal following
Source: McKinsey & Company COVID-19 US Consumer Pulse Survey 2/18–2/22/2021, n = 2,076, sampled and weighted to match the US general population 18+ years
1 Q: Compared to now, will you do or use the following more, less, or not at all, once the coronavirus (COVID-19) ) crisis subsides (i.e., once there is herd immunity)? Possible answers: “will stop this”; ”will reduce this”; “will keep doing what I am
doing now”; “will increase this.” Number indicates respondents who chose “will keep doing what I am doing now” and “will increase this” among new or increased users.
2 Q. Which best describes when you have done or used each of these items? Possible answers included: “just started using since coronavirus started”; “using more since coronavirus started"; “using less since coronavirus started” or “using about
the same since coronavirus started.” Possible answers not included: “not using.”
~60–70% of
consumers expect
to continue digital
activities with
COVID-19
acceleration
~45–55% of
consumers expect
to continue digital
activities with
more disruptive
growth during
COVID-19
82
26 68
28 84
38
32 52
30
25
74
34
30
36
15
60
46
40 42
20
44 48 50 54
40
56
45
58 62 64 66 70
50
72 76 78 80
0
35
5
10
Restaurant delivery
Meal-kit delivery
Buy online for
in-store pickup
Deal-finding plug-ins
Purchased from social media
In-store self-checkout
Quick-serve
restaurant
drive-thru
Grocery delivery
Restaurant
curbside pickup
Store curbside
pickup New store/restaurant app
Purchased pre-owned products online
Penetration
since
COVID-19
2
COVID-19 acceleration
Disruptive growth
User growth: 0–19% User growth: 20–39% User growth: 40–59% User growth: 60%+
Continued digital stickiness
McKinsey & Company 22
44
38 52
50
42
40
40
48
50
60
46 54 56 72
58 60 62 64 66 68
0
70 74 76 78 80
10
20
30
Digital exercise machine
Used social media
Video chat: personal
Telemedicine: mental
TikTok
Online streaming
Online fitness
Videoconferencing: professional
Remote learning: myself
Remote learning: my children
Telemedicine: physical
Wellness app
Playing online games
Watching e-sports
Cooked regularly
Personal care /
grooming at home
1 Q: Compared to now, will you do or use the following more, less, or not at all, once the coronavirus (COVID-19) ) crisis subsides (i.e., once there is herd immunity)? Possible answers: “will stop this”; ”will reduce this”; “will keep doing what I am
doing now”; “will increase this.” Number indicates respondents who chose “will keep doing what I am doing now” and “will increase this” among new or increased users.
2 Q. Which best describes when you have done or used each of these items? Possible answers included: “Just started using since coronavirus started”; “using more since coronavirus started”; “using less since coronavirus started” or “using about
the same since coronavirus started.” Possible answers not included: “not using.”
Online entertainment and wellness habits adopted during
the crisis are likely to remain for the medium to long term
Source: McKinsey & Company COVID-19 US Consumer Pulse Survey 2/18–2/22/2021, n = 2,076, sampled and weighted to match the US general population 18+ years
COVID-19 emphasized
COVID-19 acceleration
Disruptive growth
~65–80% of
consumers expect
to continue current
level of digital
wellness and
interactive online
entertainment
accelerated during
COVID-19
Limited shift with
COVID-19
~45–55% of
consumers expect
to continue current
level of remote
communication,
learning, health
platforms with
disruptive
COVID-19 growth
Intent to use after COVID-191
Percent of users who intend to keep doing activity after COVID-19
Continued digital stickiness
User growth: 0–19% User growth: 20–39% User growth: 40–59% User growth: 60%+
Penetration
since
COVID-19
2
McKinsey & Company 23
Consumers have made many investments in their homes that will
have long-term effects
1 Q: Which of the following have you done in the last 12 months as a result of the COVID-19 crisis? 36% answered “none of these.”
Renovated/remodeled my home
Went back to school
Worked more from home
Moved into a bigger home
Decided to change jobs
4%
Permanently moved to a new city
Set up a specific work-from-home space
Set up a gym at home
Bought a car
Reassessed my investment portfolio
Permanently moved the suburbs
Bought a property
Got a new pet at home (e.g. dog, cat)
Sold a property
Moved into a smaller home
13%
4%
Permanently moved to the countryside
24%
7%
5%
12%
10%
12%
3%
6%
12%
5%
4%
6%
5%
13%
Permanently moved in with family
Pet adoption 13%
House move 19%
Home
renovation
28%
Investments/
Divestments
26%
Changes made in the last 12 months as a result of COVID-191
% of respondents
Source: McKinsey & Company COVID-19 US Consumer Pulse Survey 2/18–2/22/2021, n = 2,076, sampled and weighted to match the US general population 18+ years
Work/study
change
32%
Rebalancing of homebody economy
McKinsey & Company 24
However, consumers indicate eagerness to return to out-of-home
activities post-COVID-19
7
17
25
20
16
17
16
30
23
17
8
6
13
23
18
13
15
18
13
14
14
29
13
16
17
15
16
14
11
13
16
18
21
11
Tobacco products
Groceries
Apparel
Quick-service restaurant
Home & furniture
Food takeout & delivery
Restaurant
Jewelry
Footwear
Accessories
Toys & baby
Household supplies
Personal-care products
Skin care & makeup
Sports & outdoors
Home improvement & garden
Kitchen & dining
Decrease Increase
Stay the same
7
7
13
16
19
16
16
16
13
8
20
19
11
19
19
18
20
18
11
13
13
12
14
32
19
24
18
32
17
32
33
38
37
38
30
32
Pet-care services
Vehicles
Vitamins & OTC medicine
Out-of-home entertainment
Entertainment at home
Pet food & supplies
Books/magazines/newspapers
Fitness & wellness
Consumer electronics
Personal-care services
Gasoline
Short-term home rentals
Travel by car
Cruises
Adventures & tours
International flights
Hotel/resort stays
Domestic flights
Source: McKinsey & Company COVID-19 US Consumer Pulse Survey 2/18–2/22/2021, n = 2,076, sampled and weighted to match the US general population 18+ years
Net intent: Above +1 Net intent: –15 to 0 Net intent: Below – 15 Categories with net intent >10%
Expected spending per category post-COVID-19 compared to during COVID-191
% of respondents
Net
intent2
Net
intent2
11% 5%
-10% 0%
-6% -4%
13% -5%
-4% 16%
0%
3%
-13%
8%
-7%
4%
-1%
25%
4%
13%
0%
21%
-7%
18%
0%
18%
8%
20%
-4%
10%
14%
-4% 7%
6%
-3%
Rebalancing of homebody economy
1 Q: Once the COVID-19 crisis subsides (i.e., once there is herd immunity), do you expect that you will spend more, about the same, or less money on these categories than during the COVID-19 pandemic? Figures may not sum to
100% because of rounding.
2 Net intent is calculated by subtracting the % of respondents stating they expect to decrease spending from the % of respondents stating they expect to increase spending.
McKinsey & Company 25
Have you done any of the following since COVID-19 started1,2
% of respondents
More than 75 percent of Americans have tried a new shopping
behavior during the pandemic, and the trend continues in 2021
Evolution of loyalty
40%
39%
34%
29%
26%
Private label/store brand
New shopping method3
Different brand
Different retailer/store/website
New digital shopping method
1 Q: Since the coronavirus (COVID-19) crisis started, which of the following have you done? 23% consumers selected “none of these.”
2 Q: Which best describes whether or not you plan to continue with these shopping changes once the coronavirus (COVID-19) crisis has subsided (i.e., once there is herd immunity)? Possible answers: “will go back to what I did before
coronavirus”; ”will keep doing both this and what I did before coronavirus”; ”will keep doing this and NOT go back to what I did before coronavirus.”
3 “New shopping method” includes curbside pickup and delivery apps.
4 “Growth” is indicated by numbers greater than 1x (i.e., 1x indicates no growth, 1.1x indicates 10% growth).
5 Intent to continue includes respondents who selected “will keep doing both this and what I did before coronavirus” and “will keep doing this and NOT go back to what I did before coronavirus.”
6 Members of Gen Z were born from 1997–2012, millennials from 1981-1996, Gen X from 1965–1980, and baby boomers from 1946–1964. The Traditionalist/Silent Generation is not included due to a low sample size.
Source: McKinsey & Company COVID-19 US Consumer Pulse Survey 2/18–2/22/2021, n = 2,076, sampled and weighted to match the US general population 18+ years
Growth since
Aug. 20204
44% vs. 35%
more millennials/Gen Z have tried a
new brand than baby boomers6
77%
of consumers
have tried a
new shopping
behavior
84%
of millennials and
Gen Z have tried
a new shopping
behavior6
Intent to
continue5
1x
1x
1.1x
1.2x
1.2x
76%
78%
79%
81%
81%
McKinsey & Company 26
Value was the main driver of consumers’ switching brands, but they
also switched for reasons of purpose, quality, and novelty
Evolution of loyalty
1 Q: You mentioned you tried a new/different brand than what you normally buy. What were the main reasons that drove this decision? Select all that apply. “Brand” includes different brand, new private label/store brand. Over-arching reason
based on % of individual respondents responding to at least one reason in the group.
2 Members of Gen Z were born from 1997–2012, millennials from 1981–1996.
40%
38%
16%
13%
42%
17%
9%
11%
11%
24%
18%
24%
17%
19%
16%
26%
19%
Wanted to try a new brand I found
The company treats its employees well
Is more sustainable/better for the environment
Better value
Better prices/promotions
Shares my values
Supporting local businesses
Better shipping/delivery cost
Wanted to treat myself
Larger package sizes
Products are in stock
Better quality
Is natural/organic
Wanted to try a type of product I’ve never tried before
Wanted variety/change from my normal routine
Is available where I’m shopping (i.e., in store or online)
Is cleaner/safer
Reason for trying a new brand since COVID-19 began1
% of respondents selecting reason in top three
Source: McKinsey & Company COVID-19 US Consumer Pulse Survey 2/18–2/22/2021, n = 2,076, sampled and weighted to match the US general population 18+ years
42%
of millennials/
Gen Z cite
purpose as a
primary reason2
44%
of millennials/
Gen Z cite
quality/organic as
a primary reason2
Net % of respondents per category
X%
Value 65%
Quality/organic 34%
Availability 42%
Convenience 26%
Purpose-driven 34%
Novelty 33%
Health/hygiene 16%
Personal choice 28%
McKinsey & Company 27
During COVID-19, brands from larger companies grew more initially,
but smaller companies now play an increased role in growth
Share of sales, %
Source: Nielsen
$14B
$10B
$548B $14B
1 Nielsen xAOC, super categories excluding alcohol, tobacco, fresh, and general merchandise.
2 Companies with yearly sales are Large > $2.5B; Medium <$2.5B but >$500M; Small <$500M.
3“CY 2018” is calendar year growth from 2017–2018; “CY 2019” is calendar year growth from 2018–2019.
4 Year-over-year growth for 4 weeks ending March 21, 2020, August 8, 2020, and Feb 20, 2021.
$5B
Evolution of loyalty
Share of year-over-year dollar sales growth of consumer packaged goods products
by company size,1,2 %
51
32 34
54
42 44
14 12
14 16
18
30 28
16 34
33
18
35 33
18
10 8
CY 20183 February 20214
August 20204
2019
3 4
CY 20193 March 20204
$4B
Small
Retailer brands Medium Large
McKinsey & Company 28
Source: McKinsey 2020–21 Global Sentiment Survey
Trade-off behavior in a standard shopping basket among all consumers by
income tier1
% of consumers, September 2020 and September 2019
>$100K
$50K–$100K
<$50K
US income tiers, household, annual
6
18
4
3
3
17
6
3
3
10
6
10
1 Q: Please indicate how your buying behavior has changed in a standard shopping basket for the items shown in the past 12 months (since September 2019). Select all that apply with option 7 being mutually exclusive and option 1 exclusive from
option 2. Possible answers: 1) “Switching to less expensive brands”; 2) “Switching to more expensive / premium brands”; 3) “Buying the same brand as I bought 12 months ago, but at stores with lower prices”; 4) “Buying only when on sale or
with coupon”; 5) “Buying less frequently of lower quantity of the same brand”; 6)“Have made some other change in how I buy these products”; 7)“Have not made changes in how I buy these products.” Trade down reflects option 1 as a
percentage of all consumers, while trade up reflects option 2 as a percentage of all consumers.
Total
4
16
5
5
3.65X
Evolution of loyalty
While trade-down increased across income groups, trade-up increased
as well for consumers with over $100,000 in household income
2019
2020
Trade down
Trade up
McKinsey & Company 29
Disclaimer
McKinsey does not provide legal, medical, or other regulated advice or guarantee results. These
materials reflect general insight and best practice based on information currently available and do
not contain all of the information needed to determine a future course of action. Such information
has not been generated or independently verified by McKinsey and is inherently uncertain and
subject to change. McKinsey has no obligation to update these materials and makes no
representation or warranty and expressly disclaims any liability with respect thereto.

More Related Content

Similar to McKinsey Survey: US consumer sentiment during the coronavirus crisis

McKinsey Survey: Mexican consumer sentiment during the coronavirus crisis
McKinsey Survey: Mexican consumer sentiment during the coronavirus crisisMcKinsey Survey: Mexican consumer sentiment during the coronavirus crisis
McKinsey Survey: Mexican consumer sentiment during the coronavirus crisisMcKinsey on Marketing & Sales
 
McKinsey Survey: Japanese consumer sentiment during the coronavirus crisis
McKinsey Survey: Japanese consumer sentiment during the coronavirus crisisMcKinsey Survey: Japanese consumer sentiment during the coronavirus crisis
McKinsey Survey: Japanese consumer sentiment during the coronavirus crisisMcKinsey on Marketing & Sales
 
McKinsey Survey: US consumer sentiment during the coronavirus crisis
McKinsey Survey: US consumer sentiment during the coronavirus crisisMcKinsey Survey: US consumer sentiment during the coronavirus crisis
McKinsey Survey: US consumer sentiment during the coronavirus crisisMcKinsey on Marketing & Sales
 
McKinsey Survey: German consumer sentiment during the coronavirus crisis
McKinsey Survey: German consumer sentiment during the coronavirus crisisMcKinsey Survey: German consumer sentiment during the coronavirus crisis
McKinsey Survey: German consumer sentiment during the coronavirus crisisMcKinsey on Marketing & Sales
 
McKinsey Survey: Canadian consumer sentiment during the coronavirus crisis
McKinsey Survey: Canadian consumer sentiment during the coronavirus crisisMcKinsey Survey: Canadian consumer sentiment during the coronavirus crisis
McKinsey Survey: Canadian consumer sentiment during the coronavirus crisisMcKinsey on Marketing & Sales
 
McKinsey Survey: German consumer sentiment during the coronavirus crisis
McKinsey Survey: German consumer sentiment during the coronavirus crisisMcKinsey Survey: German consumer sentiment during the coronavirus crisis
McKinsey Survey: German consumer sentiment during the coronavirus crisisMcKinsey on Marketing & Sales
 
McKinsey: Survey: Indonesian consumer sentiment during the coronavirus crisis
McKinsey: Survey: Indonesian consumer sentiment during the coronavirus crisisMcKinsey: Survey: Indonesian consumer sentiment during the coronavirus crisis
McKinsey: Survey: Indonesian consumer sentiment during the coronavirus crisisMcKinsey on Marketing & Sales
 
McKinsey Survey: US consumer sentiment during the coronavirus crisis
McKinsey Survey: US consumer sentiment during the coronavirus crisisMcKinsey Survey: US consumer sentiment during the coronavirus crisis
McKinsey Survey: US consumer sentiment during the coronavirus crisisMcKinsey on Marketing & Sales
 
McKinsey Survey: German consumer sentiment during the coronavirus crisis
McKinsey Survey: German consumer sentiment during the coronavirus crisisMcKinsey Survey: German consumer sentiment during the coronavirus crisis
McKinsey Survey: German consumer sentiment during the coronavirus crisisMcKinsey on Marketing & Sales
 
McKinsey: Survey: Indonesian consumer sentiment during the coronavirus crisis
McKinsey: Survey: Indonesian consumer sentiment during the coronavirus crisisMcKinsey: Survey: Indonesian consumer sentiment during the coronavirus crisis
McKinsey: Survey: Indonesian consumer sentiment during the coronavirus crisisMcKinsey on Marketing & Sales
 
McKinsey Survey: Indian consumer sentiment during the coronavirus crisis
McKinsey Survey: Indian consumer sentiment during the coronavirus crisisMcKinsey Survey: Indian consumer sentiment during the coronavirus crisis
McKinsey Survey: Indian consumer sentiment during the coronavirus crisisMcKinsey on Marketing & Sales
 
McKinsey Survey: German consumer sentiment during the coronavirus crisis
McKinsey Survey: German consumer sentiment during the coronavirus crisisMcKinsey Survey: German consumer sentiment during the coronavirus crisis
McKinsey Survey: German consumer sentiment during the coronavirus crisisMcKinsey on Marketing & Sales
 
McKinsey Survey: Chinese consumer sentiment during the coronavirus crisis
McKinsey Survey: Chinese consumer sentiment during the coronavirus crisisMcKinsey Survey: Chinese consumer sentiment during the coronavirus crisis
McKinsey Survey: Chinese consumer sentiment during the coronavirus crisisMcKinsey on Marketing & Sales
 
McKinsey Survey: Spanish consumer sentiment during the coronavirus crisis
McKinsey Survey: Spanish consumer sentiment during the coronavirus crisisMcKinsey Survey: Spanish consumer sentiment during the coronavirus crisis
McKinsey Survey: Spanish consumer sentiment during the coronavirus crisisMcKinsey on Marketing & Sales
 
McKinsey Survey: Chinese consumer sentiment during the coronavirus crisis
McKinsey Survey: Chinese consumer sentiment during the coronavirus crisisMcKinsey Survey: Chinese consumer sentiment during the coronavirus crisis
McKinsey Survey: Chinese consumer sentiment during the coronavirus crisisMcKinsey on Marketing & Sales
 

Similar to McKinsey Survey: US consumer sentiment during the coronavirus crisis (20)

McKinsey Survey: Mexican consumer sentiment during the coronavirus crisis
McKinsey Survey: Mexican consumer sentiment during the coronavirus crisisMcKinsey Survey: Mexican consumer sentiment during the coronavirus crisis
McKinsey Survey: Mexican consumer sentiment during the coronavirus crisis
 
McKinsey Survey: Japanese consumer sentiment during the coronavirus crisis
McKinsey Survey: Japanese consumer sentiment during the coronavirus crisisMcKinsey Survey: Japanese consumer sentiment during the coronavirus crisis
McKinsey Survey: Japanese consumer sentiment during the coronavirus crisis
 
McKinsey Survey: Japanese consumer sentiment during the coronavirus crisis
McKinsey Survey: Japanese consumer sentiment during the coronavirus crisisMcKinsey Survey: Japanese consumer sentiment during the coronavirus crisis
McKinsey Survey: Japanese consumer sentiment during the coronavirus crisis
 
McKinsey Survey: US consumer sentiment during the coronavirus crisis
McKinsey Survey: US consumer sentiment during the coronavirus crisisMcKinsey Survey: US consumer sentiment during the coronavirus crisis
McKinsey Survey: US consumer sentiment during the coronavirus crisis
 
McKinsey Survey: US consumer sentiment during the coronavirus crisis
McKinsey Survey: US consumer sentiment during the coronavirus crisisMcKinsey Survey: US consumer sentiment during the coronavirus crisis
McKinsey Survey: US consumer sentiment during the coronavirus crisis
 
McKinsey Survey: German consumer sentiment during the coronavirus crisis
McKinsey Survey: German consumer sentiment during the coronavirus crisisMcKinsey Survey: German consumer sentiment during the coronavirus crisis
McKinsey Survey: German consumer sentiment during the coronavirus crisis
 
McKinsey Survey: Canadian consumer sentiment during the coronavirus crisis
McKinsey Survey: Canadian consumer sentiment during the coronavirus crisisMcKinsey Survey: Canadian consumer sentiment during the coronavirus crisis
McKinsey Survey: Canadian consumer sentiment during the coronavirus crisis
 
McKinsey Survey: German consumer sentiment during the coronavirus crisis
McKinsey Survey: German consumer sentiment during the coronavirus crisisMcKinsey Survey: German consumer sentiment during the coronavirus crisis
McKinsey Survey: German consumer sentiment during the coronavirus crisis
 
McKinsey Survey: German consumer sentiment during the coronavirus crisis
McKinsey Survey: German consumer sentiment during the coronavirus crisisMcKinsey Survey: German consumer sentiment during the coronavirus crisis
McKinsey Survey: German consumer sentiment during the coronavirus crisis
 
McKinsey: Survey: Indonesian consumer sentiment during the coronavirus crisis
McKinsey: Survey: Indonesian consumer sentiment during the coronavirus crisisMcKinsey: Survey: Indonesian consumer sentiment during the coronavirus crisis
McKinsey: Survey: Indonesian consumer sentiment during the coronavirus crisis
 
McKinsey Survey: US consumer sentiment during the coronavirus crisis
McKinsey Survey: US consumer sentiment during the coronavirus crisisMcKinsey Survey: US consumer sentiment during the coronavirus crisis
McKinsey Survey: US consumer sentiment during the coronavirus crisis
 
McKinsey Survey: German consumer sentiment during the coronavirus crisis
McKinsey Survey: German consumer sentiment during the coronavirus crisisMcKinsey Survey: German consumer sentiment during the coronavirus crisis
McKinsey Survey: German consumer sentiment during the coronavirus crisis
 
McKinsey: Survey: Indonesian consumer sentiment during the coronavirus crisis
McKinsey: Survey: Indonesian consumer sentiment during the coronavirus crisisMcKinsey: Survey: Indonesian consumer sentiment during the coronavirus crisis
McKinsey: Survey: Indonesian consumer sentiment during the coronavirus crisis
 
McKinsey: Survey: Indonesian consumer sentiment during the coronavirus crisis
McKinsey: Survey: Indonesian consumer sentiment during the coronavirus crisisMcKinsey: Survey: Indonesian consumer sentiment during the coronavirus crisis
McKinsey: Survey: Indonesian consumer sentiment during the coronavirus crisis
 
McKinsey Survey: Indian consumer sentiment during the coronavirus crisis
McKinsey Survey: Indian consumer sentiment during the coronavirus crisisMcKinsey Survey: Indian consumer sentiment during the coronavirus crisis
McKinsey Survey: Indian consumer sentiment during the coronavirus crisis
 
McKinsey Survey: Indian consumer sentiment during the coronavirus crisis
McKinsey Survey: Indian consumer sentiment during the coronavirus crisisMcKinsey Survey: Indian consumer sentiment during the coronavirus crisis
McKinsey Survey: Indian consumer sentiment during the coronavirus crisis
 
McKinsey Survey: German consumer sentiment during the coronavirus crisis
McKinsey Survey: German consumer sentiment during the coronavirus crisisMcKinsey Survey: German consumer sentiment during the coronavirus crisis
McKinsey Survey: German consumer sentiment during the coronavirus crisis
 
McKinsey Survey: Chinese consumer sentiment during the coronavirus crisis
McKinsey Survey: Chinese consumer sentiment during the coronavirus crisisMcKinsey Survey: Chinese consumer sentiment during the coronavirus crisis
McKinsey Survey: Chinese consumer sentiment during the coronavirus crisis
 
McKinsey Survey: Spanish consumer sentiment during the coronavirus crisis
McKinsey Survey: Spanish consumer sentiment during the coronavirus crisisMcKinsey Survey: Spanish consumer sentiment during the coronavirus crisis
McKinsey Survey: Spanish consumer sentiment during the coronavirus crisis
 
McKinsey Survey: Chinese consumer sentiment during the coronavirus crisis
McKinsey Survey: Chinese consumer sentiment during the coronavirus crisisMcKinsey Survey: Chinese consumer sentiment during the coronavirus crisis
McKinsey Survey: Chinese consumer sentiment during the coronavirus crisis
 

More from McKinsey on Marketing & Sales

McKinsey European consumer sentiment survey: How current events are shaping S...
McKinsey European consumer sentiment survey: How current events are shaping S...McKinsey European consumer sentiment survey: How current events are shaping S...
McKinsey European consumer sentiment survey: How current events are shaping S...McKinsey on Marketing & Sales
 
McKinsey European consumer sentiment survey: How current events are shaping U...
McKinsey European consumer sentiment survey: How current events are shaping U...McKinsey European consumer sentiment survey: How current events are shaping U...
McKinsey European consumer sentiment survey: How current events are shaping U...McKinsey on Marketing & Sales
 
McKinsey European consumer sentiment survey: How current events are shaping I...
McKinsey European consumer sentiment survey: How current events are shaping I...McKinsey European consumer sentiment survey: How current events are shaping I...
McKinsey European consumer sentiment survey: How current events are shaping I...McKinsey on Marketing & Sales
 
McKinsey European consumer sentiment survey: How current events are shaping G...
McKinsey European consumer sentiment survey: How current events are shaping G...McKinsey European consumer sentiment survey: How current events are shaping G...
McKinsey European consumer sentiment survey: How current events are shaping G...McKinsey on Marketing & Sales
 
McKinsey European consumer sentiment survey: How current events are shaping F...
McKinsey European consumer sentiment survey: How current events are shaping F...McKinsey European consumer sentiment survey: How current events are shaping F...
McKinsey European consumer sentiment survey: How current events are shaping F...McKinsey on Marketing & Sales
 
McKinsey Survey: Japanese consumer sentiment during the coronavirus crisis
McKinsey Survey: Japanese consumer sentiment during the coronavirus crisisMcKinsey Survey: Japanese consumer sentiment during the coronavirus crisis
McKinsey Survey: Japanese consumer sentiment during the coronavirus crisisMcKinsey on Marketing & Sales
 
McKinsey Survey: Australian consumer sentiment during the coronavirus crisis
McKinsey Survey: Australian consumer sentiment during the coronavirus crisisMcKinsey Survey: Australian consumer sentiment during the coronavirus crisis
McKinsey Survey: Australian consumer sentiment during the coronavirus crisisMcKinsey on Marketing & Sales
 
McKinsey Survey: Indian consumer sentiment during the coronavirus crisis
McKinsey Survey: Indian consumer sentiment during the coronavirus crisisMcKinsey Survey: Indian consumer sentiment during the coronavirus crisis
McKinsey Survey: Indian consumer sentiment during the coronavirus crisisMcKinsey on Marketing & Sales
 
McKinsey Survey: Korean consumer sentiment during the coronavirus crisis
McKinsey Survey: Korean consumer sentiment during the coronavirus crisisMcKinsey Survey: Korean consumer sentiment during the coronavirus crisis
McKinsey Survey: Korean consumer sentiment during the coronavirus crisisMcKinsey on Marketing & Sales
 
McKinsey European consumer sentiment survey: How current events are shaping F...
McKinsey European consumer sentiment survey: How current events are shaping F...McKinsey European consumer sentiment survey: How current events are shaping F...
McKinsey European consumer sentiment survey: How current events are shaping F...McKinsey on Marketing & Sales
 
McKinsey European consumer sentiment survey: How current events are shaping U...
McKinsey European consumer sentiment survey: How current events are shaping U...McKinsey European consumer sentiment survey: How current events are shaping U...
McKinsey European consumer sentiment survey: How current events are shaping U...McKinsey on Marketing & Sales
 
McKinsey European consumer sentiment survey: How current events are shaping G...
McKinsey European consumer sentiment survey: How current events are shaping G...McKinsey European consumer sentiment survey: How current events are shaping G...
McKinsey European consumer sentiment survey: How current events are shaping G...McKinsey on Marketing & Sales
 
McKinsey European consumer sentiment survey: How current events in Europe are...
McKinsey European consumer sentiment survey: How current events in Europe are...McKinsey European consumer sentiment survey: How current events in Europe are...
McKinsey European consumer sentiment survey: How current events in Europe are...McKinsey on Marketing & Sales
 
McKinsey European consumer sentiment survey: How current events are shaping S...
McKinsey European consumer sentiment survey: How current events are shaping S...McKinsey European consumer sentiment survey: How current events are shaping S...
McKinsey European consumer sentiment survey: How current events are shaping S...McKinsey on Marketing & Sales
 
McKinsey European consumer sentiment survey: How current events are shaping I...
McKinsey European consumer sentiment survey: How current events are shaping I...McKinsey European consumer sentiment survey: How current events are shaping I...
McKinsey European consumer sentiment survey: How current events are shaping I...McKinsey on Marketing & Sales
 
McKinsey survey: European consumer sentiment survey: How current events are s...
McKinsey survey: European consumer sentiment survey: How current events are s...McKinsey survey: European consumer sentiment survey: How current events are s...
McKinsey survey: European consumer sentiment survey: How current events are s...McKinsey on Marketing & Sales
 

More from McKinsey on Marketing & Sales (20)

McKinsey European consumer sentiment survey: How current events are shaping S...
McKinsey European consumer sentiment survey: How current events are shaping S...McKinsey European consumer sentiment survey: How current events are shaping S...
McKinsey European consumer sentiment survey: How current events are shaping S...
 
McKinsey European consumer sentiment survey: How current events are shaping U...
McKinsey European consumer sentiment survey: How current events are shaping U...McKinsey European consumer sentiment survey: How current events are shaping U...
McKinsey European consumer sentiment survey: How current events are shaping U...
 
McKinsey European consumer sentiment survey: How current events are shaping I...
McKinsey European consumer sentiment survey: How current events are shaping I...McKinsey European consumer sentiment survey: How current events are shaping I...
McKinsey European consumer sentiment survey: How current events are shaping I...
 
McKinsey European consumer sentiment survey: How current events are shaping G...
McKinsey European consumer sentiment survey: How current events are shaping G...McKinsey European consumer sentiment survey: How current events are shaping G...
McKinsey European consumer sentiment survey: How current events are shaping G...
 
McKinsey European consumer sentiment survey: How current events are shaping F...
McKinsey European consumer sentiment survey: How current events are shaping F...McKinsey European consumer sentiment survey: How current events are shaping F...
McKinsey European consumer sentiment survey: How current events are shaping F...
 
McKinsey Survey: Japanese consumer sentiment during the coronavirus crisis
McKinsey Survey: Japanese consumer sentiment during the coronavirus crisisMcKinsey Survey: Japanese consumer sentiment during the coronavirus crisis
McKinsey Survey: Japanese consumer sentiment during the coronavirus crisis
 
McKinsey Survey: Australian consumer sentiment during the coronavirus crisis
McKinsey Survey: Australian consumer sentiment during the coronavirus crisisMcKinsey Survey: Australian consumer sentiment during the coronavirus crisis
McKinsey Survey: Australian consumer sentiment during the coronavirus crisis
 
McKinsey Survey: Indian consumer sentiment during the coronavirus crisis
McKinsey Survey: Indian consumer sentiment during the coronavirus crisisMcKinsey Survey: Indian consumer sentiment during the coronavirus crisis
McKinsey Survey: Indian consumer sentiment during the coronavirus crisis
 
McKinsey Survey: Korean consumer sentiment during the coronavirus crisis
McKinsey Survey: Korean consumer sentiment during the coronavirus crisisMcKinsey Survey: Korean consumer sentiment during the coronavirus crisis
McKinsey Survey: Korean consumer sentiment during the coronavirus crisis
 
McKinsey European consumer sentiment survey: How current events are shaping F...
McKinsey European consumer sentiment survey: How current events are shaping F...McKinsey European consumer sentiment survey: How current events are shaping F...
McKinsey European consumer sentiment survey: How current events are shaping F...
 
McKinsey European consumer sentiment survey: How current events are shaping U...
McKinsey European consumer sentiment survey: How current events are shaping U...McKinsey European consumer sentiment survey: How current events are shaping U...
McKinsey European consumer sentiment survey: How current events are shaping U...
 
McKinsey European consumer sentiment survey: How current events are shaping G...
McKinsey European consumer sentiment survey: How current events are shaping G...McKinsey European consumer sentiment survey: How current events are shaping G...
McKinsey European consumer sentiment survey: How current events are shaping G...
 
McKinsey European consumer sentiment survey: How current events in Europe are...
McKinsey European consumer sentiment survey: How current events in Europe are...McKinsey European consumer sentiment survey: How current events in Europe are...
McKinsey European consumer sentiment survey: How current events in Europe are...
 
McKinsey European consumer sentiment survey: How current events are shaping S...
McKinsey European consumer sentiment survey: How current events are shaping S...McKinsey European consumer sentiment survey: How current events are shaping S...
McKinsey European consumer sentiment survey: How current events are shaping S...
 
McKinsey European consumer sentiment survey: How current events are shaping I...
McKinsey European consumer sentiment survey: How current events are shaping I...McKinsey European consumer sentiment survey: How current events are shaping I...
McKinsey European consumer sentiment survey: How current events are shaping I...
 
McKinsey survey: European consumer sentiment survey: How current events are s...
McKinsey survey: European consumer sentiment survey: How current events are s...McKinsey survey: European consumer sentiment survey: How current events are s...
McKinsey survey: European consumer sentiment survey: How current events are s...
 
McKinsey survey: European consumer sentiment survey: How current events are s...
McKinsey survey: European consumer sentiment survey: How current events are s...McKinsey survey: European consumer sentiment survey: How current events are s...
McKinsey survey: European consumer sentiment survey: How current events are s...
 

Recently uploaded

Unlocking the Future: Explore Web 3.0 Workshop to Start Earning Today!
Unlocking the Future: Explore Web 3.0 Workshop to Start Earning Today!Unlocking the Future: Explore Web 3.0 Workshop to Start Earning Today!
Unlocking the Future: Explore Web 3.0 Workshop to Start Earning Today!Doge Mining Website
 
APRIL2024_UKRAINE_xml_0000000000000 .pdf
APRIL2024_UKRAINE_xml_0000000000000 .pdfAPRIL2024_UKRAINE_xml_0000000000000 .pdf
APRIL2024_UKRAINE_xml_0000000000000 .pdfRbc Rbcua
 
Call Us 📲8800102216📞 Call Girls In DLF City Gurgaon
Call Us 📲8800102216📞 Call Girls In DLF City GurgaonCall Us 📲8800102216📞 Call Girls In DLF City Gurgaon
Call Us 📲8800102216📞 Call Girls In DLF City Gurgaoncallgirls2057
 
8447779800, Low rate Call girls in Rohini Delhi NCR
8447779800, Low rate Call girls in Rohini Delhi NCR8447779800, Low rate Call girls in Rohini Delhi NCR
8447779800, Low rate Call girls in Rohini Delhi NCRashishs7044
 
8447779800, Low rate Call girls in Kotla Mubarakpur Delhi NCR
8447779800, Low rate Call girls in Kotla Mubarakpur Delhi NCR8447779800, Low rate Call girls in Kotla Mubarakpur Delhi NCR
8447779800, Low rate Call girls in Kotla Mubarakpur Delhi NCRashishs7044
 
Cyber Security Training in Office Environment
Cyber Security Training in Office EnvironmentCyber Security Training in Office Environment
Cyber Security Training in Office Environmentelijahj01012
 
Annual General Meeting Presentation Slides
Annual General Meeting Presentation SlidesAnnual General Meeting Presentation Slides
Annual General Meeting Presentation SlidesKeppelCorporation
 
Investment in The Coconut Industry by Nancy Cheruiyot
Investment in The Coconut Industry by Nancy CheruiyotInvestment in The Coconut Industry by Nancy Cheruiyot
Investment in The Coconut Industry by Nancy Cheruiyotictsugar
 
Memorándum de Entendimiento (MoU) entre Codelco y SQM
Memorándum de Entendimiento (MoU) entre Codelco y SQMMemorándum de Entendimiento (MoU) entre Codelco y SQM
Memorándum de Entendimiento (MoU) entre Codelco y SQMVoces Mineras
 
PSCC - Capability Statement Presentation
PSCC - Capability Statement PresentationPSCC - Capability Statement Presentation
PSCC - Capability Statement PresentationAnamaria Contreras
 
Marketplace and Quality Assurance Presentation - Vincent Chirchir
Marketplace and Quality Assurance Presentation - Vincent ChirchirMarketplace and Quality Assurance Presentation - Vincent Chirchir
Marketplace and Quality Assurance Presentation - Vincent Chirchirictsugar
 
TriStar Gold Corporate Presentation - April 2024
TriStar Gold Corporate Presentation - April 2024TriStar Gold Corporate Presentation - April 2024
TriStar Gold Corporate Presentation - April 2024Adnet Communications
 
The-Ethical-issues-ghhhhhhhhjof-Byjus.pptx
The-Ethical-issues-ghhhhhhhhjof-Byjus.pptxThe-Ethical-issues-ghhhhhhhhjof-Byjus.pptx
The-Ethical-issues-ghhhhhhhhjof-Byjus.pptxmbikashkanyari
 
Chapter 9 PPT 4th edition.pdf internal audit
Chapter 9 PPT 4th edition.pdf internal auditChapter 9 PPT 4th edition.pdf internal audit
Chapter 9 PPT 4th edition.pdf internal auditNhtLNguyn9
 
Church Building Grants To Assist With New Construction, Additions, And Restor...
Church Building Grants To Assist With New Construction, Additions, And Restor...Church Building Grants To Assist With New Construction, Additions, And Restor...
Church Building Grants To Assist With New Construction, Additions, And Restor...Americas Got Grants
 
Kenya Coconut Production Presentation by Dr. Lalith Perera
Kenya Coconut Production Presentation by Dr. Lalith PereraKenya Coconut Production Presentation by Dr. Lalith Perera
Kenya Coconut Production Presentation by Dr. Lalith Pereraictsugar
 
Digital Transformation in the PLM domain - distrib.pdf
Digital Transformation in the PLM domain - distrib.pdfDigital Transformation in the PLM domain - distrib.pdf
Digital Transformation in the PLM domain - distrib.pdfJos Voskuil
 
8447779800, Low rate Call girls in Uttam Nagar Delhi NCR
8447779800, Low rate Call girls in Uttam Nagar Delhi NCR8447779800, Low rate Call girls in Uttam Nagar Delhi NCR
8447779800, Low rate Call girls in Uttam Nagar Delhi NCRashishs7044
 

Recently uploaded (20)

Unlocking the Future: Explore Web 3.0 Workshop to Start Earning Today!
Unlocking the Future: Explore Web 3.0 Workshop to Start Earning Today!Unlocking the Future: Explore Web 3.0 Workshop to Start Earning Today!
Unlocking the Future: Explore Web 3.0 Workshop to Start Earning Today!
 
APRIL2024_UKRAINE_xml_0000000000000 .pdf
APRIL2024_UKRAINE_xml_0000000000000 .pdfAPRIL2024_UKRAINE_xml_0000000000000 .pdf
APRIL2024_UKRAINE_xml_0000000000000 .pdf
 
Call Us 📲8800102216📞 Call Girls In DLF City Gurgaon
Call Us 📲8800102216📞 Call Girls In DLF City GurgaonCall Us 📲8800102216📞 Call Girls In DLF City Gurgaon
Call Us 📲8800102216📞 Call Girls In DLF City Gurgaon
 
8447779800, Low rate Call girls in Rohini Delhi NCR
8447779800, Low rate Call girls in Rohini Delhi NCR8447779800, Low rate Call girls in Rohini Delhi NCR
8447779800, Low rate Call girls in Rohini Delhi NCR
 
8447779800, Low rate Call girls in Kotla Mubarakpur Delhi NCR
8447779800, Low rate Call girls in Kotla Mubarakpur Delhi NCR8447779800, Low rate Call girls in Kotla Mubarakpur Delhi NCR
8447779800, Low rate Call girls in Kotla Mubarakpur Delhi NCR
 
Cyber Security Training in Office Environment
Cyber Security Training in Office EnvironmentCyber Security Training in Office Environment
Cyber Security Training in Office Environment
 
Enjoy ➥8448380779▻ Call Girls In Sector 18 Noida Escorts Delhi NCR
Enjoy ➥8448380779▻ Call Girls In Sector 18 Noida Escorts Delhi NCREnjoy ➥8448380779▻ Call Girls In Sector 18 Noida Escorts Delhi NCR
Enjoy ➥8448380779▻ Call Girls In Sector 18 Noida Escorts Delhi NCR
 
Annual General Meeting Presentation Slides
Annual General Meeting Presentation SlidesAnnual General Meeting Presentation Slides
Annual General Meeting Presentation Slides
 
No-1 Call Girls In Goa 93193 VIP 73153 Escort service In North Goa Panaji, Ca...
No-1 Call Girls In Goa 93193 VIP 73153 Escort service In North Goa Panaji, Ca...No-1 Call Girls In Goa 93193 VIP 73153 Escort service In North Goa Panaji, Ca...
No-1 Call Girls In Goa 93193 VIP 73153 Escort service In North Goa Panaji, Ca...
 
Investment in The Coconut Industry by Nancy Cheruiyot
Investment in The Coconut Industry by Nancy CheruiyotInvestment in The Coconut Industry by Nancy Cheruiyot
Investment in The Coconut Industry by Nancy Cheruiyot
 
Memorándum de Entendimiento (MoU) entre Codelco y SQM
Memorándum de Entendimiento (MoU) entre Codelco y SQMMemorándum de Entendimiento (MoU) entre Codelco y SQM
Memorándum de Entendimiento (MoU) entre Codelco y SQM
 
PSCC - Capability Statement Presentation
PSCC - Capability Statement PresentationPSCC - Capability Statement Presentation
PSCC - Capability Statement Presentation
 
Marketplace and Quality Assurance Presentation - Vincent Chirchir
Marketplace and Quality Assurance Presentation - Vincent ChirchirMarketplace and Quality Assurance Presentation - Vincent Chirchir
Marketplace and Quality Assurance Presentation - Vincent Chirchir
 
TriStar Gold Corporate Presentation - April 2024
TriStar Gold Corporate Presentation - April 2024TriStar Gold Corporate Presentation - April 2024
TriStar Gold Corporate Presentation - April 2024
 
The-Ethical-issues-ghhhhhhhhjof-Byjus.pptx
The-Ethical-issues-ghhhhhhhhjof-Byjus.pptxThe-Ethical-issues-ghhhhhhhhjof-Byjus.pptx
The-Ethical-issues-ghhhhhhhhjof-Byjus.pptx
 
Chapter 9 PPT 4th edition.pdf internal audit
Chapter 9 PPT 4th edition.pdf internal auditChapter 9 PPT 4th edition.pdf internal audit
Chapter 9 PPT 4th edition.pdf internal audit
 
Church Building Grants To Assist With New Construction, Additions, And Restor...
Church Building Grants To Assist With New Construction, Additions, And Restor...Church Building Grants To Assist With New Construction, Additions, And Restor...
Church Building Grants To Assist With New Construction, Additions, And Restor...
 
Kenya Coconut Production Presentation by Dr. Lalith Perera
Kenya Coconut Production Presentation by Dr. Lalith PereraKenya Coconut Production Presentation by Dr. Lalith Perera
Kenya Coconut Production Presentation by Dr. Lalith Perera
 
Digital Transformation in the PLM domain - distrib.pdf
Digital Transformation in the PLM domain - distrib.pdfDigital Transformation in the PLM domain - distrib.pdf
Digital Transformation in the PLM domain - distrib.pdf
 
8447779800, Low rate Call girls in Uttam Nagar Delhi NCR
8447779800, Low rate Call girls in Uttam Nagar Delhi NCR8447779800, Low rate Call girls in Uttam Nagar Delhi NCR
8447779800, Low rate Call girls in Uttam Nagar Delhi NCR
 

McKinsey Survey: US consumer sentiment during the coronavirus crisis

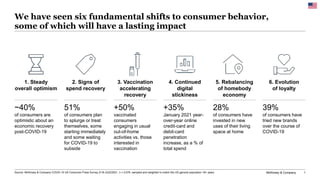
  • 1. McKinsey & Company 1 We have seen six fundamental shifts to consumer behavior, some of which will have a lasting impact Source: McKinsey & Company COVID-19 US Consumer Pulse Survey 2/18–2/22/2021, n = 2,076, sampled and weighted to match the US general population 18+ years +35% January 2021 year- over-year online credit-card and debit-card penetration increase, as a % of total spend 51% of consumers plan to splurge or treat themselves, some starting immediately and some waiting for COVID-19 to subside 39% of consumers have tried new brands over the course of COVID-19 28% of consumers have invested in new uses of their living space at home +50% vaccinated consumers engaging in usual out-of-home activities vs. those interested in vaccination ~40% of consumers are optimistic about an economic recovery post-COVID-19 4. Continued digital stickiness 2. Signs of spend recovery 5. Rebalancing of homebody economy 6. Evolution of loyalty 3. Vaccination accelerating recovery 1. Steady overall optimism
  • 2. McKinsey & Company 2 Confidence in own country’s economic recovery after COVID-191 % of respondents 10 14 18 17 32 21 31 20 25 37 43 46 53 59 50 62 52 67 71 61 47 39 30 24 18 17 17 12 4 2 14 45 41 Mixed: The economy will be impacted for 6–12 months or longer and will stagnate or show slow growth thereafter Pessimistic: COVID-19 will have lasting impact on the economy and show regression/ fall into lengthy recession Optimistic: The economy will rebound within 2–3 months and grow just as strong as or stronger than before COVID-19 The United States is more optimistic than European countries but less so than India, China, or Mexico Steady overall optimism 1 Q: What is your overall confidence level surrounding economic conditions after the coronavirus (COVID-19) crisis subsides (i.e., once there is herd immunity)? Rated from 1 “very optimistic” to 6 “very pessimistic.” Bars may not sum to 100% due to rounding. 2.China’s increase in optimism was compared to September instead of November. US India China Brazil Germany UK Spain Italy France Japan 2/18–22 2/20–3/3 2/20–3/8 2/20–3/1 2/23–27 2/23–27 2/23–27 2/23–27 2/23–27 2/24–27 Source: McKinsey & Company COVID-19 Consumer Pulse Survey Mexico 2/20–3/2 0 +9 +9 +3 +6 +13 +1 +7 +4 +3 +5 X Increase in optimism since November 2020, percentage point2
  • 3. McKinsey & Company 3 Confidence in own country’s economic recovery after COVID-191 % of respondents 13% 16% 14% 15% 16% 16% 16% 15% 15% 20% 18% 17% 18% 19% 21% 17% 17% 14% 13% 14% 43% 45% 45% 47% 46% 48% 48% 52% 52% 49% 49% 49% 47% 46% 46% 46% 45% 44% 46% 45% 44% 39% 41% 37% 39% 35% 36% 33% 34% 32% 33% 34% 36% 35% 32% 36% 39% 42% 41% 41% Apr 27– May 3 Mar 16–17 Mar 20–22 Mar 23–29 Jul 30– Aug 2 Mar 30– Apr 5 April 6–12 Apr 13–19 May 18–24 May 4–10 May 11–17 Sep 18–24 Jun 1–7 Apr 20–26 Jun 15–21 Jul 7–12 Aug 19–23 Oct 23–27 Nov 9–13 Feb 18-22 Mixed: The economy will be impacted for 6–12 months or longer and will stagnate or show slow growth thereafter Pessimistic: COVID-19 will have lasting impact on the economy and show regression / fall into lengthy recession Optimistic: The economy will rebound within 2–3 months and grow just as strong as or stronger than before COVID-19 Optimism regarding US economic recovery has improved since the height of the pandemic, but has remained stable since September Steady overall optimism 1 Q: What is your overall confidence level surrounding economic conditions after the coronavirus (COVID-19) crisis subsides (i.e., once there is herd immunity)? Rated from 1 “very optimistic” to 6 “very pessimistic.” Figures may not sum to 100% because of rounding. Source: McKinsey & Company COVID-19 US Consumer Pulse Survey 2/18–2/22/2021, n = 2,076; 11/9–11/13/2020, n = 2,024; 10/23–10/27/2020, n = 2,021; 9/18–9/24/2020, n = 1,026; 8/19–8/23/2020, n = 2,026; 7/30–8/2/2020, n = 2,024; 7/7–7/12/2020, n = 1,923; 6/15–6/21/2020, n = 2,006; 6/1–6/7/2020, n = 1,966; 5/18–5/24/2020, n = 1,975; 5/11–5/17/2020, n = 2,002; 5/4–5/10/2020, n = 1,993; 4/27–5/3/2020, n = 2,105; 4/20–4/26/2020, n = 1,052; 4/13–4/19/2020, n = 1,052; 4/6–4/12/2020, n = 1,063; 3/30–4/5/2020, n = 1,484; 3/23–3/29/2020, n = 1,119; 3/20–3/22/2020, n = 1,073; 3/16–3/17/2020, n = 1,042; sampled and weighted to match the US general population 18+ years 2020 2021
  • 4. McKinsey & Company 4 Consumers engaging in “normal” out-of-home activities1 % of respondents Engagement in out-of-home activities has leveled off in recent months, with notable differences by generation and vaccination openness/status Steady overall optimism 33 36 36 36 32 30 27 20 May 24 Jul 12 Feb 22 Sep 24 Nov 13 Jun 21 Oct 27 Aug 23 Overall Cautious Unlikely 33% Vaccinated Interested 54% 29% 22% Baby boomers Gen Z 28% Millennials Gen X 28% 35% 38% Medium ($50K–$100K) Low (<$50K) High (>$100K) 35% 30% 33% ~33% of vaccinated people are doing out-of-home activities ~37% of millennials are doing out-of-home activities By generation2 By income By vaccination adoption3 30–35% of all income groups are doing out-of-home activities 1 Q: Which best describes when you will regularly return to stores, restaurants, and other out-of-home activities? Chart shows those already participating in these activities. 2 Members of Gen Z were born from 1997–2012, millennials from 1981-1996, Gen X from 1965–1980, and baby boomers from 1946–1964. The Traditionalist/Silent Generation is not included due to a low sample size. 3 Category definitions: Vaccinated = “I have already received at least one shot”; Interested = “I am likely / very likely to get vaccinated”; Cautious = “I am somewhat likely / somewhat unlikely to get vaccinated”; Unlikely = “I am unlikely / very unlikely to get vaccinated.” Source: McKinsey & Company COVID-19 US Consumer Pulse Survey 2/18–2/22/2021, n = 2,076; 11/9–11/13/2020, n = 2,024; 10/23–10/27/2020, n = 2,021; 9/18–9/24/2020, n = 1,026; 8/19–8/23/2020, n = 2,026; 7/7–7/12/2020, n = 1,923; 6/15–6/21/2020, n = 2,006; 5/18–5/24/2020, n = 1,975; sampled and weighted to match the US general population 18+ years
  • 5. McKinsey & Company 5 While most consumers limit out-of-home activities now, they expect to visit friends, shop, and dine out more once COVID-19 subsides Steady overall optimism Out-of-home activities done in the past two weeks1 % of respondents who did activity within last 2 weeks +17 +39 +50 +25 +8 +29 +6 +8 +25 +9 +15 +23 +24 +29 +36 +1 +12 +27 +42 +37 Net intent: 1–15 Net intent: 16–30 Net intent: 31–50 Source: McKinsey & Company COVID-19 US Consumer Pulse Survey 2/18–2/22/2021, n = 2,076, sampled and weighted to match the US general population 18+ years 1 Q: Did you leave your house for the following activities over the past two weeks? Responder % is based on those who previously selected “Yes” to having done the activity once per year prior to the COVID-19 crisis. 2 Q: Once the coronavirus (COVID-19) crisis subsides (i.e., once there is herd immunity), how do you think the amount of time you spend doing the following activities will change relative to how often you did them before COVID-19 began? Possible answers: “I will not do this at all”; “I will do this less often than I did before COVID-19 started”; “I will do this about the same as I did before COVID-19”; “I will do this more than I did before COVID-19.” Net intent is calculated from adding % of respondents stating they will do more or about the same, and subtracting % of respondents stating they will do less or not at all. Net intent post- COVID-192 Net intent post- COVID-192 30 Go to a hair or nail salon Attend an outdoor event Go to the gym or fitness studio Dine at a restaurant or bar Visit a crowded outdoor public place 12 Get together with family 9 10 Go out for family entertainment Attend an indoor cultural event Get together with friends 35 15 30 24 35 13 Use public transportation Shop for non-necessities Work outside my home Travel more than 2 hrs by car Shop for groceries/necessities Use ride-sharing service Go to a shopping mall Travel by train Rent a short-term home Stay in a hotel Travel by airplane 22 50 81 59 25 28 26 22 15 11 Work Shopping Transport/ Travel Social Personal care Entertain -ment
  • 6. McKinsey & Company 6 Early signs of spend recovery are expected to continue with stimulus checks deployment and consumers’ eagerness to splurge 3. Consumers are eager to spend and splurge 2. Stimulus payments and holiday pull-through have influenced the recovery 1. Spend is fluctuating but showing an upward trend Year-on-year credit-card spend September to February was flat vs. a contraction of 8% during March to August ~15–20% Uplift in spend from stimulus recipients the first weeks after the stimulus payment 51% of consumers plan to splurge or treat themselves, some starting immediately and some waiting for COVID-19 to subside Signs of spend recovery Source: McKinsey & Company COVID-19 US Consumer Pulse Survey 2/18–2/22/2021, n = 2,076, sampled and weighted to match the US general population 18+ years; Affinity Solutions credit-card and debit- card spend data from 2/2019–1/2021; Earnest Research “Impact of Stimulus Payments on Consumer Spending” February 2021 Flat year-on-year spend
  • 7. McKinsey & Company 7 Spend has shown early signs of recovery in the past six months, aided by holiday pull-through and stimulus payments Signs of spend recovery Year-over-year credit-card spend,1 % Source: Affinity Solutions credit-card and debit-card spend data from 2/2019–2/2021; Earnest Research “Impact of Stimulus Payments on Consumer Spending” February 2021 1 Includes credit-card and some debit-card spending data among banked consumers; does not include cash. Year-over-year growth in monthly sales during current period (2/2020–2/2021) compared to monthly sales in prior period (2/2019–2/2020). 2 Year-over-year spend in March–August 2020 decreased by 8% compared to same period in previous year, whereas September–February remained flat compared to same period in previous year. 3 Year-over-year change in spend for stimulus recipients versus those who did not receive stimulus payments. 10% -6% -18% -9% -6% -5% -3% 1% 2% 1% -2% 3% -4% Feb Mar Apr Jan Jun May Jul Aug Sep Oct Nov Dec Feb First round of stimulus payment Second round of stimulus payment Holiday pull- forward spend Spend is fluctuating but showing an upward trend Stimulus payments and holiday-influenced recovery Those who received stimulus money in April/May and January showed a 15–20% uplift in spend.3 Early holiday shopping in October and November helped support positive growth in those months. Mar-Aug 6 month YoY: –8%2 Sep-Feb 6 month YoY: 0%2
  • 8. McKinsey & Company 8 Around half of US consumers plan to spend extra to splurge or treat themselves, with notable differences by income and generation Signs of spend recovery Expected leisure spend in 20211 % of respondents who plan to splurge or treat themselves ~51% Plan to splurge or treat themselves 45% Vaccinated Interested 45% Unlikely Cautious 56% 54% Gen X Gen Z 48% Millennials 68% Baby boomers 59% 35% 38% Low (<$50K) Mid ($50K–$100K) High (>$100K) 51% 67% 1 Q: With regard to products and services you will spend money on, do you plan to splurge/treat yourself in 2021? Figures may not sum to 100% because of rounding. 2 Members of Gen Z were born from 1997–2012, millennials from 1981-1996, Gen X from 1965–1980, and baby boomers from 1946–1964. The Traditionalist/Silent Generation is not included due to a low sample size. 3 Category definitions: Vaccinated = “I have already received at least one shot”; Interested = “I am likely / very likely to get vaccinated”; Cautious = “I am somewhat likely / somewhat unlikely to get vaccinated”; Unlikely = “I am unlikely / very unlikely to get vaccinated.” ~67% of millennials By generation2 ~67% of more wealthy households By income ~56% of fully or partially vaccinated people By vaccination adoption3 Source: McKinsey & Company COVID-19 US Consumer Pulse Survey 2/18–2/22/2021, n = 2,076, sampled and weighted to match the US general population 18+ years
  • 9. McKinsey & Company 9 High-income millennials intend to splurge the most, but intent is also high among Gen Z, all millennials and higher-income Gen X Signs of spend recovery >70% <30% 50–70% 30–49% 32% 50% 53% 29% 51% 66% 63% 34% 65% 82% 66% 46% 1 Q: With regard to products and services you will spend money on, do you plan to splurge/treat yourself in 2021? Figures may not sum to 100% because of rounding. 2 Members of Gen Z were born from 1997–2012, millennials from 1981-1996, Gen X from 1965–1980, and baby boomers from 1946–1964. The Traditionalist/Silent Generation is not included due to a low sample size. Source: McKinsey & Company COVID-19 US Consumer Pulse Survey 2/18–2/22/2021, n = 2,076, sampled and weighted to match the US general population 18+ years Expected leisure spend in 20211 % of respondents who plan to treat themselves or splurge ~51% Plan to splurge or treat themselves Gen Z Millennials Gen X Generation2 Mid Low High Baby boomers Household income ($50–$100K/year) (<$50K/year) (>$100K/year)
  • 10. McKinsey & Company 10 This extra spend is expected across categories, and more than half of consumers plan to treat themselves before COVID-19 subsides Signs of spend recovery Expected leisure categories on which people plan to splurge or treat themselves in 20211 % of respondents who plan to splurge or treat themselves 46 44 43 37 32 30 28 28 27 Out-of-home entertainment Restaurants, dining out, bars ​Apparel, shoes, accessories Travel, lodging, vacation Beauty & personal care Electronics Items for your home Household essentials Fitness, sports, outdoors Trigger for when people plan to splurge or treat themselves2 % of respondents who plan to splurge or treat themselves on that category 24 16 32 29 32 37 15 26 20 22 26 23 26 21 20 27 22 28 15 13 13 12 14 10 14 18 17 40 45 32 34 33 34 44 34 36 Anytime Family is vaccinated Govt restrictions lifted / COVID-19 stops spreading I am vaccinated 1 Q: You mentioned that you plan to splurge/treat yourself in 2021. Which categories do you intend to treat yourself to? Please select all that apply. 2 Q: Which best describes when you will most likely splurge/treat yourself? Figures may not sum to 100% because of rounding. Source: McKinsey & Company COVID-19 US Consumer Pulse Survey 2/18–2/22/2021, n = 2,076, sampled and weighted to match the US general population 18+ years
  • 11. McKinsey & Company 11 -80 -20 -10 -30 -70 0 -60 -50 -40 10 20 Jun 21 Mar 22 Apr 19 Jun 7 Mar 17 Mar 29 Apr 5 Jul 12 Apr 12 Apr 26 May 3 May 10 May 17 May 24 Aug 2 Aug 23 Oct 23 Sep 24 Nov 9 Feb 22 Expected spending per category over the next two weeks compared to usual1 Net intent2 While net intent for discretionary spend is still negative, spend intent has recovered steadily since April 2020 Signs of spend recovery ​Personal-care products Groceries Household supplies Skin care & makeup Consumer electronics Fitness & wellness Apparel International flights Domestic flights Out-of-home entertainment Source: McKinsey & Company COVID-19 US Consumer Pulse Survey 2/18–2/22/2021, n = 2,076; 11/9–11/13/2020, n = 2,024; 10/23–10/27/2020, n = 2,021; 9/18–9/24/2020, n = 1,026; 8/19–8/23/2020, n = 2,026; 7/30–8/2/2020, n = 2,024; 7/7–7/12/2020, n = 1,923; 6/15–6/21/2020, n = 2,006; 6/1–6/7/2020, n = 1,966; 5/18–5/24/2020, n = 1,975; 5/11–5/17/2020, n = 2,002; 5/4–5/10/2020, n = 1,993; 4/27–5/3/2020, n = 2,105; 4/20–4/26/2020, n = 1,052; 4/13– 4/19/2020, n = 1,052; 4/6–4/12/2020, n = 1,063; 3/30–4/5/2020, n = 1,484; 3/23–3/29/2020, n = 1,119; 3/20–3/22/2020, n = 1,073; 3/16–3/17/2020, n = 1,042; sampled and weighted to match the US general population 18+ years 1 Q: Over the next two weeks, do you expect that you will spend more, about the same, or less money on these categories than usual? Figures may not sum to 100% because of rounding. 2 Net intent is calculated by subtracting the % of respondents stating they expect to decrease spending from the % of respondents stating they expect to increase spending.
  • 12. McKinsey & Company 12 Consumers indicate they will spend extra on travel and mobility, out-of-home entertainment, and restaurants after the pandemic Signs of spend recovery 1 Q: Over the next two weeks, do you expect that you will spend more, about the same, or less money on these categories than usual? 2 Q: Once the COVID-19 crisis subsides (i.e., once there is herd immunity), do you expect that you will spend more, about the same, or less money on these categories than during the COVID-19 pandemic? 3 Net intent is calculated by subtracting the % of respondents stating they expect to decrease spending from the % of respondents stating they expect to increase spending. Source: McKinsey & Company COVID-19 US Consumer Pulse Survey 2/18–2/22/2021, n = 2,076, sampled and weighted to match the US general population 18+ years –15 to 0 Below –15 Above +1 Below 0 Above +25 +15 to +25 0 to +15 Net intent3 Post- COVID-19 Next 2 weeks Evolution Groceries/food for home 11 17 Household supplies 6 4 Tobacco products & smoking supplies -4 -3 Food takeout & delivery -10 -10 Meal at quick-service restaurants -6 -13 Toys & baby supplies -1 -15 Personal-care products 4 0 Jewelry -13 -35 Meal at restaurant 13 -27 Apparel 0 -32 Kitchen & dining -4 -21 Footwear -4 -31 Skin care & makeup 0 -21 Home decor & furniture -7 -32 Home improvement & gardening supplies 8 -17 ​Sports/outdoors equipment & supplies 0 -26 Accessories (e.g., handbags, sunglasses) -7 -35 Net intent3 Next 2 weeks Post- COVID-19 Evolution Pet food & supplies 2 5 ​Vitamins, supplements, OTC medicines 1 7 Domestic flights -40 14 Hotel/resort stays -42 10 Adventures & tours -27 18 Entertainment out of home -32 16 Pet-care services -9 3 Fitness & wellness services (e.g., gym) -12 8 Personal-care services (e.g., hair salon) -19 4 Gasoline 1 25 Short-term apartment or house rental -29 13 Cruises -21 18 Travel by car -16 21 International flights -26 20 ​Books, magazines, newspapers -11 -4 Consumer electronics -30 -5 Entertainment at home 1 0 Vehicles -15 -3 Expected spending per category over the next two weeks1 compared to post-COVID-192 % of respondents
  • 13. McKinsey & Company 13 Vaccinated people are more confident that their routines and finances will return to normal by the end of 2021 Vaccination accelerating recovery 34 36 26 32 52 42 42 39 71 78 86 68 7 4 12 27 68 66 52 40 Vaccinated 67 Unlikely Interested Cautious 75 64 70 Already back to normal By Dec 2021 Overindexed on rural consumers vs all respondents (index 116) 1 Q: When do you expect your routines will return to normal? Figures may not sum to 100% because of rounding. 2 Q: When do you expect your personal/household finances will return to normal? Figures may not sum to 100% because of rounding. 3 Q: How likely are you to get the coronavirus vaccine once it is made available to you? Rated from 1 “not at all likely” to 6 “very likely,” including “I have received the first dose of the vaccine (partially vaccinated)” and “I have already received both doses of the vaccine (fully vaccinated).” Bars may not sum to 100% due to rounding. Respondents who stated “very likely” (6) and “likely” (5) are considered “interested”; respondents who stated “somewhat likely” (4) or “somewhat unlikely” (3) are considered “cautious”; respondents who stated “unlikely” (2) or “very unlikely” (1) are considered “unlikely.” Source: McKinsey & Company COVID-19 US Consumer Pulse Survey 2/18–2/22/2021, n = 2,076, sampled and weighted to match the US general population 18+ years Expectations on routines returning to normal1,3 % of respondents Expectations on finances returning to normal2,3 % of respondents
  • 14. McKinsey & Company 14 Vaccinated consumers are beginning to return to out-of-home activities and spend at near pre-pandemic levels Vaccination accelerating recovery Already engaging in out-of-home activity2 Vaccination status1 1 Q: How likely are you to get the coronavirus vaccine once it is made available to you? Rated from 1 “not at all likely” to 6 “very likely,” including “I have received the first dose of the vaccine (partially vaccinated)” and “I have already received both doses of the vaccine (fully vaccinated).” Bars may not sum to 100% due to rounding. Respondents who stated “very likely” (6) and “likely” (5) are considered “interested”; respondents who stated “somewhat likely” (4) or “somewhat unlikely” (3) are considered “cautious”; respondents who stated “unlikely” (2) or “very unlikely” (1) are considered “unlikely.” 2 Q: Which best describes when you will regularly return to stores, restaurants, and other out-of-home activities? Chart shows those already participating in these activities. 3 Q: Over the next 2 weeks, do you expect that you will spend more, about the same or less money on these categories than usual? 4 Net intent is calculated by subtracting the % of respondents stating they expect to decrease spending from the % of respondents stating they expect to increase spending. It is then multiplied by the % of people who respond as typically purchasing in that category, to effectively weight the average across categories. Source: McKinsey & Company COVID-19 US Consumer Pulse Survey 2/18–2/22/2021, n = 2,076, sampled and weighted to match the US general population 18+ years 19% 11% 24% 28% 15% 12% 33% 30% Net spend intent next 2 weeks over usual3 Spend Less Spend more Spend the same 33% 22% 29% 54% Net intent4 -4 -13 -20 -19 27% increase in net intent to spend in next 2 weeks for those vaccinated vs those interested in vaccination 50% more vaccinated consumers say they are engaging in usual out-of- home activities vs those interested in vaccination Vaccinated Interested Cautious Unlikely
  • 15. McKinsey & Company 15 Although still cautious, vaccinated consumers have engaged in more out-of-home activities than ‘vaccine interested’ consumers Vaccination accelerating recovery Out-of-home activities done in the past two weeks by those vaccinated1 % of respondents who did activity within last 2 weeks 17 Get together with family Go to the gym or fitness studio Dine at a restaurant or bar Attend an outdoor event Go out for family entertainment Visit a crowded outdoor public place 35 Attend an indoor cultural event Go to a hair or nail salon Get together with friends 39 23 18 18 32 32 25 Use public transportation Shop for groceries/necessities Travel more than 2 hrs by car Shop for non-necessities 24 Work outside my home Travel by train Go to a shopping mall Use ride-sharing service Rent a short-term home Travel by airplane 25 Stay in a hotel 62 80 18 56 33 36 23 22 17 Increase over those interested in being vaccinated2 1.3x 1.1x 1.0x 1.6x 1.4x 1.5x 1.0x 2.0x 2.4x 1.6x 1.7x Work Shopping Transport/ Travel Social Personal care Entertain -ment 2.6x 1.8x 2.7x 1.3x 2.9x 1.2x 1.4x 1.0x 1.2x 1 Q: Did you leave your house for the following activities over the past two weeks? Showing respondents who selected “yes” and also reported as being at least partially vaccinated. The responder base is comprised only of those who have answered as having done the activity at least once per year prior to COVID-19. 2 Increase in having done the activity is determined between those who indicate being at least partially vaccinated and those who indicate as only “interested” in being vaccinated. Increase: Below 1x Increase: 1x Difference: 2x+ Source: McKinsey & Company COVID-19 US Consumer Pulse Survey 2/18–2/22/2021, n = 2,076, sampled and weighted to match the US general population 18+ years Increase over those interested in being vaccinated2 Increase: 1.1–1.9x
  • 16. McKinsey & Company 16 -2% 1 Net intent is calculated by subtracting the % of respondents stating they expect to decrease spending from the % of respondents stating they expect to increase spending. 2 Q: Over the next 2 weeks, do you expect that you will spend more, about the same or less money on these categories than usual? Source: McKinsey & Company COVID-19 US Consumer Pulse Survey 2/18–2/22/2021, n = 2,076, sampled and weighted to match the US general population 18+ years Footwear -20% -31% Apparel -28% -31% Home improvement & gardening supplies -5% -17% Kitchen & dining -4% -18% Skin care & makeup -13% -19% Food takeout & delivery -1% -5% Tobacco products & smoking supplies 9% 2% Personal-care products 3% 1% Groceries/food for home 19% 19% Meal at quick-service restaurants 2% -17% Meal at restaurant -12% -30% Accessories (e.g., handbags, sunglasses) -21% -34% -16% Jewelry -33% Toys & baby supplies 6% -17% Home decor & furniture -16% -32% Sports/outdoors equipment & supplies -8% -27% Pet food & supplies 6% 7% Vitamins, supplements, OTC medicines 8% 3% Domestic flights -41% -41% Hotel/resort stays -31% -44% Adventures & tours -20% -27% Pet-care services 2% -6% Gasoline 6% -4% Short-term apartment or house rental -24% -26% Cruises -15% -24% Books, magazines, newspapers -1% -4% Consumer electronics -20% -30% Entertainment at home 8% 8% Vehicles -11% Entertainment out of home -17% -32% Fitness & wellness services (e.g., gym) 4% -11% Personal-care services (e.g., hair salon) -1% -21% Travel by car -4% -19% International flights -10% -29% Household supplies 5% 9% Vaccinated consumers have a higher net intent to spend, including for restaurants, in-person services, and out-of-home entertainment Vaccination accelerating recovery Net intent1 for expected spending per category over the next two weeks compared to usual2 Net intent between 0 and –15 Net intent below –15 Net intent Above +1 Below 1 Categories with >10 percentage-point increase in net intent for interested consumers vs cautious consumers +1 to +9 –/+1 For vaccinated consumers vs those interested in receiving the vaccine Net intent2 Net intent2 Vaccinated Interested Difference Vaccinated Interested Difference
  • 17. McKinsey & Company 17 Consumers indicate that new digital behaviors developed during the COVID-19 pandemic will stick 3. Sticky behaviors across in-home entertainment and digital wellness 2. Sustained use of novel purchasing methods 1. Increased online purchasing +35% Overall increase in online penetration, based on credit-card and debit-card spend ~70–80% of consumers who accelerated their digital health/wellness engagement say they will continue post-COVID-19 +60% growth in restaurant/store curbside pickup during COVID-19, ~50% expect to continue using it Continued digital stickiness Source: McKinsey & Company COVID-19 US Consumer Pulse Survey 2/18–2/22/2021, n = 2,076, sampled and weighted to match the US general population 18+ years; Affinity Solutions credit-card and debit- card spend data from 2/2019–1/2021; Facteus debit-card spend data from 2/2019–1/2021
  • 18. McKinsey & Company 18 Online spend penetration has accelerated in the past 12 months across categories, sustaining April’s peak +35% Year-over-year increase in online penetration, based on credit-card and debit- card spend 19% 18% 20% 27% 27% 25% 25% 25% 24% 24% 28% 29% 26% Aug Jan 2020 Feb Mar May Apr Jun Jul Sep Oct Nov Dec Jan 2021 +35% Retail-oriented online credit-card and debit-card spend as percent of total1 Source: Affinity Solutions credit-card and debit-card spend data from 2/2019–1/2021; Facteus debit-card spend data from 2/2019–1/2021 1 Year-over-year growth of total sales in last 12 months (2/2020–1/2021) compared to total sales in the prior 12 months (2/2019–1/2020); including the following retailer categories: Amazon, apparel, software & electronics, cosmetic stores; pet shops, home stores, mass stores, club stores, restaurants, grocery stores, drug stores, discount stores. Continued digital stickiness
  • 19. McKinsey & Company 19 Retail saw online sales increase during COVID-19; categories with already high online penetration saw a dramatic spike during April’s lockdowns 37% 81% 48% 2021 (Jan) Pre- COVID-19 (Jan/Feb 2020) Apr 2020 spike +29% 8% 14% 14% Pre- COVID-19 (Jan/Feb 2020) Apr 2020 spike 2021 (Jan) +65% 3% 6% 6% Apr 2020 spike Pre- COVID-19 (Jan/Feb 2020) 2021 (Jan) +112% Continued digital stickiness Source: Affinity Solutions credit-card and debit-card spend data from 2/2019–1/2021; Facteus debit-card spend data from 2/2019–1/2021 1“High online penetration retail categories” includes those with >20% pre-COVID-19 internet penetration, i.e., apparel, software & electronics, cosmetic stores; pet shops. 2 “Medium online penetration retail categories” includes those with 7–20% pre-COVID-19 internet penetration, i.e., home stores, mass stores, club stores. 3“Low online penetration retail categories” includes those with <7% pre-COVID-19 internet penetration, i.e., restaurants, grocery stores, drug stores, discount stores. 4 Certain retailers (e.g., Amazon) don’t have categories broken down within credit card and debit card data. Amazon is not included in these groupings. Online sales as a % of overall sales for credit-card and debit-card spend1,2,3,4 High pre-COVID-19 penetration (>20%)1 Moderate pre-COVID-19 penetration (7–20%)2 Low pre-COVID-19 penetration (<7%)3
  • 20. McKinsey & Company 20 Consumers expect more digital acceleration in categories such as apparel, consumer electronics, and pet supplies Greater online presence Less-accelerated online shift Sustained shift to online Net intent to continue to purchase online after COVID-191,3 Percent of users who intend to keep doing activity after COVID-19 at same or higher level Penetration since COVID-19 2 1 Q: Will you continue to purchase these categories online after the COVID-19 situation subsides (i.e., once there is herd immunity)? Possible answers: “no, I will stop purchasing online altogether”; “buy less online”; “buy about the same amount online”; and “buy more online.” Number indicates net intent, calculated by subtracting % of respondents stating they expect to decrease or stop use from % of respondents stating they expect to increase or maintain use. 2 Q: Have you purchased the following categories online since the coronavirus (COVID-19) began? Please select yes or no for each category. Includes % respondents who selected “yes” for the category. 3 Thresholds of categories are defined by the tercile. The first tercile of intent occurs at 18%, and the second occurs at 26%. Continued digital stickiness Source: McKinsey & Company COVID-19 US Consumer Pulse Survey 2/18–2/22/2021, n = 2,076, sampled and weighted to match the US general population 18+ years 75 12 25 20 15 9 16 27 10 21 42 11 13 14 17 18 19 45 65 22 23 37 24 26 28 29 80 30 35 31 43 32 55 33 34 36 38 39 40 41 44 30 35 50 Food takeout & delivery Home decor & furniture Pet supplies Personal-care products Groceries Alcoholic beverages Apparel Household supplies Pet-care services Kitchen Accessories Home improvement Personal-care services Fitness & wellness services Sports & outdoors equipment Skin care & makeup Jewelry Footwear Consumer electronics Entertainment out of home Adventures & tours Books Tobacco products Vitamins, supplements, OTC medicines Toys & baby supplies
  • 21. McKinsey & Company 21 Intent to use after COVID-191 Percent of users who intend to keep doing activity after COVID-19 Consumers say most food-related pickup and delivery works; social shopping, apps, and plug-ins have a smaller but loyal following Source: McKinsey & Company COVID-19 US Consumer Pulse Survey 2/18–2/22/2021, n = 2,076, sampled and weighted to match the US general population 18+ years 1 Q: Compared to now, will you do or use the following more, less, or not at all, once the coronavirus (COVID-19) ) crisis subsides (i.e., once there is herd immunity)? Possible answers: “will stop this”; ”will reduce this”; “will keep doing what I am doing now”; “will increase this.” Number indicates respondents who chose “will keep doing what I am doing now” and “will increase this” among new or increased users. 2 Q. Which best describes when you have done or used each of these items? Possible answers included: “just started using since coronavirus started”; “using more since coronavirus started"; “using less since coronavirus started” or “using about the same since coronavirus started.” Possible answers not included: “not using.” ~60–70% of consumers expect to continue digital activities with COVID-19 acceleration ~45–55% of consumers expect to continue digital activities with more disruptive growth during COVID-19 82 26 68 28 84 38 32 52 30 25 74 34 30 36 15 60 46 40 42 20 44 48 50 54 40 56 45 58 62 64 66 70 50 72 76 78 80 0 35 5 10 Restaurant delivery Meal-kit delivery Buy online for in-store pickup Deal-finding plug-ins Purchased from social media In-store self-checkout Quick-serve restaurant drive-thru Grocery delivery Restaurant curbside pickup Store curbside pickup New store/restaurant app Purchased pre-owned products online Penetration since COVID-19 2 COVID-19 acceleration Disruptive growth User growth: 0–19% User growth: 20–39% User growth: 40–59% User growth: 60%+ Continued digital stickiness
  • 22. McKinsey & Company 22 44 38 52 50 42 40 40 48 50 60 46 54 56 72 58 60 62 64 66 68 0 70 74 76 78 80 10 20 30 Digital exercise machine Used social media Video chat: personal Telemedicine: mental TikTok Online streaming Online fitness Videoconferencing: professional Remote learning: myself Remote learning: my children Telemedicine: physical Wellness app Playing online games Watching e-sports Cooked regularly Personal care / grooming at home 1 Q: Compared to now, will you do or use the following more, less, or not at all, once the coronavirus (COVID-19) ) crisis subsides (i.e., once there is herd immunity)? Possible answers: “will stop this”; ”will reduce this”; “will keep doing what I am doing now”; “will increase this.” Number indicates respondents who chose “will keep doing what I am doing now” and “will increase this” among new or increased users. 2 Q. Which best describes when you have done or used each of these items? Possible answers included: “Just started using since coronavirus started”; “using more since coronavirus started”; “using less since coronavirus started” or “using about the same since coronavirus started.” Possible answers not included: “not using.” Online entertainment and wellness habits adopted during the crisis are likely to remain for the medium to long term Source: McKinsey & Company COVID-19 US Consumer Pulse Survey 2/18–2/22/2021, n = 2,076, sampled and weighted to match the US general population 18+ years COVID-19 emphasized COVID-19 acceleration Disruptive growth ~65–80% of consumers expect to continue current level of digital wellness and interactive online entertainment accelerated during COVID-19 Limited shift with COVID-19 ~45–55% of consumers expect to continue current level of remote communication, learning, health platforms with disruptive COVID-19 growth Intent to use after COVID-191 Percent of users who intend to keep doing activity after COVID-19 Continued digital stickiness User growth: 0–19% User growth: 20–39% User growth: 40–59% User growth: 60%+ Penetration since COVID-19 2
  • 23. McKinsey & Company 23 Consumers have made many investments in their homes that will have long-term effects 1 Q: Which of the following have you done in the last 12 months as a result of the COVID-19 crisis? 36% answered “none of these.” Renovated/remodeled my home Went back to school Worked more from home Moved into a bigger home Decided to change jobs 4% Permanently moved to a new city Set up a specific work-from-home space Set up a gym at home Bought a car Reassessed my investment portfolio Permanently moved the suburbs Bought a property Got a new pet at home (e.g. dog, cat) Sold a property Moved into a smaller home 13% 4% Permanently moved to the countryside 24% 7% 5% 12% 10% 12% 3% 6% 12% 5% 4% 6% 5% 13% Permanently moved in with family Pet adoption 13% House move 19% Home renovation 28% Investments/ Divestments 26% Changes made in the last 12 months as a result of COVID-191 % of respondents Source: McKinsey & Company COVID-19 US Consumer Pulse Survey 2/18–2/22/2021, n = 2,076, sampled and weighted to match the US general population 18+ years Work/study change 32% Rebalancing of homebody economy
  • 24. McKinsey & Company 24 However, consumers indicate eagerness to return to out-of-home activities post-COVID-19 7 17 25 20 16 17 16 30 23 17 8 6 13 23 18 13 15 18 13 14 14 29 13 16 17 15 16 14 11 13 16 18 21 11 Tobacco products Groceries Apparel Quick-service restaurant Home & furniture Food takeout & delivery Restaurant Jewelry Footwear Accessories Toys & baby Household supplies Personal-care products Skin care & makeup Sports & outdoors Home improvement & garden Kitchen & dining Decrease Increase Stay the same 7 7 13 16 19 16 16 16 13 8 20 19 11 19 19 18 20 18 11 13 13 12 14 32 19 24 18 32 17 32 33 38 37 38 30 32 Pet-care services Vehicles Vitamins & OTC medicine Out-of-home entertainment Entertainment at home Pet food & supplies Books/magazines/newspapers Fitness & wellness Consumer electronics Personal-care services Gasoline Short-term home rentals Travel by car Cruises Adventures & tours International flights Hotel/resort stays Domestic flights Source: McKinsey & Company COVID-19 US Consumer Pulse Survey 2/18–2/22/2021, n = 2,076, sampled and weighted to match the US general population 18+ years Net intent: Above +1 Net intent: –15 to 0 Net intent: Below – 15 Categories with net intent >10% Expected spending per category post-COVID-19 compared to during COVID-191 % of respondents Net intent2 Net intent2 11% 5% -10% 0% -6% -4% 13% -5% -4% 16% 0% 3% -13% 8% -7% 4% -1% 25% 4% 13% 0% 21% -7% 18% 0% 18% 8% 20% -4% 10% 14% -4% 7% 6% -3% Rebalancing of homebody economy 1 Q: Once the COVID-19 crisis subsides (i.e., once there is herd immunity), do you expect that you will spend more, about the same, or less money on these categories than during the COVID-19 pandemic? Figures may not sum to 100% because of rounding. 2 Net intent is calculated by subtracting the % of respondents stating they expect to decrease spending from the % of respondents stating they expect to increase spending.
  • 25. McKinsey & Company 25 Have you done any of the following since COVID-19 started1,2 % of respondents More than 75 percent of Americans have tried a new shopping behavior during the pandemic, and the trend continues in 2021 Evolution of loyalty 40% 39% 34% 29% 26% Private label/store brand New shopping method3 Different brand Different retailer/store/website New digital shopping method 1 Q: Since the coronavirus (COVID-19) crisis started, which of the following have you done? 23% consumers selected “none of these.” 2 Q: Which best describes whether or not you plan to continue with these shopping changes once the coronavirus (COVID-19) crisis has subsided (i.e., once there is herd immunity)? Possible answers: “will go back to what I did before coronavirus”; ”will keep doing both this and what I did before coronavirus”; ”will keep doing this and NOT go back to what I did before coronavirus.” 3 “New shopping method” includes curbside pickup and delivery apps. 4 “Growth” is indicated by numbers greater than 1x (i.e., 1x indicates no growth, 1.1x indicates 10% growth). 5 Intent to continue includes respondents who selected “will keep doing both this and what I did before coronavirus” and “will keep doing this and NOT go back to what I did before coronavirus.” 6 Members of Gen Z were born from 1997–2012, millennials from 1981-1996, Gen X from 1965–1980, and baby boomers from 1946–1964. The Traditionalist/Silent Generation is not included due to a low sample size. Source: McKinsey & Company COVID-19 US Consumer Pulse Survey 2/18–2/22/2021, n = 2,076, sampled and weighted to match the US general population 18+ years Growth since Aug. 20204 44% vs. 35% more millennials/Gen Z have tried a new brand than baby boomers6 77% of consumers have tried a new shopping behavior 84% of millennials and Gen Z have tried a new shopping behavior6 Intent to continue5 1x 1x 1.1x 1.2x 1.2x 76% 78% 79% 81% 81%
  • 26. McKinsey & Company 26 Value was the main driver of consumers’ switching brands, but they also switched for reasons of purpose, quality, and novelty Evolution of loyalty 1 Q: You mentioned you tried a new/different brand than what you normally buy. What were the main reasons that drove this decision? Select all that apply. “Brand” includes different brand, new private label/store brand. Over-arching reason based on % of individual respondents responding to at least one reason in the group. 2 Members of Gen Z were born from 1997–2012, millennials from 1981–1996. 40% 38% 16% 13% 42% 17% 9% 11% 11% 24% 18% 24% 17% 19% 16% 26% 19% Wanted to try a new brand I found The company treats its employees well Is more sustainable/better for the environment Better value Better prices/promotions Shares my values Supporting local businesses Better shipping/delivery cost Wanted to treat myself Larger package sizes Products are in stock Better quality Is natural/organic Wanted to try a type of product I’ve never tried before Wanted variety/change from my normal routine Is available where I’m shopping (i.e., in store or online) Is cleaner/safer Reason for trying a new brand since COVID-19 began1 % of respondents selecting reason in top three Source: McKinsey & Company COVID-19 US Consumer Pulse Survey 2/18–2/22/2021, n = 2,076, sampled and weighted to match the US general population 18+ years 42% of millennials/ Gen Z cite purpose as a primary reason2 44% of millennials/ Gen Z cite quality/organic as a primary reason2 Net % of respondents per category X% Value 65% Quality/organic 34% Availability 42% Convenience 26% Purpose-driven 34% Novelty 33% Health/hygiene 16% Personal choice 28%
  • 27. McKinsey & Company 27 During COVID-19, brands from larger companies grew more initially, but smaller companies now play an increased role in growth Share of sales, % Source: Nielsen $14B $10B $548B $14B 1 Nielsen xAOC, super categories excluding alcohol, tobacco, fresh, and general merchandise. 2 Companies with yearly sales are Large > $2.5B; Medium <$2.5B but >$500M; Small <$500M. 3“CY 2018” is calendar year growth from 2017–2018; “CY 2019” is calendar year growth from 2018–2019. 4 Year-over-year growth for 4 weeks ending March 21, 2020, August 8, 2020, and Feb 20, 2021. $5B Evolution of loyalty Share of year-over-year dollar sales growth of consumer packaged goods products by company size,1,2 % 51 32 34 54 42 44 14 12 14 16 18 30 28 16 34 33 18 35 33 18 10 8 CY 20183 February 20214 August 20204 2019 3 4 CY 20193 March 20204 $4B Small Retailer brands Medium Large
  • 28. McKinsey & Company 28 Source: McKinsey 2020–21 Global Sentiment Survey Trade-off behavior in a standard shopping basket among all consumers by income tier1 % of consumers, September 2020 and September 2019 >$100K $50K–$100K <$50K US income tiers, household, annual 6 18 4 3 3 17 6 3 3 10 6 10 1 Q: Please indicate how your buying behavior has changed in a standard shopping basket for the items shown in the past 12 months (since September 2019). Select all that apply with option 7 being mutually exclusive and option 1 exclusive from option 2. Possible answers: 1) “Switching to less expensive brands”; 2) “Switching to more expensive / premium brands”; 3) “Buying the same brand as I bought 12 months ago, but at stores with lower prices”; 4) “Buying only when on sale or with coupon”; 5) “Buying less frequently of lower quantity of the same brand”; 6)“Have made some other change in how I buy these products”; 7)“Have not made changes in how I buy these products.” Trade down reflects option 1 as a percentage of all consumers, while trade up reflects option 2 as a percentage of all consumers. Total 4 16 5 5 3.65X Evolution of loyalty While trade-down increased across income groups, trade-up increased as well for consumers with over $100,000 in household income 2019 2020 Trade down Trade up
  • 29. McKinsey & Company 29 Disclaimer McKinsey does not provide legal, medical, or other regulated advice or guarantee results. These materials reflect general insight and best practice based on information currently available and do not contain all of the information needed to determine a future course of action. Such information has not been generated or independently verified by McKinsey and is inherently uncertain and subject to change. McKinsey has no obligation to update these materials and makes no representation or warranty and expressly disclaims any liability with respect thereto.

Editor's Notes

  1. Stacey: One of the things that has stood out the most in the past few weeks is the unprecedented challenges in availability and the resulting new consumer exposure to different brands. What we have seen in the last 3 weeks, at right, versus the same time period last year is a much higher share of growth