More Related Content
More from Mekko Graphics (20)
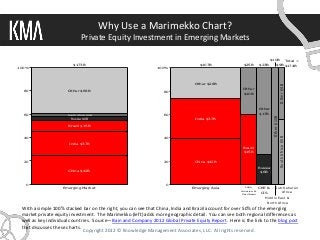
Why Use a Marimekko Chart
- 1. Why Use a Marimekko Chart?
Private Equity Investment in Emerging Markets
$10B Total =
$173B $107B $25B $23B $9B $174B
100% 100%
Other $28B
O the r $ 4B
Other $68B Other
80 80
$10B
Other
60 South Africa $5B 60 $17B
Othe r $10 B
Russia $6B India $37B
Brazil $15B
40 40
South Af rica $ 5B
India $37B
Brazil
$15B
20 20 China $42B
Russia
China $42B $6B
0 0
Emerging Market Emerging Asia Latin CEE & Sub-Saharan
America &
CIS Africa
Carribean
Middle East &
North Africa
With a simple 100% stacked bar on the right, you can see that China, India and Brazil account for over 50% of the emerging
market private equity investment. The Marimekko (left) adds more geographic detail. You can see both regional differences as
well as key individual countries. Source—Bain and Company 2012 Global Private Equity Report. Here is the link to the blog post
that discusses these charts.
Copyright 2012 © Knowledge Management Associates, LLC. All rights reserved .