SlideShare a Scribd company logo
1 of 4
Download to read offline
Min Jeong Lee
Exercise #3
7 October 2016
Exercise #3
JOB: SOC 51-5112: Printing Press Operators
Employment estimate and mean wage estimates for this occupation:
Employment Employment RSE Mean hourly wage Mean annual wage Wage RSE
168,330 1.2% $17.80 $37,020 0.5%
Percentile wage estimates for this occupation:
Percentile 10% 25% 50% (median) 75% 90%
Hourly Wage $9.84 $12.79 $16.94 $21.93 $27.31
Annual Wage $20,460 $26,590 $35,240 $45,610 $56,800
Government survey estimates suggest there were 168,330 Printing Press Operators in the US in
May 2015. The average salary was $17.80 per hour; the median salary was $16.94 per hour.
 Why do you think wages are reported on an hourly basis?
Wages are a fixed regular payment, typically paid on a daily or weekly basis. Wages are reported
on an hourly basis it can be used as a rough estimate to determine future salary, while a contract
salary has many variables that could make it difficult to make the appropriate salary.
 What is the difference between the mean and the median?
The mean is the average, where all the numbers are added up and then divided by the number of
numbers. The median is the middle value in the list of numbers. To find the median, your
numbers have to be listed from least to greatest.
The mean wage is the average wage ($17.80). The median wage ($16.94) is the point at which
half of workers earned more than that amount and half earned less.
 Most companies base pay on medians rather than means. Why might this be? Why
would the median tend to be lower than the mean?
Because median tends to be lower than the mean, most companies base their pay on medians. For
Printing Press Operators, the median wage ($16.94) was lower than the mean wage ($17.80).
Paying the median wage is cheaper for the company.
Median is lower than the mean when there is a big difference between the numbers to the right of
the median and the numbers to the left of the median. When implied, this means that the wages
for employees are wide-ranged.
 What is the ratio of the 90th percentile to the 10th percentile? What might explain
this differential? What impact does it have on an organization’s decision about what
to pay?
The ratio of the 90th
percentile to the 10th
percentile is 27.31/9.84 = 2.78. The 90th
percentile
employee is paid 2.78 times more than the 10th
percentile employee. There are many reasons for
wage differentials. Credentials that show advanced education, professional certification, or
licensure may determine wages. More experience and skill in a job field may earn an employee
higher wages. Working conditions and training requirements may provide wage differentials.
Individual tasks may vary in an occupation, involving more complex tasks and greater
responsibility; these employees would be paid more. Geographic location may also be a factor in
wage differential, because some areas have higher wages than that of other states for the same
occupation. Success and performance also contribute to wage differentials because some
employees are paid based on their performance.
Now look at the different rates for various industries, states, and MSAs. (A MSA is a
Metropolitan Statistical Area.)
 Do the different rates for different industries and localities help understand wage
differentials for the same job?
Depending on the industry and its location, there will be wage differentials for the same
occupation. Some industries, such as agriculture, may affect certain areas more than others. Also,
some occupations may be more important depending on the size of the company (ex. an
investment banker at Goldman Sachs to that of a smaller company).
 Do you think there are likely to be differentials within each industry or area? Why?
There will most likely be more differentials within each area. Within each industry, it is likely
that there are more similar skills needed for each job. However, in each area you must take into
consideration the standard of living, which varies widely depending on where you live.

More Related Content

Viewers also liked

Global HRM: Sweden Powerpoint
Global HRM: Sweden PowerpointGlobal HRM: Sweden Powerpoint
Global HRM: Sweden PowerpointMin Jeong Lee
 
Global HRM: Sweden Research
Global HRM: Sweden ResearchGlobal HRM: Sweden Research
Global HRM: Sweden ResearchMin Jeong Lee
 
Planificación estratégica educ. amb.
Planificación estratégica educ. amb.Planificación estratégica educ. amb.
Planificación estratégica educ. amb.Leonela Villarreal
 
The First 3 Steps To Taking Your Church Online
The First 3 Steps To Taking Your Church OnlineThe First 3 Steps To Taking Your Church Online
The First 3 Steps To Taking Your Church OnlineVibrant Faith
 
Blog 17 Unad Psicofisiologia
Blog 17 Unad Psicofisiologia Blog 17 Unad Psicofisiologia
Blog 17 Unad Psicofisiologia Dantalion Seddim
 
Proceso de la planeación
Proceso de la planeaciónProceso de la planeación
Proceso de la planeaciónEnrique Sanchez
 
weather and climate ppt for students..
weather and climate ppt for students..weather and climate ppt for students..
weather and climate ppt for students..Aditya Ghosh
 
3Com 80-001958-02
3Com 80-001958-023Com 80-001958-02
3Com 80-001958-02savomir
 
Revisión física del equipo de computó
Revisión física del equipo de computóRevisión física del equipo de computó
Revisión física del equipo de computóJoshua Ramos
 

Viewers also liked (11)

Global HRM: Sweden Powerpoint
Global HRM: Sweden PowerpointGlobal HRM: Sweden Powerpoint
Global HRM: Sweden Powerpoint
 
Modularidad
ModularidadModularidad
Modularidad
 
Global HRM: Sweden Research
Global HRM: Sweden ResearchGlobal HRM: Sweden Research
Global HRM: Sweden Research
 
Planificación estratégica educ. amb.
Planificación estratégica educ. amb.Planificación estratégica educ. amb.
Planificación estratégica educ. amb.
 
La ira
La iraLa ira
La ira
 
The First 3 Steps To Taking Your Church Online
The First 3 Steps To Taking Your Church OnlineThe First 3 Steps To Taking Your Church Online
The First 3 Steps To Taking Your Church Online
 
Blog 17 Unad Psicofisiologia
Blog 17 Unad Psicofisiologia Blog 17 Unad Psicofisiologia
Blog 17 Unad Psicofisiologia
 
Proceso de la planeación
Proceso de la planeaciónProceso de la planeación
Proceso de la planeación
 
weather and climate ppt for students..
weather and climate ppt for students..weather and climate ppt for students..
weather and climate ppt for students..
 
3Com 80-001958-02
3Com 80-001958-023Com 80-001958-02
3Com 80-001958-02
 
Revisión física del equipo de computó
Revisión física del equipo de computóRevisión física del equipo de computó
Revisión física del equipo de computó
 

Similar to Job Worth

Salary survey c level-2021
Salary survey c level-2021Salary survey c level-2021
Salary survey c level-2021Kristina Florya
 
Salary survey c level-2018
Salary survey c level-2018Salary survey c level-2018
Salary survey c level-2018Olga Novykova
 
Financial Impacts of Federal Minimum Wage Change
Financial Impacts of Federal Minimum Wage ChangeFinancial Impacts of Federal Minimum Wage Change
Financial Impacts of Federal Minimum Wage ChangeEquifax
 
9 Salary Surveys A Snapshot Market data obtained from salary surv.docx
9 Salary Surveys A Snapshot Market data obtained from salary surv.docx9 Salary Surveys A Snapshot Market data obtained from salary surv.docx
9 Salary Surveys A Snapshot Market data obtained from salary surv.docxsleeperharwell
 
Salary survey c level-2018
Salary survey c level-2018Salary survey c level-2018
Salary survey c level-2018Olga Novykova
 
The Impact of the Current Economy on Compensation Management
The Impact of the Current Economy on Compensation ManagementThe Impact of the Current Economy on Compensation Management
The Impact of the Current Economy on Compensation ManagementPayScale, Inc.
 
2017 compensation-best-practices-report
2017 compensation-best-practices-report2017 compensation-best-practices-report
2017 compensation-best-practices-reportSATYARTHI PRABANDHAN
 
Hrm 598 week 4 case study getting and using compensation information
Hrm 598 week 4 case study getting and using compensation informationHrm 598 week 4 case study getting and using compensation information
Hrm 598 week 4 case study getting and using compensation informationbestwriter
 
Survey Ro Ir2
Survey Ro Ir2Survey Ro Ir2
Survey Ro Ir2jpalien
 
Jodi theyoungandtherestless
Jodi theyoungandtherestlessJodi theyoungandtherestless
Jodi theyoungandtherestlessJodi Rudick
 
Data Visualization Report For Business Analytics.docx
Data Visualization Report For Business Analytics.docxData Visualization Report For Business Analytics.docx
Data Visualization Report For Business Analytics.docxahmeds551
 
New microsoft word document
New microsoft word documentNew microsoft word document
New microsoft word documentRon Ijaz
 
What is a salary survey_ .pdf
What is a salary survey_ .pdfWhat is a salary survey_ .pdf
What is a salary survey_ .pdfFigures1
 
Actionable results to enhance Employee satisfaction score analysis via Tableau
Actionable results to enhance Employee satisfaction score analysis via TableauActionable results to enhance Employee satisfaction score analysis via Tableau
Actionable results to enhance Employee satisfaction score analysis via TableauShruti Nigam (CWM, AFP)
 

Similar to Job Worth (20)

Salary survey С-level 2019
Salary survey С-level 2019Salary survey С-level 2019
Salary survey С-level 2019
 
Salary survey c level-2021
Salary survey c level-2021Salary survey c level-2021
Salary survey c level-2021
 
Salary survey c level-2018
Salary survey c level-2018Salary survey c level-2018
Salary survey c level-2018
 
Financial Impacts of Federal Minimum Wage Change
Financial Impacts of Federal Minimum Wage ChangeFinancial Impacts of Federal Minimum Wage Change
Financial Impacts of Federal Minimum Wage Change
 
9 Salary Surveys A Snapshot Market data obtained from salary surv.docx
9 Salary Surveys A Snapshot Market data obtained from salary surv.docx9 Salary Surveys A Snapshot Market data obtained from salary surv.docx
9 Salary Surveys A Snapshot Market data obtained from salary surv.docx
 
Salary survey c level-2018
Salary survey c level-2018Salary survey c level-2018
Salary survey c level-2018
 
API_SG17
API_SG17API_SG17
API_SG17
 
The Impact of the Current Economy on Compensation Management
The Impact of the Current Economy on Compensation ManagementThe Impact of the Current Economy on Compensation Management
The Impact of the Current Economy on Compensation Management
 
2017 compensation-best-practices-report
2017 compensation-best-practices-report2017 compensation-best-practices-report
2017 compensation-best-practices-report
 
Hrm 598 week 4 case study getting and using compensation information
Hrm 598 week 4 case study getting and using compensation informationHrm 598 week 4 case study getting and using compensation information
Hrm 598 week 4 case study getting and using compensation information
 
Survey Ro Ir2
Survey Ro Ir2Survey Ro Ir2
Survey Ro Ir2
 
Survey Ro Ir2
Survey Ro Ir2Survey Ro Ir2
Survey Ro Ir2
 
Mod 6 (1st part)
Mod 6 (1st part)Mod 6 (1st part)
Mod 6 (1st part)
 
Jodi theyoungandtherestless
Jodi theyoungandtherestlessJodi theyoungandtherestless
Jodi theyoungandtherestless
 
Data Visualization Report For Business Analytics.docx
Data Visualization Report For Business Analytics.docxData Visualization Report For Business Analytics.docx
Data Visualization Report For Business Analytics.docx
 
The impact of turnover is a big $
The impact of turnover is a big $The impact of turnover is a big $
The impact of turnover is a big $
 
New microsoft word document
New microsoft word documentNew microsoft word document
New microsoft word document
 
Employee attrition
Employee attritionEmployee attrition
Employee attrition
 
What is a salary survey_ .pdf
What is a salary survey_ .pdfWhat is a salary survey_ .pdf
What is a salary survey_ .pdf
 
Actionable results to enhance Employee satisfaction score analysis via Tableau
Actionable results to enhance Employee satisfaction score analysis via TableauActionable results to enhance Employee satisfaction score analysis via Tableau
Actionable results to enhance Employee satisfaction score analysis via Tableau
 

Job Worth

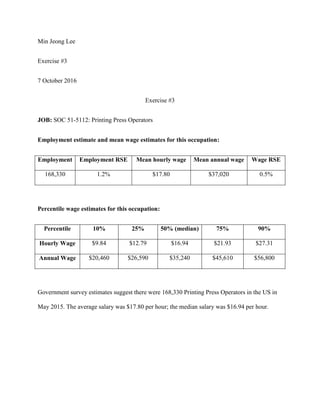
  • 1. Min Jeong Lee Exercise #3 7 October 2016 Exercise #3 JOB: SOC 51-5112: Printing Press Operators Employment estimate and mean wage estimates for this occupation: Employment Employment RSE Mean hourly wage Mean annual wage Wage RSE 168,330 1.2% $17.80 $37,020 0.5% Percentile wage estimates for this occupation: Percentile 10% 25% 50% (median) 75% 90% Hourly Wage $9.84 $12.79 $16.94 $21.93 $27.31 Annual Wage $20,460 $26,590 $35,240 $45,610 $56,800 Government survey estimates suggest there were 168,330 Printing Press Operators in the US in May 2015. The average salary was $17.80 per hour; the median salary was $16.94 per hour.
  • 2.  Why do you think wages are reported on an hourly basis? Wages are a fixed regular payment, typically paid on a daily or weekly basis. Wages are reported on an hourly basis it can be used as a rough estimate to determine future salary, while a contract salary has many variables that could make it difficult to make the appropriate salary.  What is the difference between the mean and the median? The mean is the average, where all the numbers are added up and then divided by the number of numbers. The median is the middle value in the list of numbers. To find the median, your numbers have to be listed from least to greatest. The mean wage is the average wage ($17.80). The median wage ($16.94) is the point at which half of workers earned more than that amount and half earned less.  Most companies base pay on medians rather than means. Why might this be? Why would the median tend to be lower than the mean? Because median tends to be lower than the mean, most companies base their pay on medians. For Printing Press Operators, the median wage ($16.94) was lower than the mean wage ($17.80). Paying the median wage is cheaper for the company. Median is lower than the mean when there is a big difference between the numbers to the right of the median and the numbers to the left of the median. When implied, this means that the wages for employees are wide-ranged.
  • 3.  What is the ratio of the 90th percentile to the 10th percentile? What might explain this differential? What impact does it have on an organization’s decision about what to pay? The ratio of the 90th percentile to the 10th percentile is 27.31/9.84 = 2.78. The 90th percentile employee is paid 2.78 times more than the 10th percentile employee. There are many reasons for wage differentials. Credentials that show advanced education, professional certification, or licensure may determine wages. More experience and skill in a job field may earn an employee higher wages. Working conditions and training requirements may provide wage differentials. Individual tasks may vary in an occupation, involving more complex tasks and greater responsibility; these employees would be paid more. Geographic location may also be a factor in wage differential, because some areas have higher wages than that of other states for the same occupation. Success and performance also contribute to wage differentials because some employees are paid based on their performance. Now look at the different rates for various industries, states, and MSAs. (A MSA is a Metropolitan Statistical Area.)  Do the different rates for different industries and localities help understand wage differentials for the same job? Depending on the industry and its location, there will be wage differentials for the same occupation. Some industries, such as agriculture, may affect certain areas more than others. Also, some occupations may be more important depending on the size of the company (ex. an investment banker at Goldman Sachs to that of a smaller company).
  • 4.  Do you think there are likely to be differentials within each industry or area? Why? There will most likely be more differentials within each area. Within each industry, it is likely that there are more similar skills needed for each job. However, in each area you must take into consideration the standard of living, which varies widely depending on where you live.