SlideShare a Scribd company logo
1 of 7
Download to read offline
Cartographic modeling

In this exercise, we will create a basic map of land cover with a descriptive graph embedded in the
map.


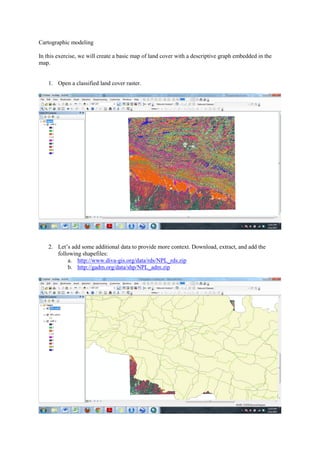
    1. Open a classified land cover raster.


    2. Let’s add some additional data to provide more context. Download, extract, and add the
       following shapefiles:
           a. http://www.diva-gis.org/data/rds/NPL_rds.zip
           b. http://gadm.org/data/shp/NPL_adm.zip
3. Label the towns and district boundaries by double-clicking on the administrative layer. Under
   the “Labels” tab, select “Label features in this layer” and identify “NAME_03” as the
   attribute to label.


4. Also, remove the fill of the administrative features layer.


5. By now, the map looks a little busy!
6. Let’s pick some alternative colors. Go to http://colorbrewer2.org/.


7. We need to get colors for 9 classes. Select “9” as the number of classes. In the “Nature of
   your data” area, select “Qualitative”—in our case, the land cover classes are qualitatively
   different from each other. Then select one of the color schemes.
8. We are interested in the RGB codes. Write them down and assign them to the color classes of
   the raster.


9. The map still looks a little hectic – mostly because there are 9 classes of color. Also, these
   colors were arbitrarily assigned to classes – ideally, certain colors would be used to represent
   known land cover classes (blue for water, green for forest, etc.). However, it’s now much
   easier to see the roads and administrative boundaries layers. Now let’s quantify the relative
   coverage of each of these classes. Under “View” select “Graphs”  “Create”.
10. Match the selections below, or chose other options for displaying the number of cells in each
    class of the raster layer.


11. We are nearly ready to export the map. Click “Layout View” under “View”. Adjust the page
    layout and size depending on the section of the raster layer you wish to display. Also, add the
    other key map features (scale, north arrow, legend, etc.).
12. Now right-click on the graph and select “Add to layout”.


13. To save the map, click on “File”  “Export Map”. Name the file, choose a folder to save it,
    and save as a PDF.
14. Depending on the print quality you seek you may wish to change the resolution. Note that this
    is only relevant for raster files. If your map only had vector layers and you export as a PDF
    file, the output will remain a vector-based image.


15. If you intend to invest substantial energy in the production of a map, it is often useful to
    export the map as an “SVG” file, and edit it in Adobe Illustrator, or the excellent open source
    alternative: Inkscape - http://inkscape.org/.

More Related Content

What's hot

Getting the most from the Cambridgeshire Atlas | Fuel Poverty
Getting the most from the Cambridgeshire Atlas | Fuel PovertyGetting the most from the Cambridgeshire Atlas | Fuel Poverty
Getting the most from the Cambridgeshire Atlas | Fuel PovertyCambridgeshireInsight
 
HEC-RAS LiDAR Cross Sections With Microstation SS3 V8i
HEC-RAS LiDAR Cross Sections With Microstation SS3 V8iHEC-RAS LiDAR Cross Sections With Microstation SS3 V8i
HEC-RAS LiDAR Cross Sections With Microstation SS3 V8iChristopher L Chatfield, P.E.
 
Data Models - GIS I
Data Models - GIS IData Models - GIS I
Data Models - GIS IJohn Reiser
 
Arc catalog introduction
Arc catalog introductionArc catalog introduction
Arc catalog introductionAshok Peddi
 
Manual to basic gis
Manual to basic gisManual to basic gis
Manual to basic gisQust04
 
Automating Repetitive Tasks with MapBasic
Automating Repetitive Tasks with MapBasicAutomating Repetitive Tasks with MapBasic
Automating Repetitive Tasks with MapBasicPeter Horsbøll Møller
 
Heightmaps intro
Heightmaps introHeightmaps intro
Heightmaps introVisCircle
 
Taking Advantage of a Spatial Database with MapInfo Professional
Taking Advantage of a Spatial Database with MapInfo ProfessionalTaking Advantage of a Spatial Database with MapInfo Professional
Taking Advantage of a Spatial Database with MapInfo ProfessionalPeter Horsbøll Møller
 
QGIS Module 3
QGIS Module 3QGIS Module 3
QGIS Module 3CAPSUCSF
 
Pertemuan 1 - Introduction StatPlanet
Pertemuan 1 - Introduction StatPlanetPertemuan 1 - Introduction StatPlanet
Pertemuan 1 - Introduction StatPlanetAdi Triyatmoko
 
Using Spectrum on Demand from MapInfo Pro
Using Spectrum on Demand from MapInfo ProUsing Spectrum on Demand from MapInfo Pro
Using Spectrum on Demand from MapInfo ProPeter Horsbøll Møller
 
MapInfo Professional 12.0 and SQL Server 2008
MapInfo Professional 12.0 and SQL Server 2008MapInfo Professional 12.0 and SQL Server 2008
MapInfo Professional 12.0 and SQL Server 2008Peter Horsbøll Møller
 
Multi Dimensional Data Model
Multi Dimensional Data ModelMulti Dimensional Data Model
Multi Dimensional Data ModelGowtham Pabbithi
 
Manual gis
Manual gisManual gis
Manual gissaha232
 
Introduction to gis
Introduction to gisIntroduction to gis
Introduction to gisJay_mittal
 

What's hot (20)

Getting the most from the Cambridgeshire Atlas | Fuel Poverty
Getting the most from the Cambridgeshire Atlas | Fuel PovertyGetting the most from the Cambridgeshire Atlas | Fuel Poverty
Getting the most from the Cambridgeshire Atlas | Fuel Poverty
 
HEC-RAS LiDAR Cross Sections With Microstation SS3 V8i
HEC-RAS LiDAR Cross Sections With Microstation SS3 V8iHEC-RAS LiDAR Cross Sections With Microstation SS3 V8i
HEC-RAS LiDAR Cross Sections With Microstation SS3 V8i
 
02+ +step+by+step+qgis
02+ +step+by+step+qgis02+ +step+by+step+qgis
02+ +step+by+step+qgis
 
QGIS Tutorial 2
QGIS Tutorial 2QGIS Tutorial 2
QGIS Tutorial 2
 
Data Models - GIS I
Data Models - GIS IData Models - GIS I
Data Models - GIS I
 
Arc catalog introduction
Arc catalog introductionArc catalog introduction
Arc catalog introduction
 
Manual to basic gis
Manual to basic gisManual to basic gis
Manual to basic gis
 
HDF Explorer Update and demo
HDF Explorer Update and demoHDF Explorer Update and demo
HDF Explorer Update and demo
 
Automating Repetitive Tasks with MapBasic
Automating Repetitive Tasks with MapBasicAutomating Repetitive Tasks with MapBasic
Automating Repetitive Tasks with MapBasic
 
Heightmaps intro
Heightmaps introHeightmaps intro
Heightmaps intro
 
Taking Advantage of a Spatial Database with MapInfo Professional
Taking Advantage of a Spatial Database with MapInfo ProfessionalTaking Advantage of a Spatial Database with MapInfo Professional
Taking Advantage of a Spatial Database with MapInfo Professional
 
Spatial is Not Special ?
Spatial is Not Special ?Spatial is Not Special ?
Spatial is Not Special ?
 
QGIS Module 3
QGIS Module 3QGIS Module 3
QGIS Module 3
 
Spatial Data Models
Spatial Data Models Spatial Data Models
Spatial Data Models
 
Pertemuan 1 - Introduction StatPlanet
Pertemuan 1 - Introduction StatPlanetPertemuan 1 - Introduction StatPlanet
Pertemuan 1 - Introduction StatPlanet
 
Using Spectrum on Demand from MapInfo Pro
Using Spectrum on Demand from MapInfo ProUsing Spectrum on Demand from MapInfo Pro
Using Spectrum on Demand from MapInfo Pro
 
MapInfo Professional 12.0 and SQL Server 2008
MapInfo Professional 12.0 and SQL Server 2008MapInfo Professional 12.0 and SQL Server 2008
MapInfo Professional 12.0 and SQL Server 2008
 
Multi Dimensional Data Model
Multi Dimensional Data ModelMulti Dimensional Data Model
Multi Dimensional Data Model
 
Manual gis
Manual gisManual gis
Manual gis
 
Introduction to gis
Introduction to gisIntroduction to gis
Introduction to gis
 

Similar to High res cartographic modeling lab

Nycct GIS_primer tutorial
Nycct  GIS_primer tutorialNycct  GIS_primer tutorial
Nycct GIS_primer tutorialNYCCTfab
 
Soil and Water Assessment Tool Procedure
Soil and Water Assessment Tool ProcedureSoil and Water Assessment Tool Procedure
Soil and Water Assessment Tool ProcedureKEFA FEYE
 
Map Making with QGIS
Map Making with QGISMap Making with QGIS
Map Making with QGISSagar Arlekar
 
Map Making with QGIS
Map Making with QGISMap Making with QGIS
Map Making with QGISniket_narang
 
Introduction to ArcGIS 10.1
Introduction to ArcGIS 10.1Introduction to ArcGIS 10.1
Introduction to ArcGIS 10.1Claudio Montoni
 
Map Making with QGIS - Part II
Map Making with QGIS - Part IIMap Making with QGIS - Part II
Map Making with QGIS - Part IISagar Arlekar
 
Cgc Make Your Own Gis
Cgc Make Your Own GisCgc Make Your Own Gis
Cgc Make Your Own GistprattHWDSB
 
Geographic information system and remote sensing
Geographic information system and remote sensingGeographic information system and remote sensing
Geographic information system and remote sensingchala hailu
 
Preparing Updated Geological Map Using ArcGIS
Preparing Updated Geological Map Using ArcGISPreparing Updated Geological Map Using ArcGIS
Preparing Updated Geological Map Using ArcGISMohammad Imran Khan
 
Legal Mapping in Google Earth Pro
Legal Mapping in Google Earth ProLegal Mapping in Google Earth Pro
Legal Mapping in Google Earth ProCameronHollingshead
 
Arc Gis Traininng.pptx
Arc Gis Traininng.pptxArc Gis Traininng.pptx
Arc Gis Traininng.pptxImran khan
 
Fly thru
Fly thruFly thru
Fly thruAli Sam
 
annotation_tutorial_2008
annotation_tutorial_2008annotation_tutorial_2008
annotation_tutorial_2008tutorialsruby
 
annotation_tutorial_2008
annotation_tutorial_2008annotation_tutorial_2008
annotation_tutorial_2008tutorialsruby
 
Presentation BASIC GIS.pptx
Presentation BASIC GIS.pptxPresentation BASIC GIS.pptx
Presentation BASIC GIS.pptxAbdilbasitHamid
 
Stat planet - tutorial
Stat planet - tutorialStat planet - tutorial
Stat planet - tutorialSathya Seelan
 

Similar to High res cartographic modeling lab (20)

Nycct GIS_primer tutorial
Nycct  GIS_primer tutorialNycct  GIS_primer tutorial
Nycct GIS_primer tutorial
 
Mg examp
Mg exampMg examp
Mg examp
 
Rasters
RastersRasters
Rasters
 
Soil and Water Assessment Tool Procedure
Soil and Water Assessment Tool ProcedureSoil and Water Assessment Tool Procedure
Soil and Water Assessment Tool Procedure
 
Map Making with QGIS
Map Making with QGISMap Making with QGIS
Map Making with QGIS
 
Map Making with QGIS
Map Making with QGISMap Making with QGIS
Map Making with QGIS
 
Introduction to ArcGIS 10.1
Introduction to ArcGIS 10.1Introduction to ArcGIS 10.1
Introduction to ArcGIS 10.1
 
Building story maps
Building story mapsBuilding story maps
Building story maps
 
Map Making with QGIS - Part II
Map Making with QGIS - Part IIMap Making with QGIS - Part II
Map Making with QGIS - Part II
 
Cgc Make Your Own Gis
Cgc Make Your Own GisCgc Make Your Own Gis
Cgc Make Your Own Gis
 
Geographic information system and remote sensing
Geographic information system and remote sensingGeographic information system and remote sensing
Geographic information system and remote sensing
 
Preparing Updated Geological Map Using ArcGIS
Preparing Updated Geological Map Using ArcGISPreparing Updated Geological Map Using ArcGIS
Preparing Updated Geological Map Using ArcGIS
 
Legal Mapping in Google Earth Pro
Legal Mapping in Google Earth ProLegal Mapping in Google Earth Pro
Legal Mapping in Google Earth Pro
 
Arc Gis Traininng.pptx
Arc Gis Traininng.pptxArc Gis Traininng.pptx
Arc Gis Traininng.pptx
 
Ex32018.pdf
Ex32018.pdfEx32018.pdf
Ex32018.pdf
 
Fly thru
Fly thruFly thru
Fly thru
 
annotation_tutorial_2008
annotation_tutorial_2008annotation_tutorial_2008
annotation_tutorial_2008
 
annotation_tutorial_2008
annotation_tutorial_2008annotation_tutorial_2008
annotation_tutorial_2008
 
Presentation BASIC GIS.pptx
Presentation BASIC GIS.pptxPresentation BASIC GIS.pptx
Presentation BASIC GIS.pptx
 
Stat planet - tutorial
Stat planet - tutorialStat planet - tutorial
Stat planet - tutorial
 

More from International Centre for Integrated Mountain Development (ICIMOD)

More from International Centre for Integrated Mountain Development (ICIMOD) (14)

High res integrating socio economic data and biophysical data
High res integrating socio economic data and biophysical dataHigh res integrating socio economic data and biophysical data
High res integrating socio economic data and biophysical data
 
Cartographic modeling presentation
Cartographic modeling presentationCartographic modeling presentation
Cartographic modeling presentation
 
Peer presentation
Peer presentationPeer presentation
Peer presentation
 
Powerpoint
PowerpointPowerpoint
Powerpoint
 
Research Perspectives
Research PerspectivesResearch Perspectives
Research Perspectives
 
Role of Science in Global Climate Change Policy, Environmental Security, and ...
Role of Science in Global Climate Change Policy, Environmental Security, and ...Role of Science in Global Climate Change Policy, Environmental Security, and ...
Role of Science in Global Climate Change Policy, Environmental Security, and ...
 
DYNAMICS OF APPLE ORCHARDS IN RESPONSE TO ENVIRONMENTAL CHANGE: A CASE STUDY ...
DYNAMICS OF APPLE ORCHARDS IN RESPONSE TO ENVIRONMENTAL CHANGE: A CASE STUDY ...DYNAMICS OF APPLE ORCHARDS IN RESPONSE TO ENVIRONMENTAL CHANGE: A CASE STUDY ...
DYNAMICS OF APPLE ORCHARDS IN RESPONSE TO ENVIRONMENTAL CHANGE: A CASE STUDY ...
 
Study of Tsho Rolpa Glacial Lake and Trakarding Glacier, Using Remote Sensing
Study of Tsho Rolpa Glacial Lake and Trakarding Glacier, Using Remote SensingStudy of Tsho Rolpa Glacial Lake and Trakarding Glacier, Using Remote Sensing
Study of Tsho Rolpa Glacial Lake and Trakarding Glacier, Using Remote Sensing
 
Climate change vulnerability in mountain agriculture
Climate change vulnerability in mountain agricultureClimate change vulnerability in mountain agriculture
Climate change vulnerability in mountain agriculture
 
Assessing the Effect of Climate Change on Frequency of Flood Events in Koshi ...
Assessing the Effect of Climate Change on Frequency of Flood Events in Koshi ...Assessing the Effect of Climate Change on Frequency of Flood Events in Koshi ...
Assessing the Effect of Climate Change on Frequency of Flood Events in Koshi ...
 
GLACIER RESPONSE TO CLIMATE CHANGE IN WESTERN AND NEPAL HIMALAYAS
GLACIER RESPONSE TO CLIMATE CHANGE IN WESTERN AND NEPAL HIMALAYASGLACIER RESPONSE TO CLIMATE CHANGE IN WESTERN AND NEPAL HIMALAYAS
GLACIER RESPONSE TO CLIMATE CHANGE IN WESTERN AND NEPAL HIMALAYAS
 
Women Health, Vulnerability and Adaptation to Climate Change: A Study of The ...
Women Health, Vulnerability and Adaptation to Climate Change: A Study of The ...Women Health, Vulnerability and Adaptation to Climate Change: A Study of The ...
Women Health, Vulnerability and Adaptation to Climate Change: A Study of The ...
 
To Assess the Impacts of Climate Change on Snow and Glacier Melt Runoff
To Assess the Impacts of Climate Change on Snow and Glacier Melt RunoffTo Assess the Impacts of Climate Change on Snow and Glacier Melt Runoff
To Assess the Impacts of Climate Change on Snow and Glacier Melt Runoff
 
Climate Change Science in the Hindu-Kush-Himalayas-Tibet
Climate Change Science in the Hindu-Kush-Himalayas-TibetClimate Change Science in the Hindu-Kush-Himalayas-Tibet
Climate Change Science in the Hindu-Kush-Himalayas-Tibet
 

High res cartographic modeling lab

  • 1. Cartographic modeling In this exercise, we will create a basic map of land cover with a descriptive graph embedded in the map. 1. Open a classified land cover raster. 2. Let’s add some additional data to provide more context. Download, extract, and add the following shapefiles: a. http://www.diva-gis.org/data/rds/NPL_rds.zip b. http://gadm.org/data/shp/NPL_adm.zip
  • 2. 3. Label the towns and district boundaries by double-clicking on the administrative layer. Under the “Labels” tab, select “Label features in this layer” and identify “NAME_03” as the attribute to label. 4. Also, remove the fill of the administrative features layer. 5. By now, the map looks a little busy!
  • 3. 6. Let’s pick some alternative colors. Go to http://colorbrewer2.org/. 7. We need to get colors for 9 classes. Select “9” as the number of classes. In the “Nature of your data” area, select “Qualitative”—in our case, the land cover classes are qualitatively different from each other. Then select one of the color schemes.
  • 4. 8. We are interested in the RGB codes. Write them down and assign them to the color classes of the raster. 9. The map still looks a little hectic – mostly because there are 9 classes of color. Also, these colors were arbitrarily assigned to classes – ideally, certain colors would be used to represent known land cover classes (blue for water, green for forest, etc.). However, it’s now much easier to see the roads and administrative boundaries layers. Now let’s quantify the relative coverage of each of these classes. Under “View” select “Graphs”  “Create”.
  • 5. 10. Match the selections below, or chose other options for displaying the number of cells in each class of the raster layer. 11. We are nearly ready to export the map. Click “Layout View” under “View”. Adjust the page layout and size depending on the section of the raster layer you wish to display. Also, add the other key map features (scale, north arrow, legend, etc.).
  • 6. 12. Now right-click on the graph and select “Add to layout”. 13. To save the map, click on “File”  “Export Map”. Name the file, choose a folder to save it, and save as a PDF.
  • 7. 14. Depending on the print quality you seek you may wish to change the resolution. Note that this is only relevant for raster files. If your map only had vector layers and you export as a PDF file, the output will remain a vector-based image. 15. If you intend to invest substantial energy in the production of a map, it is often useful to export the map as an “SVG” file, and edit it in Adobe Illustrator, or the excellent open source alternative: Inkscape - http://inkscape.org/.