5 Year Financial Analysis: Pakistan State Oil (PSO)
•
18 likes•13,402 views

PSO FINANCIAL STATEMENT ANALYSIS REPORTS: - Balance Sheet - Profit & Loss Account (Income statement) - Cash flow Statement - Statement of Changes in Equity - Statements of Compliance (with code of corporate governance) PSO FINANCIAL RATIO ANALYSIS: - Profitability ratios - Stability ratios - Liquidity ratios - Solvency ratios

Recommended
More Related Content
What's hot
What's hot (20)
Viewers also liked
Viewers also liked (20)
Similar to 5 Year Financial Analysis: Pakistan State Oil (PSO)
Similar to 5 Year Financial Analysis: Pakistan State Oil (PSO) (20)
More from Noman Khan - MBA (Aviation Mgt)
More from Noman Khan - MBA (Aviation Mgt) (8)
Recently uploaded
Recently uploaded (20)
5 Year Financial Analysis: Pakistan State Oil (PSO)
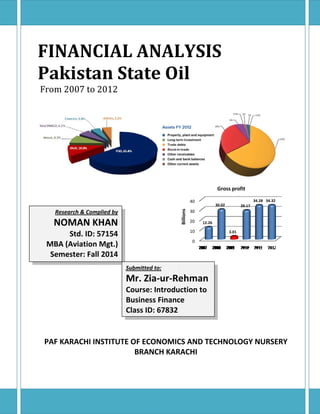
- 1. FIN Pa From NAN kist m 2007 t Re N NCIA tan S to 2012 esearch & Co NOMAN MBA Sem PAF AL A Stat omplied by KHAN D: 57154 on Mgt.) Fall 2014 Std. ID A (Aviatio mester: F KARACHI I INSTITU NAL te Oi Submitte Mr. Zi Course Busines Class ID Billions d to: ia‐ur‐Re e: Introdu ss Financ D: 67832 UTE OF EC IS 26 ehman uction to ce CONOMIC NCH KAR BRAN LYSI il 40 30 20 10 0 12.2 CS AND T RACHI Gross pro 3.01 30.02 ofit 29.17 ECHNOLO 34.28 34 4.32 OGY NUR RSERY
- 2. Pakistan State Oil Financial Analysis (INTENTIONALLY LEFT BLANK) Pakistan State Oil Financial Analysis (ii)
- 3. FIN Pa From NAN kist m 2007 t Re N NCIA tan S to 2012 esearch & Co NOMAN MBA Sem PAF AL A Stat omplied by KHAN D: 57154 on Mgt.) Fall 2014 Std. ID A (Aviatio mester: F KARACHI Pakistan S I INSTITU tate Oil Financ NAL te Oi Submitte Mr. Zi Course Busines Class ID Billions d to: ia‐ur‐Re e: Introdu ss Financ D: 67832 UTE OF EC cial Analysis akistan State IS 26 ehman uction to ce CONOMIC NCH KAR BRAN Pa LYSI il 40 30 20 10 0 12.2 CS AND T RACHI e Oil Financ Gross pro 3.01 30.02 ofit 29.17 ECHNOLO ial Analysis 34.28 34 OGY NUR RSERY (iii) 4.32
- 4. Pakistan State Oil Financial Analysis (INTENTIONALLY LEFT BLANK) Pakistan State Oil Financial Analysis (iv)
- 5. Pakistan State Oil Financial Analysis PROJECT OBJECT: “This analysis is the part of project assignment that is given to the class by the Instructor Mr. Zia‐ur‐Rehman, on individual basis to conduct the analysis of a KSE listed company whose five years financial statements (at least) are available publically”. The analysis may cover the analysis that are given in the Chapter 6 & 7 in the text Book PROJECT OUTCOMES: A good and research full completion of this project will be helpful us to appraise the financial performance of the firm; understand the principles of discounted cash flows; understand the valuation of financial securities and long‐term projects, and identify the techniques used to manage the firm’s calculate the measures of risk and return; current accounts so that an acceptable level of net working capital is maintained. Pakistan State Oil Financial Analysis (v)
- 6. Pakistan State Oil Financial Analysis This Project assignment is thankfully dedicated to my beloved wife and children for providing me peace of mind and conducive environment for research & compilation of work & specially Karachi Electric Supply Company (KESC). for their excessive interruptions if was not there, this report could have been more precise, and Completed one week earlier... Thank You!! Noman Khan Stud. ID: 57154 PAF KIET Nursery Br. Karachi Pakistan State Oil Financial Analysis (vi)
- 7. Pakistan State Oil Financial Analysis ACKNOWLEDGEMENT I, first of all, would like to express my gratitude to the Almighty Allah who gave my resources, expertise and many more to initiate and complete the project assignment happily on time, also would like to bless all those people who provided support, specially my family, who offered me peace of mind to concentrate and focus on the subject assignment. I also would like to thanks my Institute (PAF KIET) and the instructor Mr. Zia ur Rehman who thought me the course of Introduction to Business Finance which is new for me and i was studying this dismal science subject very first time, and it’s proved to be an understandable without any extra efforts. Instructor kind support took this long & difficult journey converted into a destination. It would not better, to cover up the unconditional support of related websites, books, and articles, to the concerned area of study. Noman Khan Pakistan State Oil Financial Analysis (vii)
- 8. Pakistan State Oil Financial Analysis TABLE OF CONTENT A. Company profile A1. Business at a glance A2. History B. Financial reports C. Financial statement analysis C1. Balance sheet analysis: C2. Balance sheet analysis: C3. Profit and loss account analysis C4. Financial crisis 2009 D. Financial ratio analysis of PSO: D1. General description D2. Short‐term solvency ratio: D2.1. General Description: D2.2. Current & quick ratio D2.3. General description D3. Asset utilization ratios: D3.1. General description D3.2. Inventory turnover D3.3. Fixed assets turnover D3.4. Total assets turnover D3.5. Turnover ratios at a glance D4. Profitability ratios D4.1. Profit margins D4.2. Net profit Margin E. Inter‐ Market Analysis – Competitors E1. Key Highlights – FY2012‐13 E2. Operational Highlights: E3. Summary of findings ‐ suggestions for improvement: E4. Future outlook: F. Reference G. Appendices (Attachments) Pakistan State Oil Financial Analysis (viii)
- 9. Pakistan State Oil Financial Analysis Pakistan State Oil (PSO) A. COMPANY PROFILE: Pakistan State Oil (PSO), is a multi‐million, global competitive state‐owned mega corporation, and the leading oil market presiding entity in Pakistan. Headquartered in Karachi, Sindh Province of Pakistan, it has several state divisions in the different cities in Pakistan, with administrative management business network infrastructure well expanded, built at par with international standards, represents 82% of country’s national energy sources. The PSO is horizontally integrated and is the largest state‐owned energy mega corporation active in the oil and gas industry especially distribution. The PSO conducts major renewable energy activities, including in bio‐fuels, hydrogen, solar, nuclear and wind power as well as defense management The Mega Corporation is the largest entity in the country, with well‐expanded business presence in abroad. The PSO has a primary listing at the Karachi Stock Exchange (KSE), and is a constituent of theKSE‐30 Index. The PSO is the third largest entity to be placed in the KSE, ranking behind the Shell— a subsidiary of Royal Dutch Shell. A1. HISTORY: A1.1. The formation of PSO began in 1974. The Mega Corporation started when the government took over and merged Pakistan National Oil (PNO) and Dawood Petroleum Limited (DPL) as Premiere Oil Company Limited (POCL) on 1 January 1974. On 3 June 1974, the government owned Petroleum Storage Development Corporation (PSDC) was established as the umbrella corporation; it was renamed as State Oil Company (SOC Ltd) on 23 August 1976. A vested integration was carried out with the forceful purchasing of Esso Eastern and the control was taken over by the State Oil Company; the government amalgamated all integrated corporations to one single category, called the "Oil Marketing Companies" (OMCo.) A1.2. On 30 December 1976, the Premier Oil Company and State Oil Company was horizontally integrated into one single incorporation, giving way to Pakistan State Oil (PSO). The strategic integration of all private oil enterprises into one single mega corporation was considered the pivotal success of the Nationalization Program of Pakistan People’s Party. A1.3. Since then, the PSO has been under the directives of government‐ownership and proposals have been rebuffed to privatization process have been rebuffed. From 1999 to 2004, the PSO had undergone radical changes, both internal and external and has emerged with a new look and as a market presiding entity with a long‐term vision. The PSO is the only public sector entity in Pakistan that has been competing effectively with three foreign multinational, Shell, Caltex & Total. A1.4. The PSO is currently enjoying over 73% share of Black Oil market and 59% share of White Oil market. It is engaged in import, storage, distribution and marketing of various POL products including mogas, high speed diesel (HSD), fuel oil, jet fuel, kerosene, liquefied petroleum gas (LPG),compressed natural gas (CNG) and petrochemicals. PSO also enjoys around 35% market participation in lubricants and is blending/marketing Castrol brands, in addition to a wide array of its own. A1.5. It is considered as one of the most successful mergers in the history of Pakistan. The Mega Corporation has retail coverage of over 3,800 outlets, representing 80% participation in total industry network. The company has been the winner of Karachi Course: Introduction of bus. Finance ‐ Project Assignment, Submitted by Noman Khan. Std. ID: 57154 Page 1 of 19 01
- 10. Pakistan State Oil Financial Analysis Stock Exchange top companies award for many years and is a member of World Economic Forum. The PSO serves a wide range of customers throughout Pakistan including retail, industrial, aviation, marine and government/defense sectors. The PSO has been meeting the country’s fuel needs by merging sound business sense with national obligation. A2. BUSINESS AT A GLANCE: Pakistan State Oil (PSO), is the nation’s largest energy company, and is currently engaged in the marketing and distribution of various POL products including Motor Gasoline (Mogas), High Speed Diesel (HSD), Furnace Oil (FO), Jet Fuel (JP‐1), Kerosene, CNG, LPG, Petrochemicals and Lubricants. In addition to these products, we also import other products based on their demand patterns. A brief overview of each of PSO’s business facets is presented below: A2.1. MARKETING & DISTRIBUTION: A2.1.1. PSO possesses the largest distribution network in the country comprising of 3,689 outlets out of which 3,500 outlets serve the Retail sector and 189 outlets serve our bulk customers. Out of the total of 3,689 outlets, 1,691 Retail and 167 Consumer Business outlets have been upgraded with the most up‐to‐date facilities as per the visualization of the New Vision Retail Program. A2.1.2. PSO also operates 31 company‐owned and company‐operated (Co‐Co) sites serving the retail sector. Co‐Co sites are flagship stations which combine high levels of supervision and top quality products to maintain the highest level of efficiency, service and customer care. These sites act as benchmark for all other retail outlets. A2.1.3. In addition to retail customers more than 2,000 industrial units, business houses, power plants and airlines are being fueled by PSO. A2.2. ACQUISITION OF PRODUCTS: A2.2.1. The automotive sector is the main consumer of Motor Gasoline (Mogas) and High Speed Diesel (HSD) whereas Furnace Oil (FO) is marked for power plant usage. A2.2.2. To meet the supply deficit of the country, PSO imports Mogas, HSD, JP 1 and FO as and when required. The total import of black and white oil in Pakistan last year was 12.4 million metric tons and PSO had the lion’s share of this import with 11.2 million metric tons which came to over 90% of the total fuel imports of the country. Other than product imports, PSO acquired 1.75 million metric tons from various refineries based in Pakistan in order to cater to our market needs. A2.3. STORAGE: A2.3.1. PSO possesses the largest storage capacity in the country. The company’s infrastructure stretches from Karachi to Gilgit. With 9 installations and 23 depots located across the country PSO’s storage capacity of approximately a million metric tons represents 74% of the total storage capacity owned by all the oil marketing companies. Course: Introduction of bus. Finance ‐ Project Assignment, Submitted by Noman Khan. Std. ID: 57154 Page 1 of 19 02
- 11. Pakistan State Oil Financial Analysis A2.4. PRODUCT MOVEMENT: A2.4.1. PSO uses three mechanisms for the movement of POL products namely, tank lorries (road), tank wagons (railways) and pipelines. We currently have a total fleet of 8,595 tank lorries out of which 2202 tank lorries are New Vision tank lorries which are complying with the latest ADR standards and are equipped with pilferage proof tracker systems. With the commencement of operations of the White Oil Pipeline Project (WOPP) from Karachi to Mehmood Kot via Shikarpur and the MFM (Mehmood Kot/Faisalabad/Machikey) pipeline, the supply pattern for white oil from Karachi has switched from tank lorries to pipelines. PSO is present as a partner in this project and holds a 12% equity share in this venture. A2.5. LUBES MANUFACTURING & SALES: A2.5.1. PSO is steadily progressing in the field of lubricants. With state‐of‐the‐art Lubricants Manufacturing Terminal (LMT) located in Korangi Industrial Area, Karachi we are catering to a number of sectors including automotive, Hi‐street and industrial consumers through the provision of sectors including automotive, Hi‐street and industrial consumers through the provision of products. Course: Introduction of bus. Finance ‐ Project Assignment, Submitted by Noman Khan. Std. ID: 57154 Page 1 of 19 03
- 12. Pakistan State Oil Financial Analysis Financial Statement WHAT IS FINANCIAL STATEMENT? A financial statement (or financial report) is a formal record of the financial activities of a business, person, or other entity. Usually relevant financial information is presented in a structured manner and in a form easy to understand. They typically include basic financial statements, accompanied by a management discussion and analysis: ¾ Balance Sheet: A balance sheet, also referred to as a statement of financial position, reports on a company's assets, liabilities, and ownership equity at a given point in time. ¾ Profit or Loss Account/income statement: it is also known as a statement of comprehensive income, statement of revenue & expense, P&L or profit and loss report, reports on a company's income, expenses, and profits over a period of time. A profit and loss statement provides information on the operation of the enterprise. These include sales and the various expenses incurred during the stated period. ¾ Statement of cash flows: a company's cash flow activities, particularly its operating, investing and financing activities are reported through this report. B. FINANCIAL REPORTS: B1. PSO also record formally it all financial activities of its business and relevant financial information are presented in a structured manner and published through various available communication means of Pakistan such as newspaper and company annual Financial report that is readily available in official website of PSO. These statements are being presented to comply with the Code of Corporate Governance contained in the listing regulations of Karachi, Lahore and Islamabad Stock Exchanges for establishing a framework of good governance, whereby a listed company is managed in compliance with the best practices of corporate governance. B2. Being large and Complex Corporation, PSO also includes an extensive set of notes and management discussion and analysis that is an integral part of PSO’s annual financial statement. The notes in the PSO report typically describe each item on the balance sheet, income statement and cash flow statement in further detail. B3. There are usually following financial information are described in annual Financial reports of PSO ¾ Balance Sheet ¾ Profit & Loss Account (Income statement) ¾ Cash flow Statement ¾ Statement of Changes in Equity ¾ Statements of Compliance (with code of corporate governance) Course: Introduction of bus. Finance ‐ Project Assignment, Submitted by Noman Khan. Std. ID: 57154 Page 1 of 19 04
- 13. Pakistan State Oil Financial Analysis ¾ Auditors report o the members C. FINANCIAL STATEMENT ANALYSIS: C1. Financial analysis (also referred to as financial statement analysis or accounting analysis or Analysis of finance) refers to an assessment of the viability, stability and profitability of a business, sub‐business or project. C2. Professionals who prepare reports using ratios that make use of information taken from financial statements and other reports perform it. These reports are usually presented to top management as one of their bases in making business decisions. ¾ Continue or discontinue its main operation or part of its business; ¾ Make or purchase certain materials in the manufacture of its product; ¾ Acquire or rent/lease certain machineries and equipment in the production of its goods; ¾ Issue stocks or negotiate for a bank loan to increase its working capital; ¾ Make decisions regarding investing or lending capital; ¾ Other decisions that allow management to make an informed selection on various alternatives in the conduct of its business. C3. BALANCE SHEET ANALYSIS: C3.1. There are 6 year balance sheet from 2007 to 2012 from the PSO’s associated annual financial reports of have been shown for observing correspondence and trend of financial position, PSO's assets, liabilities, and ownership equity at the given financial years. Course: Introduction of bus. Finance ‐ Project Assignment, Submitted by Noman Khan. Std. ID: 57154 Page 1 of 19 05
- 14. Pakistan State Oil Financial Analysis BALANCE SHEET (2007‐2012) As per associated annual financial report (attached) ‐ Rupees in '000 2012 2011 2010 2009 2008 2007 ASSETS Non‐ Current Assets Property, plant and equipment 5831993 6084731 637523 6987025 7460549 8012317 Intangibles 299991 28822 36250 68872 105502 126212 Long term investments 1968073 2314168 2019270 2153514 2701097 2990591 Long‐term loans, advances and receivables 385497 324554 317889 405780 477745 627972 Long term deposits and prepayments 123740 148748 125951 83655 79098 65913 Deferred tax 1202316 957487 5737710 5033273 407337 401037 9811610 9858510 8874593 14732119 11231328 12224042 Current Assets Stores, spare parts and loose tools 134431 115339 113863 112143 115814 127891 Stock‐in‐trade 88523794 95378393 58598668 40698209 62360067 29562055 Trade debts 218022292 124721832 117501074 80509830 33904728 13599966 Loans and advances 526118 430716 409987 418015 396220 365974 Deposits and short term prepayments 2528406 1027381 367378 551803 401433 1583913 Other receivables 2122166 2252028 14557542 12806779 15681790 15751198 Taxation –net 5314752 6311951 46580 709627 Cash and bank balances 1624025 2309006 1778056 2883118 3018640 1522276 318795984 232546646 193373148 138689524 115878692 62513273 Net Assets in Bangladesh 28631610 30126760 88774593 14732119 11231328 12224042 Total Assets 347427594 262673406 282147741 153421643 127110020 74737315 EQUITY AND LIABILITIES Share Capital 1715190 1715190 1715190 1715190 1715190 1715190 Reserves 48244718 40187795 27620868 19155595 29249864 19224027 49959908 41902985 29336058 20870785 30965054 20939217 Non‐Current Liabilities Long term deposits 1176078 1023531 948476 854718 834598 768308 Retirement and other service benefits 2518502 2233717 1887751 1673020 1574148 1644063 3694580 3257248 2836227 2527738 2408746 2412371 Current liabilities Trade and other payables 246767460 191851017 156035716 110123702 81067565 41431075 Provisions 688512 688512 688312 688512 726116 688512 Accrued interest / mark‐up 544485 432133 3330213 5556380 217928 131961 Short term borrowings 45772649 24541511 13021015 18654526 10997908 9064781 Taxes payable ‐ ‐ ‐ ‐ 726703 79398 293773106 217513173 173075256 135023120 93736220 51395727 Total Equity & Liabilities 347427594 262973406 202247741 153421643 127110020 74737315 Course: Introduction of bus. Finance ‐ Project Assignment, Submitted by Noman Khan. Std. ID: 57154 Page 1 of 19
- 15. C4. BALA ANCE SHEE The PSO’s resource is that is 32 billions) as (Rs. 262.67 2011 that s owned or c and represe can be conc crisis & em prices in cause of th the concern to the vari because of related rece C4.1. C4.2. ET ANALYS total Assets being increa 2% of FY20 compared t 7 billions) a shows the c controlled t ent values o cerned into mergency of internationa his increase ned FY repo ation in tra ever‐increa eivables. Similarly shareholde approximat (shareholde as of 30 Ju Billions (ap same accou equity & li the positive of PSO. Course: Intro SIS: s is an eco asing in each 012 (Rs. 3 to the total a as on end apability of o produce v of ownership cash to avo f fall down al market. e as describ rt is primari de debt bal asing circular rising va r’s equi tely raise er equity) to une of FY 2 pprox.) are unt in the FY iabilities tre es value add oduction of bu nomic h year 347.43 assets of FY being values p that id any of oil Main ed by ly due lances r debt lues of ty that ed by o Rs. 49.96 B 012 that is ahead form Y 2011. The ends also su dition in the us. Finance ‐ Pr is 19% Billion Rs. 8 m the e total uggest assets roject Assignm total 5 4 Billion 3 2 1 0.0 0.0 0.0 0.0 0.0 0.0 40 00 30 Billions Billion 00 20 00 10 00 ment, Submitte Pa 0 kistan State Sh e Oil Financia hareholders 3 30.97 1 20.94 74.74 400 300 200 100 0 's Liabilities 2 20.87 Total Asse 127.11 Tota ets al Equity & L 1 74.74 127.11 ed by Noman K 2 153.42 Liabilities 2 153.42 Khan. Std. ID: 5 57154 49.96 3 82.15 262.67 47.43 34 262.97 202.25 4 41.90 29.34 al Analysis 47.43 07 Page 1 of 19
- 16. Pakistan State Oil Financial Analysis C5. PROFIT AND LOSS ACCOUNT ANALYSIS: As per associated annual financial report (attached) ‐ Rupees in '000 2012 2011 2010 2009 2008 2007 Sales Revenue 1199927902 974917064 877173254 71982176 583213959 411057592 Less: ‐ Sales tax ‐163861410 ‐137969158 ‐118563577 ‐97386723 ‐742494721 ‐52418310 ‐ Inland freight equalization margin ‐11642892 ‐16417542 ‐15851726 ‐9199864 ‐136859541 ‐8932956 ‐175504302 ‐154386700 ‐134415303 ‐106586587 ‐879354262 ‐61351266 Net sales / Revenue 1024423605 820530364 742757951 612695589 495278533 349706326 Cost of products sold ‐990101083 ‐786250059 ‐713591707 ‐609685478 ‐465254907 ‐337446896 Gross profit 34322522 34280305 29166244 3010111 30023626 12259430 Other operating income 2133994 1815951 1479054 1451666 1396527 1278932 Operating costs Transportation costs ‐1205394 ‐810423 ‐631849 ‐513673 ‐337886 ‐369328 Distr. & marketing expenses ‐5863170 ‐5178233 ‐4055238 ‐3960953 ‐3264599 ‐2745289 Administrative expenses ‐1659530 ‐1511532 ‐1125891 ‐1151793 ‐116074 ‐1002712 Depreciation ‐1127587 ‐1120999 ‐1137637 ‐1141698 ‐1119137 ‐1098157 Amortization ‐15491 ‐18210 ‐44752 ‐52615 ‐47689 ‐41908 Other operating expenses ‐9272048 ‐2239725 ‐2416518 ‐3994389 ‐3352969 ‐755420 ‐19143220 ‐10879122 ‐9411885 ‐10815121 ‐9283021 ‐6012814 Profit From Operations 17313296 25217134 21233413 ‐6353344 313860 424238 Other Income 7550581 4143710 6095348 776686 22450992 7949786 Finance costs ‐11658928 ‐11903162 ‐9882010 ‐6232056 ‐1367898 ‐1158112 13204949 17457682 17446751 ‐11808714 21083694 6791674 Share of profit of associates 469468 516752 516401 451850 294318 330306 Profit before taxation 13674417 17974434 17963152 ‐11356864 21377412 7121980 Taxation ‐4618362 3195120 ‐8913556 4658329 ‐7323617 ‐2432182 Profit for the year 9056055 14779314 9049596 ‐6698535 14053795 4689798 Earnings per share ‐ basic and diluted (In Rupees) 52.8 86.17 52.76 ‐39.05 81.94 27.34 08 Course: Introduction of bus. Finance ‐ Project Assignment, Submitted by Noman Khan. Std. ID: 57154 Page 1 of 19
- 17. C5.1. FIN SIS 2009: ct in the in g an inverse ned. This un ny is mainly tional oil pr the highest ber 2008. The Y09 as compa ther aspect o in Financial y er financial se NANCIAL CRI 1.1. As depi C5. C5. 1.2. The ano 15 5 10 0 5 0 ‐5 Billions ‐10 0 C5. the data an e behavior a expected de y endorsed ices. FY09 w level of US$1 e Company re ared to inven of loss that P ear 2009 aga ervicing cost a Profit P for the 14 4.69 4.05 2007 20 e year 9.05 008 2009 2 1.3. Downin 9 ‐6.70 nalysis chart as far as am ecline in the to heavy in itnessed shar 141/bbl in Jul egistered Rs. ntory gains of akistan State ainst profit af and the inven 9.06 2010 2011 2 ng of bar gr bility has dec of this decli that was o ation of Paki .3 billion on NCIAL RAT ERAL: . Financial a D. FINA D1. GEN D1.1. Course: Intro showing concern compan internat touched Decemb during F tax loss to highe of FY09. profitab cause o billions devalua of Rs. 2 9 14.78 2012 raph in FY 2 clined by 39 ne was due nly Rs. 0.7 b istani Rupee n account of TIO ANALY kistan State t that the fin mounting in e profitabilit nventory los rp fluctuation ly 2008 again 18.9 billion Rs. 11 billion e Oil Company fter tax of Rs. ntory losses w Billions 2012 shows % in financi e to the hea billions in F es against US reinstateme YSIS OF PSO analysts often ity as describ pter 6 and 7 r and stabil Rao, Chap oduction of bu O: n use the var bed in our tex ecommended us. Finance ‐ Pr 40.0 30.0 20.0 10.0 0.0 e Oil Financia nancial year the accoun ty of this lea sses suffer ns in internat nst the lowest on account o n during FY 08 y had reporte 14 billion du which incurre 12.2 26 some decli al year 2012 avy exchang y 2011 so t S Dollar tha ent of turnov ious element xtbook “Funda d by the instr roject Assignm r 2009 (red t of gross p ading marke because of tional oil pric t level of US$ of net invento 8. ed Rs. 6.7 bil uring FY 08, m ed during the Gross pr rofit 3.01 30.02 ne that is b 2 as compare ge losses am he company t is by 10% ver tax form ts of a firm su amentals of F ructor. ment, Submitte Pa bar) was profit are et shared a fall in ces, which $33/bbl in ory losses llion after mainly due e first half 34.32 because of ed to 2011 T mounting to y had to dea Approx. tax m 1% to 0.5 % ch as Solvenc Financial Man ed by Noman K after tax The main o Rs. 8.6 al with a x reversal by FBR. cy, profitabilit nagement” by Khan. Std. ID: 5 57154 34.28 29.17 al Analysis ty, , Liquidity y Ramesh Page 1 of 19 09
- 18. Pakistan State Oil Financial Analysis D1.1.1. Solvency ‐ its ability to pay its obligation to creditors and other third parties in the long‐term; D1.1.2. Liquidity ‐ its ability to maintain positive cash flow, while satisfying immediate obligations; D1.1.3. Stability ‐ the firm's ability to remain in business in the long run, without having to sustain significant losses in the conduct of its business. Assessing a company's stability requires the use of the income statement and the balance sheet, as well as other financial and non‐financial indicators. etc. D1.1.4. Profitability ‐ its ability to earn income and sustain growth in both the short‐ and long‐term. A company's degree of profitability is usually based on the income statement, which reports on the company's results of operations; D1.1.5. Both D1.1.1 and D1.1.2 are based on the company's balance sheet, which indicates the financial condition of a business as of a given point in time. We will examine this type of ratio analysis for PSO with the help of previously mentioned data & report. D2. SHORT‐TERM SOLVENCY RATIO: D2.1. GENERAL DESCRIPTION: D2.1.1. Often take a close look at liquidity ratios when performing fundamental analysis on a firm. Since a company that is consistently having trouble meeting its short‐term debt is at a higher risk of bankruptcy, liquidity ratios are a good measure of whether a company will be able to comfortably continue as a going concern. D2.1.2. Liquidity or sort term solvency ratio analyses ratios are taken here to determine PSO’s ability to meet its short‐term debt obligations for fining that has the PSO have enough cash or assets readily convertible into cash to pay its current liabilities. D2.1.3. Here we will calculate two types of ratios to measure liquidity; the current ratio and the Quick ratio D2.2. CURRENT & QUICK RATIO: D2.2.1. The formula for the current ratio & quick ratios are as follows: CURRENT RATIO = Current Assets ÷ Current Liabilities Similarly, QUICK RATIO = (current assets – inventories – prepaid expenses) ÷ Current Liabilities 2012 2011 2010 2009 2008 2007 Solvency Ratios Cash to Current Liabilities (x) ‐0.06 ‐0.09 ‐0.05 0.09 ‐0.08 ‐0.03 Cash Flow from Operations to Sales (x) ‐0.02 ‐0.01 0.01 ‐0.01 0.01 0.01 Current Ratio (x) 1.15 1.16 1.14 1.07 1.24 1.22 Quick Ratio (x) 0.85 0.72 0.79 0.75 0.57 0.64 Course: Introduction of bus. Finance ‐ Project Assignment, Submitted by Noman Khan. Std. ID: 57154 Page 10 1 of 19
- 19. 1.25 5 1.2 2 1.15 1. 5 1 1.05 5 1 0.95 5 D3. ASSE Cur rrent Ratio (x 1. 1.22 .24 2007 2 x) 1. 1.07 .14 2008 2009 2 .15 2010 2011 20 s shown in t 18795984, a tio of 1.15. as a higher hould easily b quidated and eluctant to lo e supplier sh 1.16 1 012 the above t and it’s the The higher amount of be able to p d PSO neve oan money hould not be SO’s quick ra 85 of liquid e quick ratio ss than one epay all its d uick ratio is a ATION RAT DESCRIPTIO sset utilizati etermines t to revenue b ctivity ratios orm of cash xamples of eceivable tur ndamentals enerates rev anaged. The ET UTILIZA . GENERAL D3.1.1. As D3.1. Course: Intro D2.2.2. As 31 ra ha sh liq re th D2.2.3. PS 0. th les re qu de int D3.1.2. Ac fo Ex re fu ge m oduction of bu 1 0.8 0.6 0.4 0.2 table & the current liab numbers (m current ass ay off its sho r have any to PSO simi e worried fo atio of 0.85 assets avail o, the bette indicates th debts by usin advancing to TIOS: ON: ion Ratio th the ability by relating o s assess how h and sales f such ra rnover ratio s because, venue, activ ere are three us. Finance ‐ Pr 0 0.64 2007 kistan State 2008 2009 graph, the ilities are R more than “1 sets when c ort‐term deb problem pay larly the hig or giving bulk in FY 2012 lable to cove er the compa hat a PSO ha ng its most owards Rs. 1 e Oil Financia Quick Rat 0.75 0.57 tio (x) PSO’s 2012 Rs 29377310 1” are better ompared to bt using its a ying its bills gher current k supplies on means that er each Rs.1 any's liquidi as a potenti liquid asset that is good hat is also of a comp or comparing w effectively based on atios includ o. Activity r al Analysis 2012 current ass 06. That sho r, implying th o current lia assets that c s on time ba ratio also s n credit to PS this oil & lu of current ty position, al risk that ts. The abov d/positive si known as pany to co g sales to dif a company its asset, lia de the in ratios are c on to exp lso indicate o analysis sh in additio ity ratios a e major ratio roject Assignm ment, Submitte Pa 0.85 sets are Rs; ows current hat the PSO abilities and an be easily ank will not suggest that SO. ubrication co liabilities. If here the qu it would not ve 05 year t gn. turnover ra nvert its ba fferent types is able to g ability and c nventory rat critical in ev pressing ho how well all be condu ed by Noman K ompany Rs. f the higher uick ratio of t be able to rend shows atio is a me alance shee s of assets. generate rev capital share io and th valuating a ow well a the compa ucted for PSO Khan. Std. ID: 5 57154 0.72 0.79 2010 2011 2 etric, which et accounts venue in the accounts. he accounts company's company ny is being O: 11 Page 1 of 19
- 20. D3.2. . INVENTOR D3.2.1. Th D3.3. RY TURNOVE his ratio me urned over d ventory Tur ER. asures the during a giv nover as des Inventory T number of t ven year. Th scribed in ch urnover = he turnove ttached bar dequacy of P he volume andled. The ventory tur bove the in mply mea aintaining t etween inve oods sold so o be a safe s op‐heavy inv oil/lubricatio mply implie usiness asse urnover requ vel of sales ventory at a uch invento ventories. . FIXED ASS D3.3.1. Th Course: Intro tu In D3.2.2. Th at ad th ha inv ab sim m be go to to (o sim bu tu lev inv m inv er ratio graph indica PSO’s inven of busines e company rnover rate dustry aver n that P the better entory and the busines side and the ventory in ns) or finish es that the ets producin uires a smal with a low t level that ory should n ETS TURNOV he fixed (o urnover rati tensively a uch as lan quipment ar ales. A lo urnover impl oo much in ssets relativ asically a roductivity. hows how ssets turnove tu int su eq sa tu to as ba pr sh as oduction of bu kistan State times a com he following hapter 07 of e Oil Financia mpany's inve g method is our text boo ods sold = ories in the ates the tory for s being has an that is rage, its PSO is balance cost of ss is said ere will be l the event hed produc PSO is mor ng an extra ler investme turnover rat is just right ot be the ca VER. or capital) io measure firm's fixed d, building e used to ge ow fixed lies that a fi vestment in ve to sales assets es how assets s, and enerate assets irm has n fixed s; it is e of llowing measure The fo Eastman's er ratio is ca us. Finance ‐ Pr alculated. roject Assignm Cost of goo Invento fixed 20 15 10 5 0 In 11.7 al Analysis estment in i s used to ca ok: nventory tur 2007 ____times ess risk for of a declin t. PSO’s tur re productiv a inventory/ ent in inven e. PSO’s ma t in order no ase where c 250 200 150 100 ment, Submitte Pa 50 0 inventory is alculate the rnover ratio 13.96 12.69 2008 2009 the busines ne in the p rn over rati ve since ev /asset. Sinc tory than on anagement ot to miss s capital has b Fixed 52 (x) 6 13.05 2010 2011 1 2012 ss of being c price of raw os in the p ery Rupee ce a PSO w ne producin has to be su sales, availab bound for un d asset turno 2007 ed by Noman K caught with w materials positive site invested in with a high ng the same ure, to keep bility of too nproductive over ratio (x 98.38 74.27 2008 2009 Khan. Std. ID: 5 57154 12.66 17.67 x) 200.39 8 155.68 130.27 2010 2011 2012 Page 1 of 19 12
- 21. Pakistan State Oil Financial Analysis Fixed Assets Turnover = net Sales . = _____times Net Fixed assets D3.3.2. Overall trend of fixed asset turnover (asset utilization) ratios have not as flat as compared to the inventory ratio, the fixed asset turnover ratio has increased because of increasing in turnover and less capitalization of property plant and equipment as compared to last year, so higher the turnover ratio, suggests that the PSO is being using more assets efficiently to generate sales. D3.4. TOTAL ASSETS TURNOVER. D3.4.1. This ratio takes into account both net fixed asset; and current assets. It also gives an indication of the efficiency with which assets are used; a low ratio means that excessive assets are employed to generate sales and/or that some assets (fixed or current assets) should be liquidated or reduced. Eastman's total assets turnover is as follows: Total Assets Turnover = Sales , = ____times Total assets D3.4.2. In the case of FY 2012, the company produces Rs. 3.93 worth of sales for every Rupee invested in total assets. It is recommended/suggested that If PSO is able to reduce its investment in accounts receivable and inventory and/or sell a division or fixed assets that are a burden on the company's operating performance, it would increase the total assets turnover ratio and thus would be more productive. 2012 2011 2010 2009 2008 2007 Asset Utilization / Turnover Ratios Inventory turnover ratio (x) 13.05 12.66 17.67 13.96 12.69 11.7 Total asset turnover ratio (x) 3.93 4.19 4.93 5.13 5.78 5.7 Fixed asset turnover ratio (x) 200.39 155.68 130.27 98.38 74.27 52 D3.5. TURNOVER RATIOS AT A GLANCE: D3.5.1. At a glance we can say on the basis of above graphical representation, The various turnover rations indicate the adequacy of PSO’s inventory for the volume of business being handled. The company has an inventory turnover rate that is above the industry average, it’s simply mean that PSO is maintaining the better balance between inventory and cost of goods sold so the business is said to be a safe side and there will be less risk for the business of being caught with top‐heavy inventory in the event of a decline in the price of raw materials (oil/lubrications) or finished product. PSO’s turn over ratios in the positive site simply implies that the PSO is more productive since every Rupee invested in business assets producing an extra inventory/asset. Course: Introduction of bus. Finance ‐ Project Assignment, Submitted by Noman Khan. Std. ID: 57154 Page 13 1 of 19
- 22. D4. PRO OFITABILITY . Profitabilit D4.1. 200 150 100 50 0 52 5.7 2 Y RATIOS: ty ratios me nancial metr to its expe hese ratios, h evious period following c tatement) fo class of fin compared most of th from a pre . There are (income st D4.2. Course: Intro PSO Profitabilit Gross Profi Net Profit M EBITDA ma Return on S Return on t 11.7 Invento Total a Fixed a 74.27 ory turnover ra sset turnover asset turnover 5.78 12.69 easure the o rics that are enses and ot having a high d is indicativ components or finding pro y Ratios t Margin Margin rgin Shareholders total assets oduction of bu atio (x) ratio (x) ratio (x) 13.96 98.38 5.13 overall recor used to ass ther relevan her value re ve that the c are evaluat ofit margins ' Equity % us. Finance ‐ Pr % % % % roject Assignm 2012 2.86 0.75 2.21 18.13 2.61 17.67 130.27 4.93 kistan State 15 55.68 rd of manag ess a busine nt costs incu elative to a c ompany is d ted that is e : ment, Submitte Pa 2011 12.66 4.19 e Oil Financia 200.3 9 3.93 gement in p ess's ability t urred during ompetitor's doing well. extract from 13.05 producing p to generate g a specific ratio or the rofit, it is a earnings as period. For e same ratio m Profit & lo 2010 20 3.52 1.52 3.18 35.27 3 5.63 oss account 009 2008 3.32 0 1.03 ‐0 3.31 ‐0 30.85 ‐3 4.47 ‐4 ed by Noman K 8 2007 0.42 5.15 0.93 2.41 0.55 4.1 32.1 45.39 4.37 11.06 Khan. Std. ID: 5 57154 al Analysis 5 3 1 1.14 1 2.29 9 22.4 6 6.3 Page 14 1 of 19
- 23. 6 5 4 3 2 1 0 D4.3. Gro ss Profit ratio 5. 3 15 . The last 6‐ that how manufactu is a favora . PSO’s char thereof, h exercise co retailers a expense i services", the same w . The Retur because it assets and Net Incom D4.4. D4.5. D4.6. o /margin % 3.32 3 3.52 0.42 ‐year (2007‐ the compa uring‐related ble profit ind racteristics of ave a major omplete con nd service b s recorded respectively weight as a p rn on total t measures t d using them me/Total As . The higher in the abo its assets t benefit rec . The profit compared D4.7. Course: Intro 2 2.86 2012) gross any is effici d fixed asset dicator. f raw materi r effect on a ntrol over s businesses) as a "cos y. With this producer‐typ Assets ratio the efficienc to generate ssets = _____ r the percen ove table th to generate ceived by sh tability ratio to FY 2011 & oduction of bu 6 5 4 3 2 1 0 ‐ profit marg ently & eff ts to genera 1 kistan State e Oil Financia Profit ratio / 2 Net 1.14 2007 2.41 Margin % 2008 2009 2 in & net pro fectively us te profits. A ial costs, par company's uch costs. C don't have a t of merch type of com pe company o in the ab cy with whic e profit. The _%. ntage (2.63% he better, be sales. The o areholders os also show us. Finance ‐ Pr 2010. 1 ‐0.93 ocess margin ing its raw higher mar rticularly as gross marg Companies w cost of sa handise/mat mpany, the g y. bove table ch the comp calculation % in FY 2012 ecause that overall it sho al Analysis 0.75 2012 n analysis of w materials, rgin percent these relate in. Generall without a p les exactly. terials/opera gross profit PSO reflect labor and age in 2008 e to the stab y, managem roduction p In these ins ation" and margin doe is an impor pany is man for the retu & higher sig means the c ows survivab wed a little roject Assignm bility or lack ment cannot process (ex., stances, the a "cost of es not carry rtant profita aging its inv rn on assets ght 5.63% in company is bility of PSO e decline in ment, Submitte Pa ed by Noman K ability ratio vestment in s ratio is: n FY2011) , a doing a goo in future as FY 2012 e as described od job using s well as the 0th June, as nding in 30 Khan. Std. ID: 5 57154 0 1.52 1.03 2010 2011 2 Page 15 1 of 19
- 24. D5. INVE ESTMENT R . This last s attractiven study of h Investmen comfortab financial a . An analysi investmen factors sh decision at . The follow depicted in D5.1. D5.2. D5.3. Inv Ear Ear Ma D5.4. RATIOS AN section of t ness of a po ow an inves nt analysis i ble doing th dvisor. s of past inv nt decisions ould includ t the time. wing are the n the table: estment/Ma rning per shar rning per shar rket value pe . As of June earning tre few loss o reinvestme requireme Course: Intro NALYSIS: the ratio a otential or e stment is lik is key to an heir own in nalysis that existing inve kely to perfo ny sound p vestment a vestment de and the th e entry pric kistan State t can be us estment and orm and how portfolio‐ma nalysis can e Oil Financia sed by inve d get an ide w suitable it nagement s seek profe investment cess of mak d time hori ecisions. An hought proc ce, expecte e trend ext rket Ratios re re (Diluted) er share (Year 2012, inves end as comp of Earnings ent of majo ents due to p oduction of bu 400 350 300 250 200 150 100 50 0 ‐50 racted from r End) Rs. stment or M pared to pre per Share or portion of prevailing cir 391.45 18 18.99 99 2007 us. Finance ‐ Pr Rs. Rs. estors to es ea of its val is for a give strategy. Inv essional adv analysis is a king the inv izon, and re m various st stimate the uation. The en investor. vestors not vice from a look back vestment de easons for tatement fo at previous ecision. Key making the or the given 2010 20 86.17 5 59.83 3 264.58 2 on the graph and now sta s compared ngs in order situation. Market ratio o evious year a in 2012 a f net earnin rcular debt s 8 417.24 27.34 56.9 2008 213.65 81.94 roject Assignm 2012 52.8 36.67 235.84 Ear Ear Ma n years and 009 2008 52.76 ‐39 36.64 ‐27 260.2 213 h showing a able after fin d to FY 201 to meet th ning per share ning per share rket value per 8 2007 .05 81.94 .12 56.9 .65 417.24 little bit con nancial crise 11 mainly d he tight wor e Rs. e (Diluted) Rs. r share (Year E 260.2 264 ‐39.0 ‐27.12 2009 05 ment, Submitte Pa 2011 2 52.76 36.64 2010 4.58 ed by Noman K nd) Rs. 235.84 86.17 59.83 2011 4 36.67 2012 Khan. Std. ID: 5 52.8 57154 al Analysis 4 27.34 9 18.99 4 391.45 nsistency of s 2009. The due to the king capital 16 Page 1 of 19
- 25. Pakistan State Oil Financial Analysis E. INTER‐MARKET ANALYSIS – COMPETITORS: E1. KEY HIGHLIGHTS – FY2012‐13: E1.1. Highest ever turnover of Rs. 1.3 trillion achieved vs. Rs 1.2 trillion Last year. E1.2. Profit a Vertax of Rs. 12.6 billion vs. Rs. 9.1 billion in FY12 (EPS: Rs. 50.84, FY12: Rs.36.67) E1.3. GoP injected Rs. 82 billion (PSO’s share Rs. 70.5 billion) and Rs. 342 billion (PSO’s share Rs. 99 billion) in Sept 2012 and June 2013 respectively to resolve circular debt. E1.4. PSO’s receivable From Power Sector dropped Significantly from Rs. 205 billion To Rs. 59 billion E1.5. Finance cost Dropped from Rs. 11.7 Billion To Rs. 7.6 billion Mainly due to saving Of refinery Interest on implement on Of TFC Transaction proposed by PSO in Sept 2012. E1.6. Interest received from HUBCO, KAPCO & PIA Rs. 2.7 Billion vs Rs. 6.7 billion in the same period Last year. E1.7. Exchange Loss of Rs.3.3 Billion vs. Rs. 8.7 Billion in FY12 Due to rupee devaluation of 5% Approx vs. 10% In FY12. E1.8. PSO secured 3rd position in Best Corporate Report Awards Ceremony held on August 22, 2013 E2. OPERATIONAL HIGHLIGHTS: E2.1. 2% fall in Black Oil segment vs 1% industry increase. (Decline due to reduction in supply on account of circular debt) E2.2. 6% growth in White oil segment vs 5% industry growth. E2.3. Positive volumetric growth of 24% in Mogas vs 21% industry growth due to CNG shortage. E2.4. Growth in HSD volumes of 2% vs industry stability. E2.5. Market share decreased slightly from 65.4% to 64.3% in FY 2013. 17 Course: Introduction of bus. Finance ‐ Project Assignment, Submitted by Noman Khan. Std. ID: 57154 Page 1 of 19
- 26. Pakistan State Oil Financial Analysis E3. SUMMARY OF FINDINGS ‐ SUGGESTIONS FOR IMPROVEMENT: E3.1. The company successfully tested and launched E‐10 Gasoline at more than 70 outlets in Sindh and Punjab provinces during FY10. E‐10 is a blend of ethanol and gasoline, which consists of 10 percent ethanol dissolved in normal gasoline. This initiative is in line with the government s strategy to promote alternate energy resources. E3.2. MOU with KPT was signed and Terms of Reference were finalized during the period under review for conducting feasibility study to connect Keamari Port with Port Qasim through a pipeline. In FY10, the company completed study for optimization of current infrastructure at Port Qasim. This would enable enhancement of imported petroleum products handling capacities of FOTCO Jetty and PSO pipeline infrastructure. E4. FUTURE OUTLOOK: E4.1. It is expected that future energy demand in the country will continue to grow owing to expected natural gas constraints specifically for power generation sector. PSO plans to acquire a refinery as part of its backward integration strategy to develop a confirmed supply source and reduce reliance on imports. E4.2. In the current fiscal year, PSO shall focus on improving service at its retail outlets and promoting the environment‐friendly ethanol based gasoline ie E‐10. By the end of 2010, PSO plans to have E‐ 10 available at 100 outlets across the country. E4.3. The circular debt crisis held PSO back in FY10 and it had to shelve its plans for enhancement of the storage network. PSO plans to augment its storage infrastructure to meet the future oil demand. A development/upgradation plan for key storages in line with future Furnace Oil demand for IPPs has been chalked out. PSO is also working on a scoping study to connect Keamari with Port Qasim through a white oil pipeline. It is expected that efficiency and flexibility shall be increased manifold if these two ports are connected to each other through an integrated pipeline system. E4.4. IFEM deregulation awaits implementation, and if implemented would certainly change market dynamics. PSO is expected to benefit from this deregulation with the largest distribution network in the country. This would result in setting competitive market prices and increase its market share in the southern region. However, Punjab would continue to remain a competitive region. F. REFERENCE: F1. PSO annual Reports (2007 to 2013) F2. Fundamentals of Financial Management by Ramesh K.S. Roa (Chapter 6 & 7) F3. PSO Official Website (www.psopk.com) F4. Financial Ratio Tutorial Investopedia ( http://www.investopedia.com) F5. Economics and Finance Department, Institute of Business Administration, Karachi, prepared this analytical report for Business Recorder. Course: Introduction of bus. Finance ‐ Project Assignment, Submitted by Noman Khan. Std. ID: 57154 Page 1 of 19 18
- 27. Pakistan State Oil Financial Analysis G. APPENDICES (Attachments): G1. Appendix “A” a) Appendix A1 – Balance sheet 2007 b) Appendix A2 – Profit & Loss Account Statement 2007 c) Appendix A3 – Cash flow statement 2007 G2. Appendix “B” a) Appendix B1 – Balance sheet 2008 b) Appendix B2 – Profit & Loss Account Statement 2008 c) Appendix B3 – Cash flow statement 2008 G3. Appendix “C” a) Appendix C1 – Balance sheet 2009 b) Appendix C2 – Profit & Loss Account Statement 2009 c) Appendix C3 – Cash flow statement 2009 G4. Appendix “D” a) Appendix D1 – Balance sheet 2010 b) Appendix D2 – Profit & Loss Account Statement 2010 c) Appendix D3 – Cash flow statement 2010 G5. Appendix “E” a) Appendix E1 – Balance sheet 2012 b) Appendix E2 – Profit & Loss Account Statement 2012 c) Appendix E3 – Cash flow statement 2012 Note: Financial statement for FY2011 in not printable mode that may be viewed in official website of PSO Course: Introduction of bus. Finance ‐ Project Assignment, Submitted by Noman Khan. Std. ID: 57154 Page 19 1 of 19