More Related Content
Similar to Engineering cells
Similar to Engineering cells (20)
More from Oscar1Miranda2 (20)
Engineering cells
- 1. ©2014NatureAmerica,Inc.Allrightsreserved.
protocol
nature protocols | VOL.9 NO.2 | 2014 | 233
INTRODUCTION
The success of exogenous cell therapies depends on the fate,
function and viability of cells after transplantation. Controlling
the phenotype and engraftment of cells after transplantation is
crucial for the success of cell-based therapies. Unlike the exquisite
control that one can exert over cells in a culture dish, once cells are
transplanted they are entirely at the mercy of the biological milieu
and behave differently depending on their location. The lack of
control of transplanted cells leads to variability in cell function
and ultimately poor therapeutic outcomes1,2.
Both allogeneic and autogenic cell-based therapies are prone
to variability because of heterogeneity within and between cell
populations that can be affected by differences in donors, isola-
tion techniques and culture mediums. For example, the propen-
sity of embryonic stem cells and induced pluripotent stem cells
(iPSCs) to differentiate into specific lineages has been shown to
vary markedly within and between cell lines3.Variation in the glu-
cose sensitivity of transplanted pancreatic islets can lead to a fail-
ure to restore insulin independence4. In addition, mesenchymal
stem cell (MSC) differentiation efficiency down osteogenic,
chondrogenic or adipogenic lineages is strongly influenced by
the MSCs’ tissue of origin5. Furthermore, the ability of MSCs to
secrete growth factors, chemokines and cytokines in response to
inflammatory stimuli and suppress activated T cells varies consid-
erably between donors2,6. Specifically, MSC secretion of vascular
endothelial growth factor6, a primary mediator of MSCs’ ang-
iogenic potential,and production of indoleamine 2,3-dioxygenase2,
a primary mediator of MSCs’ immunomodulatory potential,
vary depending on the donor from which the MSCs are isolated.
Thus, there is a need to develop methods to polarize MSCs toward
therapeutic phenotypes to maximize their therapeutic potency
regardless of their source. Although small-molecule drugs have
the ability to influence MSC phenotype in vitro7–10, applying pre-
conditioning regimens to transplanted cells has been substantially
limited given that they typically activate signal transduction path-
ways only for short durations and thus the induced effects do not
persist after transplantation.
Development of particle-engineered cells
To maximize potency, establish stable control of cell phenotype
and longitudinally track cell distribution after transplantation, we
developedatechniqueforengineeringcellswithintracellularagent–
loaded microparticles11. By using an osteogenic differentiation
assay, we demonstrated the ability of internalized dexamethasone-
loaded microparticles to stimulate uniform differentiation of
MSCs11. Furthermore, drug released from particle-engineered
cells into the microenvironment induced the differentiation of
unmodified neighboring and distant cells in a paracrine-like and
endocrine-like manner (see Sarkar et al.11 for a detailed report).
In addition to establishing control over MSC differentiation, we
observed that the efficiency of MSC particle internalization was
dependent on the size (assessed by dynamic light scattering (DLS)
and confocal microscopy), as well as on the surface properties of
PLGA microparticles11.
PLGA microparticles were formed from PLGA with a car-
boxylic acid end group, resulting in particles with a negative
ζ-potential. The surface properties of particles was then modi-
fied through adsorption of polycationic polymers (poly-L-lysine,
PLL) or chemical conjugation of antibodies or lipids to the par-
ticle surface by using N-hydroxysuccinimide-biotin chemistry
(EX-Link NHS-Biotin, Thermo Scientific)11. Confocal micros-
copy was used to evaluate the efficiency of particle uptake by
MSCs. MSCs more efficiently internalized antibody-coated
or positively charged particles over negatively charged parti-
cles (ζ-potential measured by Zetasizer)11. Although multiple
cell types efficiently internalize nanoparticles, substantial par-
ticle leakage through exocytosis has been documented12–16.
Engineering cells with intracellular agent–loaded
microparticles to control cell phenotype
James A Ankrum1,2, Oscar R Miranda1,2, Kelvin S Ng1,2, Debanjan Sarkar3, Chenjie Xu4 & Jeffrey M Karp1,2
1Department of Medicine, Brigham and Women’s Hospital, Harvard Medical School, Boston, Massachusetts, USA. 2Harvard-MIT Division of Health Sciences and
Technology, Harvard Stem Cell Institute, Cambridge, Massachusetts, USA. 3Department of Biomedical Engineering, University at Buffalo, The State University of
New York, Buffalo, New York, USA. 4Division of Bioengineering, School of Chemical and Biomedical Engineering, Nanyang Technological University, Singapore.
Correspondence should be addressed to J.M.K. (jeffkarp.bwh@gmail.com).
Published online 9 January 2014; doi:10.1038/nprot.2014.002
Cell therapies enable unprecedented treatment options to replace tissues, destroy tumors and facilitate regeneration. The greatest
challenge facing cell therapy is the inability to control the fate and function of cells after transplantation. We have developed
an approach to control cell phenotype in vitro and after transplantation by engineering cells with intracellular depots that
continuously release phenotype-altering agents for days to weeks. The platform enables control of cells’ secretome, viability,
proliferation and differentiation, and the platform can be used to deliver drugs or other factors (e.g., dexamethasone, rhodamine
and iron oxide) to the cell’s microenvironment. The preparation, efficient internalization and intracellular stabilization of ~1-mm
drug-loaded microparticles are critical for establishing sustained control of cell phenotype. Herein we provide a protocol to
generate and characterize micrometer-sized agent-doped poly(lactic-co-glycolic) acid (PLGA) particles by using a single-emulsion
evaporation technique (7 h), to uniformly engineer cultured cells (15 h), to confirm particle internalization and to troubleshoot
commonly experienced obstacles.
- 2. ©2014NatureAmerica,Inc.Allrightsreserved.
protocol
234 | VOL.9 NO.2 | 2014 | nature protocols
In addition, nanoparticles (<200 nm) typically exhibit lower drug
loading and faster release compared with larger microparticles,
limiting sustained control of cell phenotype. In contrast to nano-
particles that can be quickly exocytosed or cellular backpacks that
are designed to remain on the cell surface17,18, we discovered that
particles ~1 µm in diameter remained internalized within MSCs
for several weeks.
To demonstrate the utility of this approach as a platform, we
recently adapted it to enable longitudinal tracking of MSCs after
transplantation. Tracking the location, engraftment and distri-
bution of cells after transplantation is crucial for evaluating the
success of cell-based therapies.Although iron oxide nanoparticles
have been used to track cells by MRI, low iron content per cell
and nanoparticle exocytosis prevented detailed and longitudinal
monitoring of a cell’s location. To overcome these limitations,
iron oxide nanoparticles were encapsulated within ~1-µm PLGA
microparticles, resulting in substantially enhanced iron oxide
loading and increased r2 relaxivity of MSCs19. In addition, the
enhanced residence time of microparticles within MSCs ena-
bled cells to be detected by MRI for >12 d compared with only
4–6 d for nanoparticle-engineered MSCs (see Xu et al.19 for a
detailed report).
We have shown that particle formulations containing dexa
methasone, rhodamine or iron oxide remain stable within MSCs
for >18 d, making this a useful platform for prolonged exposure
to small molecules11 and simultaneous longitudinal tracking
of a cell’s location19. Furthermore, particle-engineered MSCs
maintain their phenotype after cryopreservation, thus enabling
off-the-shelf control of MSC phenotype11.
Nuances and limitations of the particle engineering platform
Previously, we have shown the flexibility of the platform through
cell internalization of particles encapsulated with hydrophobic
small molecules, rhodamine 6G and dexamethasone, as well as
iron oxide nanoparticles11,19. Drug loading and release kinetics
can be tuned for specific applications by modifying the particle
synthesis protocol through changing the composition and molec-
ular weight of the polymer (e.g., 10-kDa PLGA degrades faster
than 50-kDa PLGA, and it will result in a faster drug release).
Each new batch of particles must be analyzed for drug loading
and release profile as described in this protocol.
Although we anticipate that adaptation of the platform to other
hydrophobic drugs will be straightforward, encapsulation and
delivery of hydrophilic molecules including peptides, proteins,
DNA and RNA have yet to be optimized for this platform and will
require substantial modification and optimization of the proto-
col. Hydrophilic small molecules can be adapted to the platform
by modifying particle synthesis. For example, co-solvents, such
as methanol or trifluoroethanol, or double-emulsion techniques
can be used to enhance the encapsulation of hydrophilic small
molecules in microparticles20–22. Thus, iteration of particle
formulation strategies should enable adaptation of the particle-
engineered MSC platform to hydrophilic drugs.
Over the past 20 years, numerous strategies have been devel-
oped to influence the kinetics of drug release from polymeric
particles by modifying the choice of solvent, initial drug load-
ing and the molecular weight and composition of the polymer.
We anticipate that these strategies can readily be adapted to this
protocol to tune release kinetics to continuously release drugs
over days to weeks and potentially even months depending on
the application.
In addition to small molecules, many biological agents includ-
ing proteins, RNA and DNA have been used to control a cell’s
phenotype, including its expression of cell surface receptors,
secretome and differentiation23–27.Although techniques for deliv-
ering these agents have been established, substantial challenges
remain and care must be taken not to damage the structure of the
molecules. Secondary and tertiary structures may be damaged
during particle synthesis, owing to exposure to organic solvents
and high-intensity agitation, or upon sorting to acidic lysosomes
after particle endocytosis.
Although PLGA nanoparticles have been reported to undergo
endolysosomal escape to deliver genes and siRNA28–31, achiev-
ing efficient intracellular delivery without inducing cytotoxicity
remains a challenge32. In addition, if the goal is to deliver the agent
to an extracellular target, as in the case of growth factors that bind
to cell surface receptors, the agent must be able to transverse the
plasma membrane via diffusion or active transport. Therefore,
although this platform can be easily adapted to accommodate a
variety of agents, a molecule’s structure, target and susceptibility
to degradation should be considered.
In addition, we anticipate that the platform could potentially
be adapted to accommodate the use of particles made from other
materials such as alginate, which may be desirable for encapsu-
lating hydrophilic or sensitive molecules such as peptides or
proteins.
With these considerations in mind, the protocol herein will
serve as a guide for successfully establishing nonviral transient
control over locally or systemically administered cells to develop
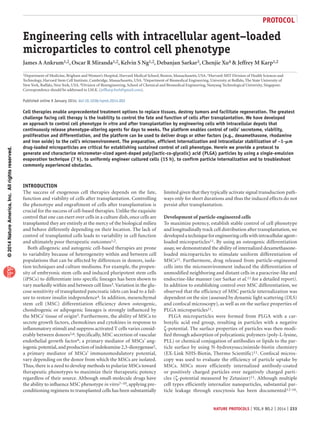
more effective cell-based therapies (Fig. 1).
Particle formation
Particle preservation
Basic characterization
Incubate particles with cells
Wash and replate
Downstream applications
Characterize particle
internalization and effect
on cell phenoypte
Drug activity, drug
loading and
release kinetics
Day 1
Day 2
Day 3
Day 3
Day 4
Day 5
i ii iii
Surface modification
Figure 1 | Flow diagram for the particle engineering protocol. Generation
and characterization of appropriately sized and charged particles are
essential to achieve consistent particle internalization by cells. Drug activity,
loading and release kinetics should be studied to determine the optimal
particle characteristics for each application. If drug activity is lost, loading
is too low or release kinetics are inappropriate for the intended application,
adjustments to the particle formation protocol should be made and new
particles should be generated. Once particles with desired characteristics
have been formed, cells can be engineered with particles, characterized and
used in downstream applications. The dashed lines represent iterative loops
to follow whether poor particle internalization is observed: (i) particles are
aggregated; (ii) particles have negative charge; or (iii) particles are too
large to be internalized. White boxes represent steps involving only particles,
whereas gray boxes represent cells in culture and may require additional lead
time to expand cells to the appropriate confluence.
- 3. ©2014NatureAmerica,Inc.Allrightsreserved.
protocol
nature protocols | VOL.9 NO.2 | 2014 | 235
MATERIALS
REAGENTS
Particle preparation
50:50 poly(dl-lactic-co-glycolic)-COOH (PLGA), i.v. 0.15–0.25 g dl−1
(Lactel Absorbable Polymers, cat. no. B6013-1)
50/50 poly(dl-lactic-co-glycolic)-COOH (PLGA), i.v. 0.55–0.75 g dl−1
(Lactel Absorbable Polymers, cat. no. B6013-2)
Dichloromethane (DCM) (Sigma-Aldrich, cat. no. 270997-100ML)
! CAUTION DCM is an eye and skin irritant and harmful if swallowed.
Use proper personal protective equipment (PPE) and always work in a
chemical fume hood.
Poly(vinyl alcohol) (PVA), Mw 9,000–10,000, 80% hydrolyzed
(Sigma-Aldrich, cat. no. 360627-25G)
Filtered water (Milli-Q water or Sigma-Aldrich, cat. no. W4502-1L)
Glass scintillation vials with polyvinyl-lined caps (VWR, cat. no. 66010-267)
Rhodamine 6G (Sigma-Aldrich, cat. no. 252433-250MG)
Poly-l-lysine hydrochloride, MWCO >30,000 Da (Sigma-Aldrich,
cat. no. P9404-25MG)
Pasteur pipette (Fisher Scientific, cat. no. 13-678-4A)
Pasteur pipette rubber bulbs (Sigma-Aldrich, cat. no. Z111597-12EA)
Cell strainer, 40-µm (Fisher Scientific, cat. no. 22-363-547)
Steriflip 0.22-µm vacuum filter, 50 ml (Millipore, http://www.millipore.
com/, cat. no. SCGP00525)
Transfer pipette (VWR, cat. no. 16001-180)
Aluminum foil (VWR, cat. no. 89068-734)
Disposable capillary cell (ζ-potential) (Malvern, cat. no. DTS1061)
Square cuvette, 12 mm (DLS) (Malvern, cat. no. DTS0012)
Methanol (Sigma-Aldrich, cat. no. 34860-4X4L-R)
DMSO (Sigma-Aldrich, cat. no. 472301-100ML)
Cell engineering
Human mesenchymal stem cells at 70% confluence (http://medicine.
tamhsc.edu/irm/msc-distribution.html); examples of cells that have been
used so far are discussed in the ANTICIPATED RESULTS; we have not yet
encountered cells that could not be engineered with particles
! CAUTION Human cell lines may harbor pathogens. Use proper PPE,
adhere to all institutional ethics guidelines and handle cells in a BSL-2-certi-
fied biosafety cabinet.
T25 culture flask (VWR, cat. no. 29185-300)
MEM-α (Invitrogen, cat. no. 12561-072)
FBS (Atlanta Biologicals, cat. no. S11550)
•
•
•
•
•
•
•
•
•
•
•
•
•
•
•
•
•
•
•
•
•
•
Penicillin-streptomycin (Invitrogen, cat. no. 15140-163)
l-Glutamine (Invitrogen, cat. no. 25030-081)
PBS without calcium chloride and magnesium chloride (PBS−/−;
Sigma-Aldrich, cat. no. A00475)
Analysis
20-kDa-MWCO dialysis tubing (Fisher Scientific, cat. no. 08-607-068)
Paired standard and weighted dialysis closures (Spectrum Labs,
cat. no. 132749)
Fluorodish glass-bottom dish (World Precision Instruments,
cat. no. FD35-100)
Vybrant DiO cell-labeling solution (Invitrogen, cat. no. V-22886)
! CAUTION This solution contains the organic solvent and carcinogen
dimethylformamide. Wear proper PPE and handle it with caution.
Hoechst stain (Invitrogen, cat. no. H3570)
Neutral-buffered formalin, 10% (vol/vol) (Sigma-Aldrich, cat. no. HT501128)
! CAUTION Formalin contains formaldehyde, a carcinogen and eye,
respiratory and skin irritant. Wear proper PPE and handle it in a chemical
fume hood.
EQUIPMENT
Particle preparation
Scale, Mettler Toledo X5105 DualRange
Glass beaker, 50 ml
Magnetic stir bar, 0.5-inch
Stir plate, Corning PC-420D
Probe sonicator, Misonix Sonicator 3000 with microtip
Tissue homogenizer, Omni International Tissue Master 125 with 7-mm
probe
Clamp stand
Centrifuge, Eppendorf 5430 centrifuge
Mini-centrifuge
Lyophilizer
Particle characterization
Zetasizer, Malvern Instruments, ZEN 3690
Fluorescence microscope, Nikon Eclipse TE2000U
Benchtop flow cytometer, Accuri C6
Confocal microscope, Zeiss 700
REAGENT SETUP
PLL solution Dissolve 4 mg of PLL into 40 ml of filtered distilled water to make
a 0.01% (wt/vol) PLL solution. Store the solution at 4 °C for up to 3 months.
•
•
•
•
•
•
•
•
•
•
•
•
•
•
•
•
•
•
•
•
•
•
•
PROCEDURE
Preparation of microparticles ● TIMING 7 h
CRITICAL An overview of this stage of the procedure is shown in Figure 2.
1| Dissolve 200 mg of PVA in 20 ml of water to make a 1% (wt/vol) PVA solution. Add a stir bar and place it on a
magnetic stir plate for 1 h to allow for complete dissolution. Note: concentrations of PVA as low as 0.2% have also been
used. (PVA stabilizes the emulsion and prevents the particles from aggregating into larger particles.)
CRITICAL STEP PVA can aggregate and adhere to the bottom of the beaker. The position of the stir bar should be
periodically adjusted to free aggregates from the beaker surface and to ensure consistent generation of PVA solution.
? TROUBLESHOOTING
2| Add 50 mg of PLGA into a 10-ml glass scintillation vial.
3| Add 1 mg of rhodamine 6G dye (or a small molecule of choice) into the vial.
4| In a chemical fume hood, add 2 ml of DCM to the glass vial containing PLGA/rhodamine.
! CAUTION DCM is an eye and skin irritant and is harmful if swallowed. Use proper PPE and always work in a chemical
fume hood.
CRITICAL STEP DCM will dissolve most plastics; use a glass syringe or glass Pasteur pipette to avoid contamination of the
polymer solution.
- 4. ©2014NatureAmerica,Inc.Allrightsreserved.
protocol
236 | VOL.9 NO.2 | 2014 | nature protocols
CRITICAL STEP DCM is an organic solvent with a low
boiling point. Cap the vial to avoid evaporation and loss of
volume.
CRITICAL STEP The concentration of polymer in the
organic solvent is crucial for determining the final particle
size. Reducing the concentration of the polymer in the solvent will result in smaller-diameter particles, whereas increasing
the concentration will increase the particle diameter.
PAUSE POINT A 1- to 2-h break is acceptable at this point, with the vials capped and stored in a fume hood at room
temperature (20 °C).
5| When the 1% (wt/vol) PVA solution is completely dissolved, filter it through a 0.2-µm vacuum filter into a clean 50-ml
glass beaker.
CRITICAL STEP The solution will foam and undergo a twofold increase in volume once homogenization begins. Use a 50-ml
glass beaker to avoid overflow.
6| Place the beaker of PVA solution on ice and allow it to chill to 4–8 °C.
7| When the PLGA/rhodamine solution is completely dissolved, probe-sonicate it for 10 s at 10–12 W to ensure even
distribution of the small molecule among the polymer chains.
CRITICAL STEP Wash the probe sonicator with acetone and ethanol and dry it completely before use to avoid
contamination of particles.
? TROUBLESHOOTING
8| Secure the tissue homogenizer with a clamp stand over an ice bucket.
9| Place the beaker of PVA in an ice bucket and position the homogenizer probe so that the probe is submerged but not in
contact with the glass surface (e.g., 0.5 cm).
10| Turn the tissue homogenizer to 35,000 r.p.m. (highest speed on a Tissue Master 125).
! CAUTION Follow the manufacturer’s safety instructions in the product manual.
11| Use a glass Pasteur pipette to add PLGA solution to the PVA solution dropwise while homogenizing.
! CAUTION Use safety glasses as part of your PPE to avoid a splash hazard.
CRITICAL STEP The solution will foam and undergo a two-fold increase in volume during mixing. Use a 50-ml glass beaker
to avoid overflow.
CRITICAL STEP When you are adding PLGA solution to the PVA solution, avoid dripping PLGA onto the homogenizer probe
or wall of the beaker.
12| Homogenize the mixture for 2 min to create a single emulsion.
? TROUBLESHOOTING
13| Turn off the homogenizer and remove it from the beaker.
! CAUTION Disconnect the homogenizer from the energy source before removing it.
14| Move the particle suspension to a stir plate in a chemical fume hood and add a 0.5-inch magnetic stir bar.
15| Set the stir plate to 300 r.p.m.
16| Cover the particle suspension with aluminum foil perforated with 10–20 holes to allow for evaporation of the organic
solvent in a chemical fume hood.
PLGA Drug
DCM
ddH2O PVA
Stir StirEmulsify on ice
a b
Intensity(%)
Size (nm)
25
20
15
10
5
0
10 100 1,000
Figure 2 | Generation of drug-loaded microparticles. (a) Schematic of single-
emulsion evaporation technique. Particles are generated by dissolving PLGA
and drug into DCM. Drug solution is then added dropwise to a stabilizing
solution of PVA while homogenizing to create an emulsion. Particles
are then allowed to solidify in suspension while the solvent evaporates.
(b) Representative distribution of particle diameters generated by using this
method with 0.15–0.25 g dl−1 i.v. (green line) or 0.55–0.75 g dl−1 i.v. (red line)
PLGA. Inset is a representative SEM image of particles. Scale bar, 1 µm.
- 5. ©2014NatureAmerica,Inc.Allrightsreserved.
protocol
nature protocols | VOL.9 NO.2 | 2014 | 237
17| Allow 4–5 h for complete evaporation of the organic solvent.
CRITICAL STEP Incomplete evaporation of the solvent will result in particle aggregation and loss of microparticles in
subsequent steps. To test, take 200 µl of the sample and centrifuge it at 1,000g for 5 min at room temperature.
Particles should easily resuspend into a single-particle suspension in distilled water by triturating with a 1-ml pipette.
CRITICAL STEP Excessive evaporation time will lead to breakdown of particles owing to hydrolysis and gradual loss of dye
or drug loading.
18| Transfer the particle suspension to 15-ml centrifuge tubes and centrifuge them at 1,000g for 5 min at room temperature.
CRITICAL STEP Excessive centrifugal forces can cause an aggregation of particles that can be difficult to disperse.
19| Remove the supernatant and gently resuspend it in 10 ml of distilled water by using a transfer pipette.
20| Repeat the wash process twice.
21| After the third wash, resuspend the particles in 1 ml of distilled water.
22| Filter the suspension through a 40-µm cell strainer to remove large particulates and aggregates.
? TROUBLESHOOTING
23| Use 1 ml of fresh distilled water to wash the cell strainer and collect additional particles.
24| Transfer the particle suspension to 2-ml centrifuge tubes.
25| Remove 20 µl of particle suspension for characterization.
26| Freeze the particle suspension at −80 °C and lyophilize it for 24 h.
PAUSE POINT The particles can be frozen overnight.
Preservation of microparticles ● TIMING 24 h
27| Store the lyophilized particles in 2-ml centrifuge tubes at −80 °C. Seal the lids with Parafilm to prevent moisture
contamination that can degrade particles.
PAUSE POINT Particles can be frozen for at least 6 months.
Characterization of microparticles ● TIMING 1.5 h
28| Add 10 µl of particle suspension to 1 ml of distilled water in a cuvette.
29| Mix well and insert the mixture into the Zetasizer to measure the hydrodynamic diameter and polydispersity index of the
PLGA microparticles through DLS.
? TROUBLESHOOTING
30| Transfer 20 µl of diluted particle suspension to a clean glass slide.
31| Use a fluorescence microscope at ×40 magnification to visualize particles and to confirm particle size and polydispersity.
Scanning electron microscopy (SEM) can also be performed to confirm the size distribution and assess the surface morphology.
CRITICAL STEP The presence of large particles or debris can cause errors in DLS measurements.
? TROUBLESHOOTING
32| Dilute 2 µl of concentrated particle suspension in 1 ml of distilled water.
33| Add the diluted particle suspension into a disposable capillary cell and measure ζ-potential with a Zetasizer.
PLGA-COOH should generate particles with a ζ-potential of approximately −40 mV.
CRITICAL STEP Excessive particle concentration and high ion concentrations (e.g., cell medium) can cause the electrodes
on the capillary cell to burn, resulting in inaccurate measurements.
? TROUBLESHOOTING
- 6. ©2014NatureAmerica,Inc.Allrightsreserved.
protocol
238 | VOL.9 NO.2 | 2014 | nature protocols
34| Quantify drug loading and determine the encapsulation efficiency as described in Box 1. Quantify the release kinetics as
described in Box 2.
Microparticle surface charge modification ● TIMING 3 h
CRITICAL Sample data for this stage of the procedure are shown in Figure 3.
35| Measure 5 mg of lyophilized particles into a 1.5-ml centrifuge tube.
36| Perform a quick spin-down in a mini-centrifuge (2,000g for 1–2 s) to minimize the loss of particles that may stick to the
surface of the tube.
37| Add 1 ml of 0.01% (wt/vol) PLL solution and gently resuspend the particles.
38| Shake the suspension at 37 °C for 2 h to allow for adsorption of PLL onto the surface of particles.
39| Add 10 µl of PLL-modified particle suspension to 1 ml of distilled water.
Box 1 | Quantification of drug loading and encapsulation efficiency
The concentration of drug and duration of MSC exposure to small molecules is crucial to controlling the phenotype. For example,
protocols to induce differentiation of MSCs in vitro typically rely on multiple days of continuous activation of signal transduction
pathways by select agents included within the medium. With the particle engineering approach, the drug loading and release kinetics
can be altered by modifying the particle synthesis protocol by changing the specific composition and molecular weight of the polymer,
by altering the concentration of the drug or by using co-solvents to aid in dissolution of the small molecule in the polymer solution.
Quantification of drug loading, encapsulation efficiency and release kinetics should be iterated until a formulation with desirable
characteristics is generated. Drug loading is the mass fraction of a particle that is composed of drug and calculated by Equation 1.
Encapsulation efficiency describes the fraction of drug incorporated into particles compared with the total amount of drug that was
added during particle synthesis, and it is calculated by Equation 2.
Quantification of drug loading and encapsulation efficiency
1. Weigh 2 mg of particles into each of three 1.5-ml centrifuge tubes.
2. Collect dry particles into the bottom of the tube by performing a quick spin-down (2,000g, 1–2 s) in a mini-centrifuge.
3. Two methods can be used to solubilize the drug contained in the particles: dissolving the particle (polymer and drug) in a solvent
such as DMSO or swelling the particle to allow release of the drug into solution. The swelling method maintains the PLGA as a solid,
and typically the majority of drug can be separated from the drug in a methanol solution; however, this method should only be used if
the encapsulated drug has high solubility in methanol.
(A) Dissolving the particles
(i) Add 0.5 ml of DMSO to particles and allow the particles to completely dissolve. The DMSO solution can then be analyzed directly
by spectrophotometry.
(B) Releasing the drug by the swelling method
(i) Add 0.5 ml of methanol to swell the particles and release small molecules into solution. Particles will clump together and the
release will be rapid. To ensure complete release, incubate the mixture on a shaker at 37 °C for 1 h.
(ii) Centrifuge the solutions at 2,000g for 5 min at room temperature to pellet debris, and collect the supernatant into labeled
tubes.
4. Analyze the sample by HPLC according to the absorbance spectrum of the small molecule. Prepare standard solutions of the small
molecule in methanol (alternative solvents may be required depending on the solubility of the small molecule) for calibration. Include
a control generated from blank particles (i.e., without the small molecule).
5. Determine drug loading and encapsulation efficiency by using Equations 1 and 2, respectively, where CR is the drug concentration of
the release medium, VR is the volume of release medium, mmp is the mass of microparticles and mD and mPLGA are, respectively,
the mass of drug and mass of PLGA initially added during particle synthesis.
Drug Loading R R
mp
: %DL
C V
m
= × 100
Encapsulation Efficiency
R R mp
D D PLGA
: %
/
/
EE
C V m
m m m
=
+
× 100
(1)(1)
(2)(2)
- 7. ©2014NatureAmerica,Inc.Allrightsreserved.
protocol
nature protocols | VOL.9 NO.2 | 2014 | 239
40| Measure the ζ-potential as in Step 33.
? TROUBLESHOOTING
PAUSE POINT PLL-modified particles can be frozen at −20 °C for 6 months.
Engineering cells with microparticles ● TIMING 14–18 h
41| Grow MSCs to 70–80% confluence in a T25 flask.
CRITICAL STEP Incubating cells with particles at lower confluence will result in excessive amount of free particles in
solution and particles adhered to the flask surface.
42| Prepare particle-laden medium by diluting 0.3 mg of PLL-modified particles in 1 ml of MEM-α with 1% (vol/vol) FBS,
1% (vol/vol) penicillin-streptomycin and 1% (vol/vol) l-glutamine.
43| Probe-sonicate at 1–3 W, pulsed for 10 s, to ensure that
particles are uniformly dispersed in solution.
44| Add the suspended particles to 2 ml of 1% (vol/vol)
FBS-supplemented MEM-α medium to create 3 ml
of 0.1 mg ml−1 particle suspension.
Box 2 | Quantification of drug release
Release of small molecules from microparticles in vitro can be determined by using dialysis as previously described33,34. Although
release kinetics of drug from particles internalized within cells is influenced by the intracellular environment (e.g., the presence of
enzymes or altered pH), the simplified dialysis system is an important tool that can provide insight into the release kinetics and it
should highlight relevant trends and pitfalls including excessive burst release and incomplete release. The procedure below assumes
that the maximum drug concentration in the release medium will remain an order of magnitude below the drug’s solubility limit;
elevated drug concentrations will reduce the rate of dissolution of the drug from the particle35.
Procedure
1. Prepare a 10 mg ml−1 particle suspension in PBS.
2. Pipette 200 µl of solution into a 2-inch section of 20-kDa-MWCO dialysis tubing clamped with a weighted closure.
3. Carefully close the second end of the dialysis tubing with an unweighted closure.
4. Load two additional tubings for replicates (for n = 3).
5. Place the loaded tubings within 50-ml centrifuge tubes. Add 40 ml of PBS−/− to each tube and cap securely.
6. Place the tubes in a rack on an orbital shaker at 37 °C. At each time point, collect 1 ml from the outer fluid phase and store it in a
labeled centrifuge tube. Replace it with an equal volume of fresh PBS−/−.
7. The samples can be frozen at −80 °C until analysis.
8. The samples may need to be diluted with methanol or another solvent before analysis to reach a detectable drug concentration
within the linear range of the calibration curve.
9. Determine cumulative release by using Equation 3 where CRt is the cumulative drug release at sample time ‘t’, Ct is the drug
concentration of the sample at time ‘t’, VR is the volume of release medium, Ci is the drug concentration at sample time ‘i’ and Vr is the
volume removed at each sample time.
Cumulative release at time t t R t r’ ’:t CR C V C V
i
t
= +
=
−
∑
0
1
10. Release medium should also be applied to cells to assess the bioactivity of the released agent to ensure that the agent was not
damaged during encapsulation.
11. The intracellular concentration of the drug at specific time points can also be determined by washing MSCs that contain internalized
particles with PBS, followed by a PBS solution containing 0.1% (vol/vol) Triton X-100 to lyse the cell membranes11. The drug within
the solution can then be analyzed to determine the intracellular drug concentration by using HPLC as described above.
(3)(3)
Counts
ζ-potential (mV)
AfterFITC-PLL
c d
BeforeFITC-PLL
Rhodamine FITCa
1,200,000
1,000,000
800,000
600,000
400,000
200,000
0
–200 –100 0
b
Counts
ζ-potential (mV)
500,000
400,000
300,000
200,000
100,000
0
–200 –100 0
Figure 3 | Surface modification of particles with PLL to enhance particle
uptake. (a,b) Rhodamine-PLGA particles were imaged before (a) and after (b)
surface modification with positively charged FITC-PLL. Scale bars, 5 µm.
(c,d) The FITC-PLL coating results in a shift in ζ-potential from −48 mV
before coating (c) to +10 mV after coating (d).
- 8. ©2014NatureAmerica,Inc.Allrightsreserved.
protocol
240 | VOL.9 NO.2 | 2014 | nature protocols
45| Wash MSCs with PBS−/− three times.
46| Add particle-laden medium to MSCs and incubate overnight (e.g., 12 h).
CRITICAL STEP Shorter incubation times will result in particle association with the cell membrane; however,
internalization of particles may not be complete.
47| Aspirate the spent medium and wash the flask three times with PBS−/− at room temperature to remove free particles.
? TROUBLESHOOTING
48| Add 10% (vol/vol) FBS medium or split and proceed with downstream analysis or experiments.
Characterization of the internalization of microparticles
49| After engineering MSCs with microparticles, it is crucial to analyze the cells to ensure efficient internalization.
Poor uptake of particles will result in nonuniform exposure of cells to the encapsulated agent and reduce the concentration
and duration in which the particles are able to control the cell phenotype. Described here are techniques to assess the
uniformity of microparticle uptake within the cell population, the presence of free microparticles and subcellular location
of microparticles.
Although flow cytometry and fluorescence microscopy (option A) are useful in determining ideal microparticle formulations
and incubation conditions that maximize association of microparticles with cells, these techniques cannot easily distinguish
between membrane-bound and intracellular microparticles, and thus additional techniques such as confocal microscopy are
required to assess this. To examine internalization of microparticles within cells, MSCs can easily be analyzed by confocal
microscopy (option B). The technique described in option B has been developed to fix cells in a spherical morphology,
rather than monolayer cultures, to facilitate assessment of particle internalization. Other complementary techniques
can be applied to confirm particle internalization including transmission electron microscopy (TEM). If performing TEM,
particles should be formulated with iron oxide or gold nanoparticles to aid in the identification of PLGA particles within cells,
as described by Xu et al.19 (Fig. 4).
(A) Quantifying the uniformity and degree of microparticle association with cells
(i) After Step 48, MSCs can be analyzed by flow cytometry to determine the degree and uniformity of cell uptake of
dye-loaded microparticles. Collect cells by washing them three times with 2 ml of PBS−/− and incubating them
for 3–4 min with trypsin or Accutase cell detachment solution.
(ii) Centrifuge the detached cells in a 15-ml conical tube at 300g for 5 min at room temperature to pellet the cells.
(iii) Resuspend the pellet in 1 ml of fresh culture medium and analyze it with a flow cytometer. Unmodified (native) MSCs
and free microparticles serve as useful controls to determine cell gating and to set the threshold for background
fluorescence. Fluorescence intensity of microparticle-engineered MSCs will rise with increased microparticle
loading. Side scatter has also been observed to increase as a result of the increased granularity of the microparticle-
loaded cells.
(iv) After analysis via flow cytometry, samples can be plated on glass slides and visualized with a fluorescence microscope
to assess the relative number of free microparticles versus cell-associated microparticles (Fig. 4a).
? TROUBLESHOOTING
Hoechst DiO DiI-particles Merge
Hoechst DiO DiI-particles Mergeb
c
a d
Figure 4 | Confirming cellular internalization of microparticles. (a) An
inverted fluorescence microscope can be used to examine the association of
cells and particles and the presence of free particles (arrows), but it cannot
be used to conclusively determine whether particles have been internalized.
The cell perimeter is outlined in the red fluorescence channel to distinguish
particles that could possibly be internalized from those that are on the
periphery. (b,c) Representative confocal microscopy images of MSCs
with particle internalization at low (b) and high (c) efficiencies. Images
represent a slice through the cell at the plane of the nuclei showing the
presence of mostly outer membrane–associated particles (b) and numerous
intracellular particles (c). Scale bars, 10 µm. (d) MSCs modified with (black
arrows) iron oxide nanoparticle-loaded PLGA particles examined with TEM
imaging. By comparing the location of the particles with (red arrow) the
cell membrane, TEM can be used to confirm internalization of particles.
Particle diameters observed in TEM are a function of the plane in which the
image slice is taken, and they may be smaller than expected owing to PLGA
dissolution during TEM sample processing. Scale bar, 500 nm.
- 9. ©2014NatureAmerica,Inc.Allrightsreserved.
protocol
nature protocols | VOL.9 NO.2 | 2014 | 241
(B) Confirming microparticle internalization
(i) Engineer MSCs with dye-loaded microparticles as described in Steps 41–48.
(ii) Coat a glass-bottom dish or chamber slide with 100 µl of 20 µg ml−1 fibronectin for 1 h to aid in rapid cell
attachment.
(iii) Meanwhile, collect MSCs and resuspend them in medium supplemented with 5 µl ml−1 Vybrant DiO membrane dye and
1 µg ml−1 Hoechst nuclear dye.
(iv) Incubate the mixture on ice for 15 min. Aspirate fibronectin from the dish or slide, and add 100 µl of cell suspension
as a droplet on the fibronectin-coated spot.
(v) Carefully transport the dish or slide to a 37 °C incubator and incubate it for 5 min.
(vi) Use a microscope to examine cell attachment: the majority of cells should be attached but not spread on the culture
surface.
CRITICAL STEP Extended incubation after plating will lead to cell spreading, making it difficult to determine
whether microparticles are intracellular or membrane associated.
(vii) Aspirate the liquid and replace it with 1 ml of 10% neutral-buffered formalin.
(viii) Fix cells for 5 min, wash them four times with PBS−/− and analyze by confocal microscopy (Fig. 4b,c).
? TROUBLESHOOTING
? TROUBLESHOOTING
Troubleshooting advice can be found in Table 1.
Table 1 | Troubleshooting table.
Step Problem Possible reason Solution
1 PVA is not dissolving PVA is stuck to beaker Use ultrasonic water bath to detach PVA clumps from beaker
7 PLGA is not dissolving Large polymer pellets or
high-molecular-weight PLGA
take more time to dissolve
Use ultrasonic water bath to facilitate dissolution of polymer
pellets
12 Solutions not mixing,
two layers visible
Surface area of the beaker is
too large
Use a beaker with a smaller diameter to reduce surface area
Homogenizer is not adequately
submerged
Lower the homogenizer so that the tip is submerged in
PVA solution
Emulsion overflows PVA solutions have a tendency
to foam
Reduce the PVA concentration to 0.25–0.5% (wt/vol)
Beaker is too short Use a taller beaker
22 Particle clumping Solvent evaporation was
not complete
Leave suspension on stir plate for an additional 2 h with
adequate ventilation
Centrifugal forces are too high Reduce centrifuge speed and increase time to pellet particles
Particles have a neutral charge
due to excessive PVA coating
Wash with a larger volume of distilled water before initial spin or
reduce the PVA concentration to 0.25–0.5% (wt/vol)
29 Repeat readings yield
different results
Presence of large particles or
settling debris
Filter the suspension with a cell strainer before measurement or
allow large particles to settle out for 2 min, and then carefully
collect the particles in suspension into a new tube
31 Presence of large particles PLGA concentration or agitation
speed were not adequate
Filter the particle suspension with a 5-µm Supor Membrane
using a 20-ml syringe
33 ζ-potential is near zero Ion concentration is too high
causing electrodes to burn
Dilute particle suspension and use a new capillary cell
Excessive PVA residue on particle
surface
Reduce the PVA concentration to 0.25–0.5% (wt/vol) or add an
additional wash step before measurement
(continued)
- 10. ©2014NatureAmerica,Inc.Allrightsreserved.
protocol
242 | VOL.9 NO.2 | 2014 | nature protocols
● TIMING
Steps 1–26, day 1, preparation of microparticles: 7 h
Step 27, day 2, preservation of microparticles: 24 h
Steps 28–40, day 3, characterization of microparticles: ~4.5 h
Steps 41–48, day 4, engineering cells with microparticles: 14–18 h
Step 49, day 5, characterization of the internalization of microparticles: variable
Box 1, quantification of drug loading and encapsulation efficiency: 4–8 h
Box 2, quantification of drug release: 7 d
ANTICIPATED RESULTS
This protocol establishes a robust technique for controlled delivery of small molecules or other cargo intracellularly to an
exogenous population of cells through the generation of drug-loaded microparticles (Figs. 1 and 2), followed by surface
modification of microparticles (Figs. 1 and 3) and functionalization of cells with microparticles (Figs. 1 and 4).
To demonstrate the flexibility of this platform to modify multiple cell types, rhodamine dye–loaded microparticles were
generated and used to modify MSCs, MIN6 beta cells and macrophages. After lyophilization (Step 27), the ζ-potential of
particles was modified by using FITC-labeled PLL (FITC-PLL) in accordance with Steps 35–40. Figure 3 shows representative
Table 1 | Troubleshooting table. (continued)
Step Problem Possible reason Solution
40 No change in ζ-potential
after PLL modification
Inadequate adsorption of
PLL onto the particle surface
Prepare a fresh batch of PLL and make sure that particles remain
in suspension during modification
47 Excessive number of free
particles remain after
washing
Concentration of particle-laden
medium was too high
Reduce the concentration of the particle-laden medium
Particles added when cells
were at low confluence
Replate the cells, allow them to attach for 20 min, and then wash
with PBS to remove free particles
Separate cells from free particles by Ficoll density gradient
separation
Wash cells with trypsin for 1 min to remove particles,
then replace with normal full-serum medium
49 Poor or inconsistent
particle loading in cells
Particles are too large Reduce polymer concentration or increase agitation speed to gene
rate smaller particles, and carefully verify the size distribution
Reduce the size of the beaker used during emulsification so
solution is more evenly and vigorously mixed
Particles are clumping Probe-sonicate to break up clumps and confirm with microscopy
before adding to cells
Excipients such as PEG, sorbitol, or mannose can be added before
lyophilization at nontoxic concentrations
Reduce particle concentration
Particle suspension is not evenly
distributed over cells; flask is tilted
Gently tilt flask front-to-back and side-to-side in incubator to
evenly coat cells; do not swirl
Low particle fluorescence due
to low dye loading
Check and increase dye loading
Poor cell health Check viability and morphology of MSCs before particle incubation
and use fresh medium
Check toxicity of drug and reduce drug loading accordingly
Reduce particle concentration
Reduce duration of particle incubation in 1% (vol/vol) FBS
Check for microbial contamination
- 11. ©2014NatureAmerica,Inc.Allrightsreserved.
protocol
nature protocols | VOL.9 NO.2 | 2014 | 243
fluorescence images and ζ-potential measurements of dye-loaded particles before and after modification with FITC-PLL.
To prepare cells for particle modification, human MSCs, MIN6 beta cells and RAW 264.7 macrophages were plated in T25
flasks and allowed to grow to 70% confluence (Step 41). PLL-modified particles were then diluted in cell culture medium at a
concentration of 0.3 mg ml−1 (Step 42).
To determine whether particles were in a single particle suspension, we placed 5 µl of particle-laden medium on a glass
slide and analyzed it by fluorescence microscopy, which revealed the presence of large particle aggregates that cells would
have difficulty internalizing (Fig. 5a).
Probe sonication (Step 43) was effective at dispersing particles back into a single particle suspension (Fig. 5b).
The concentration of the particle suspension was then adjusted to 0.1 mg ml−1 by the addition of low-serum medium, and
particle-laden medium was added to each flask (Steps 44–46). All cell types were incubated with the particle-laden medium
overnight, washed, trypsinized and analyzed by flow cytometry and confocal microscopy according to Steps 47–49. For all
cell types, cells without particles were used as controls, and debris and free particles were gated out with BD Accuri’s CFlow
analysis software (Fig. 6 shows representative gating for MSCs).
Flow cytometry, which measures the percentage of cells associated with particles but not necessarily particle internali-
zation, revealed that MSCs, MIN6 beta cells and RAW 264.7 macrophages were all strongly associated with particles but
to different extents, with 94% of MSCs and macrophages and 46% of MIN6 beta cells associated with particles (deter-
mined by an increase in the fluorescence intensity of the cells compared with unmodified controls) (Fig. 7). It should
be noted that MIN6 beta cells tend to grow in clusters with some cells in the core and others on the periphery. These
clusters were not disassociated before incubation with particle-laden medium. Therefore, it is possible that all MIN6
beta cells were not equally exposed to microparticles, resulting in increased variability in the extent of particle
association. It is anticipated that the efficiency of MIN6 modification could be improved by dispersing MIN6 cells
into a single-cell suspension and then plating the cells at a high density immediately before the introduction of the
particle-laden medium.
To assess particle internalization by confocal microscopy, particle-modified MSCs, MIN6 beta cells and RAW 264.7
macrophages were plated on fibronectin-coated glass dishes and allowed to attach before formalin fixation (Step 49B).
Cells were incubated until a monolayer of cells was observed by light microscopy to be attached to the dish. MSC attachment
to the dish was observed 5 min after plating, whereas RAW 264.7 macrophages and MIN6 beta cells took 10 and 40 min
to attach, respectively. The outer membrane of cells was stained with DiO and the nuclei were stained with Hoechst in
accordance with Step 49B.
Confocal microscopy of the cells not only confirmed observations from flow cytometry, revealing that nearly all of the MSCs
and macrophages and half of the MIN6 beta cells were associated with particles, and also that particles were internalized by
all cell types (Fig. 7).
a b
Sonication
Figure 5 | Troubleshooting particle aggregation to improve MSC uptake
of particles. Particle aggregation can be caused by numerous factors,
including high particle concentration during preservation, presence of
excessive residual PVA or weak ζ-potential. Aggregation effectively reduces
the concentration of particles in the medium that MSCs are capable
of internalizing (leading to reduced internalization). (a,b) Shown are
representative images of a 0.1 mg ml−1 particle suspension in medium
before (a) and after (b) sonication. If particle aggregation is suspected,
use a fluorescence microscope to confirm (if fluorescent dye was loaded in
particles), and disassociate particle aggregates with a sonication probe or
water-bath sonication. Scale bars, 10 µm.
Figure 6 | Gating fluorescent particle–
engineered MSCs in flow cytometry. (a,b) Forward
scatter but not side scatter is preserved between
unmodified (native) (a) and particle-engineered
MSCs (b). Increased particle internalization
increases side scatter. To adequately measure the
fluorescence of particle-engineered cells and not
free particles or debris, gate (red box labeled
P1) with a range of side scatter larger than the
typical range for cells. Free particles and cell
debris will cluster at the bottom left corner of
the forward/side scatter plot (dashed red circle). Apoptotic cells may be excluded using appropriately labeled annexin V. (c) Fluorescent particle–engineered
cells (red line) should show markedly higher fluorescence than unmodified (native) cells (black line).
a
Forward scatter
0
5,000,00010,000,00015,000,000
Sidescatter
Gate: (No gating)
16,777,215
10,000,000
5,000,000
0
P1
b
0
5,000,00010,000,00015,000,000
Forward scatter
Sidescatter
Gate: (No gating)
16,777,215
10,000,000
5,000,000
0
P1
c
Fluorescence
Count
Gate: (P1 in all)
400
300
200
100
10
1
10
2
10
3
10
4
10
5
10
6
10
7.2
0
- 12. ©2014NatureAmerica,Inc.Allrightsreserved.
protocol
244 | VOL.9 NO.2 | 2014 | nature protocols
The particle-engineered cell platform is highly tunable, and we anticipate that it can be adapted to a variety of applica-
tions such as promoting and accelerating engraftment of HSCs, enhancing glucose sensitivity of transplanted beta cells and
maximizing the immunomodulatory function of MSCs (Fig. 8). Figure 8 also shows that molecules can be transported to the
extracellular environment passively via diffusion or actively through exosomes or drug efflux pumps. This can be used to
influence the cell’s microenvironment, as we have previously demonstrated with dexamethasone11.
ea
fdb
MSC
1,600
1,000
500
0
V2-L
2.9%
GATE (P1 in all)
V2-R
97.1%
10
1
10
2
10
3
10
4
FL2-A
10
5
10
6
10
7.2
c MIN6 beta cells
GATE (P1 in all)
V1-R
46.7%
1,600
1,000
500
0
V1-L
53.3%
10
1
10
2
10
3
10
4
FL2-A
10
5
10
6
10
7.2
RAW 264.7 macrophage
GATE (P1 in all)
V3-R
94.8%
1,600
1,000
500
0
V3-L
5.2%
10
1
10
2
10
3
10
4
FL2-A
10
5
10
6
10
7.2
Figure 7 | Potential for universal applicability of the particle-engineered cell platform. (a–f) The particle engineering protocol was applied to human bone
marrow MSCs (a,b), MIN6 beta cells (c,d) and RAW 264.7 macrophages (e,f). One day after particle engineering, cells were collected and analyzed by flow
cytometry. All cells showed increased red fluorescence (FL2-A channel) (black lines) compared with unmodified controls (red lines). The percentage of cells
with particles is stated in the upper right corner of each graph. To confirm particle internalization, confocal imaging was performed as described above.
Images represent a slice through an MSC (b), a MIN6 beta cell (d) and a RAW 264.7 macrophage (f) at the plane of the nuclei showing internalization of
particles. Scale bars, 10 µm. Green (DiO stain), membrane; red (rhodamine 6g), particles; blue (Hoechst), nuclei.
Count
Secretion
Naive MSC
Engineered MSC
ProliferationTracking
Viability DifferentiationSecretome
Particle toolbox
In vivo controlIn vitro engineering
Drug delivery
Enhanced secretome
a b
i
iii
ii
Drug delivery
Figure 8 | Tailoring cells with intracellular depots for multiple applications.
(a) A diverse toolbox of particles can be generated and used to engineer
cells to track their location, to locally deliver drugs or to control cell
phenotype including proliferation, viability, differentiation and secretome
by targeting (i) intracellular targets, (ii) membrane-bound targets (in an
autocrine-like manner) and iii) extracellular receptors (in a paracrine-like
manner). (b) Engineered cells can be transplanted locally or systemically.
For example, drugs released from intracellular particles can be used to
control the phenotype of the particle-modified cell by enhancing the MSC
secretome (b, top) Alternatively, the platform can be used to locally deliver
drugs to tissues where cells reside (where the cell is used as a delivery
vehicle) (b, bottom).
Acknowledgments This work was supported by US National Institutes of
Health grant no. HL095722 to J.M.K. and by a Movember–Prostate Cancer
Foundation Challenge Award to J.M.K. J.A.A. was supported by the Hugh
Hampton Young Memorial Fellowship.
AUTHOR CONTRIBUTIONS J.A.A., C.X., D.S., and J.M.K. conceived of the
protocol and its initial applications. J.A.A., O.R.M. and K.S.N. optimized
the protocol. J.A.A., O.R.M., K.S.N. and J.M.K. wrote the manuscript.
J.A.A. designed and prepared all figures.
COMPETING FINANCIAL INTERESTS The authors declare competing financial
interests: details are available in the online version of the paper.
Reprints and permissions information is available online at http://www.nature.
com/reprints/index.html.
- 13. ©2014NatureAmerica,Inc.Allrightsreserved.
protocol
nature protocols | VOL.9 NO.2 | 2014 | 245
1. von Bahr, L. et al. Long-term complications, immunologic effects, and role
of passage for outcome in mesenchymal stromal cell therapy. Biol. Blood
Marrow Transplant 18, 557–564 (2012).
2. François, M., Romieu-Mourez, R., Li, M. Galipeau, J. Human MSC
suppression correlates with cytokine induction of indoleamine 2,3-
dioxygenase and bystander M2 macrophage differentiation. Mol. Ther. 20,
187–195 (2012).
3. Cahan, P. Daley, G.Q. Origins and implications of pluripotent stem cell
variability and heterogeneity. Nat. Rev. Mol. Cell Biol. 14, 357–368 (2013).
4. Fomina-Yadlin, D. et al. Small-molecule inducers of insulin expression in
pancreatic alpha-cells. Proc. Natl. Acad. Sci. USA 107, 15099–15104 (2010).
5. Da Silva Meirelles, L. Chagastelles, P. Mesenchymal stem cells reside in
virtually all post-natal organs and tissues. J. Cell Sci. 119 (Part 11):
2204–2213 (2006).
6. Zhukareva, V., Obrocka, M., Houle, J.D., Fischer, I. Neuhuber, B.
Secretion profile of human bone marrow stromal cells: donor variability
and response to inflammatory stimuli. Cytokine 50, 317–321 (2010).
7. Wu, W., Ye, Z., Zhou, Y. Tan, W.-S. AICAR, a small chemical molecule,
primes osteogenic differentiation of adult mesenchymal stem cells. Int. J.
Artif. Organs 34, 1128–1136 (2011).
8. Suzuki, Y., Kim, H.W., Ashraf, M. Haider, H.K. Diazoxide potentiates
mesenchymal stem cell survival via NF-κB–dependent miR-146a expression
by targeting Fas. Am. J. Physiol. Heart Circ. Physiol. 299, H1077–82 (2010).
9. Dong, Q., Yang, Y., Song, L., Qian, H. Xu, Z. Atorvastatin prevents
mesenchymal stem cells from hypoxia and serum-free injury through
activating AMP-activated protein kinase. Int. J. Cardiol. 153, 311–316
(2011).
10. Brey, D.M. et al. High-throughput screening of a small molecule library for
promoters and inhibitors of mesenchymal stem cell osteogenic
differentiation. Biotechnol. Bioeng. 108, 163–174 (2011).
11. Sarkar, D., Ankrum, J., Teo, G.S.L., Carman, C.V. Karp, J.M. Cellular and
extracellular programming of cell fate through engineered intracrine-,
paracrine-, and endocrine-like mechanisms. Biomaterials 32, 3053–3061
(2011).
12. Slowing, I.I. et al. Exocytosis of mesoporous silica nanoparticles from
mammalian cells: from asymmetric cell-to-cell transfer to protein
harvesting. Small 7, 1526–1532 (2011).
13. Jiang, X. et al. Endo- and exocytosis of zwitterionic quantum dot
nanoparticles by live HeLa cells. ACS Nano 4, 6787–6797 (2010).
14. Panyam, J. Labhasetwar, V. Dynamics of endocytosis and exocytosis of
poly(d,l-lactide-co-glycolide) nanoparticles in vascular smooth muscle
cells. Pharm. Res. 20, 212–220 (2003).
15. Jin, H., Heller, D.A., Sharma, R. Strano, M.S. Size-dependent cellular
uptake and expulsion of single-walled carbon nanotubes: single particle
tracking and a generic uptake model for nanoparticles. ACS Nano 3,
149–158 (2009).
16. Chithrani, B.D. Chan, W.C.W. Elucidating the mechanism of cellular
uptake and removal of protein-coated gold nanoparticles of different sizes
and shapes. Nano Lett. 7, 1542–1550 (2007).
17. Swiston, A., Gilbert, J., Irvine, D., Cohen, R. Rubner, M. Freely
suspended cellular ‘backpacks’ lead to cell aggregate self-assembly.
Biomacromolecules 4920–4925 (2010).
18. Stephan, M.T., Moon, J.J., Um, S.H., Bershteyn, A. Irvine, D.J.
Therapeutic cell engineering with surface-conjugated synthetic
nanoparticles. Nat. Med. 16, 1035–1041 (2010).
19. Xu, C. et al. Tracking mesenchymal stem cells with iron oxide nanoparticle
loaded poly(lactide-co-glycolide) microparticles. Nano Lett. 12, 4131–4139
(2012).
20. Cohen-Sela, E., Chorny, M., Koroukhov, N., Danenberg, H.D. Golomb, G.
A new double emulsion solvent diffusion technique for encapsulating
hydrophilic molecules in PLGA nanoparticles. J. Control Release 133,
90–95 (2009).
21. Karnik, R. et al. Microfluidic platform for controlled synthesis of polymeric
nanoparticles. Nano Lett. 8, 2906–2912 (2008).
22. Thomas, T.T., Kohane, D.S., Wang, A. Langer, R. Microparticulate
formulations for the controlled release of interleukin-2. J. Pharm. Sci. 93,
1100–1109 (2004).
23. Sawada, M., Hayes, P. Matsuyama, S. Cytoprotective membrane-
permeable peptides designed from the Bax-binding domain of Ku70.
Nat. Cell. Biol. 5, 352–357 (2003).
24. Ieda, M. et al. Direct reprogramming of fibroblasts into functional
cardiomyocytes by defined factors. Cell 142, 375–386 (2010).
25. Murry, C.E. Keller, G. Differentiation of embryonic stem cells to clinically
relevant populations: lessons from embryonic development. Cell 132,
661–680 (2008).
26. Brenner, S. et al. CXCR4-transgene expression significantly improves
marrow engraftment of cultured hematopoietic stem cells. Stem Cell 22,
1128–1133 (2004).
27. Haider, H.K., Jiang, S., Idris, N.M. Ashraf, M. IGF-1-overexpressing
mesenchymal stem cells accelerate bone marrow stem cell mobilization via
paracrine activation of SDF-1α/CXCR4 signaling to promote myocardial
repair. Circ. Res. 103, 1300–1308 (2008).
28. Panyam, J. Labhasetwar, V. Biodegradable nanoparticles for drug and
gene delivery to cells and tissue. Adv. Drug Deliv. Rev. 55, 329–347 (2003).
29. Panyam, J., Zhou, W.-Z., Prabha, S., Sahoo, S.K. Labhasetwar, V. Rapid
endo-lysosomal escape of poly(dl-lactide-co-glycolide) nanoparticles:
implications for drug and gene delivery. FASEB J. 16, 1217–1226 (2002).
30. Patil, Y., Sadhukha, T., Ma, L. Panyam, J. Nanoparticle-mediated
simultaneous and targeted delivery of paclitaxel and tariquidar overcomes
tumor drug resistance. J. Control Release 136, 21–29 (2009).
31. Acharya, S. Sahoo, S.K. PLGA nanoparticles containing various
anticancer agents and tumour delivery by EPR effect. Adv. Drug Deliv. Rev.
63, 170–183 (2011).
32. Timko, B.P. et al. Advances in drug delivery. Annu. Rev. Mater. Res. 41,
1–20 (2011).
33. Kostanski, J.W. DeLuca, P.P. A novel in vitro release technique for
peptide containing biodegradable microspheres. AAPS Pharm. Sci. Tech. 1,
E4 (2000).
34. D’Souza, S.S. DeLuca, P.P. Methods to assess in vitro drug release
from injectable polymeric particulate systems. Pharm. Res. 23, 460–474
(2006).
35. Dokoumetzidis, A. Macheras, P. A century of dissolution research: from
Noyes and Whitney to the biopharmaceutics classification system. Int. J.
Pharm. 321, 1–11 (2006).