SlideShare a Scribd company logo
1 of 4
Download to read offline
What is Takt Time?
                             Takt time is the maximum amount of time in which a product
                             needs to be produced in order to satisfy customer demand.
                             The term comes from the German word “Takt,” which
                             means “pulse.” Set by customer demand, Takt creates the
                             pulse or rhythm across all processes in a business to
                             ensure continuous flow and utilization of capacities (e.g.,
                             man and machine).

Why Do We Need Takt Time?

Takt time is more than a metric of time — it’s a whole different way of thinking for running
your operations.
First, Takt ensures that all the capacity in a business is planned and utilized and still
meets overall customer demand. By and large, Takt will help to deliver the right product
(RP) at the right time (RT) in the right quantity (RQ) to the customer. You can achieve
RP, RT, and RQ without implementing Takt; however, this could lead to much waste of
man and machine.
Second, Takt creates a constant pulse across your processes, which will immediately
highlight capacity issues, synchronization issues among processes, quality issues and
many others.

How to Calculate Takt Time:
                         Takt Time = Production Time Available
                                         Customer Demand

Where production time available = total production time – breaks – maintenance
activities – shift changeover – clean down time and Customer demand = amount of units
required by customer/ time period

Calculation Example:
Total Time: 8 Hours X 60 Minutes = 480 Minutes
Breaks: 50 Minutes
Time Available: 430 Minutes
Customer Demand in 8 Hours: 100 Pcs
Takt Time: 430 / 100 = 4.3 Minutes = 258 Seconds
This example shows that the customer will need one pcs every 258 seconds. However,
you might like to produce a single pcs in little less than 258 seconds in order to
accommodate any variation in process steps, breakdowns, quality issues, etc. It’s
therefore essential that before you implement Takt, you ensure that your processes are
dependable and can deliver good quality, and that your machine has a very high uptime.
How to Implement Takt Time
Takt has an easy formula, but it’s one of the most difficult to implement in the Lean
world.


You can start implementing Takt time by first measuring individual cycle times. Insert this
data into the formula in order to calculate Takt time.
To begin aligning your process to the Takt time, start dividing the work that goes into the
process into value adding and non-value adding activity.

                                                                               Eliminate
                                                                                the non-
                                                                                  value
                                                                                 adding
                                                                                time and
                                                                                 balance
                                                                                   the
                                                                               workload
                                                                                  of the
                                                                               operators.


                                                              Bring the individual cycle
                                                               times closer to the Takt
                                                                  time. Keep the line
                                                              balanced. In this case you
                                                              will need fewer operators.
A Real Life Takt Time

Consider the process of a water delivery system.

The overall demand of water consumption is set by the homes that consume the water
over 24 hours. However, the homes’ occupants do not consume the same amount of
water across the 24 hours: There is a huge peak in consumption in the morning,
afternoon and late evening, but for the rest of the day consumption is very low.
However, the city water treatment plant cannot operate only when water consumption
peaks, as the plant risks wasting much of its capacity. Therefore, the plant designs its
capacity by looking at the consumers’ daily water consumption in liters per hour and also
by considering seasonal fluctuations and the potential increase in consumption over the
years to come.
Based on this data, the plant calculates what the demand is every hour and adds a little
buffer to address fluctuations, breakdowns, leakages, etc. The water treatment plant
operates based on this demand rate so that each process step must deliver the same
amount of water in that period.
If some process is not able to deliver at the same rate, then either the plant needs to add
more capacity or run that process for a longer time. The reservoir in between the plant
and the homes (shown in the figure below) will smooth the impact of demand on the
production process. The reservoir will also help with capacity issues related to the fact
that as the water treatment plant is delivering water at a constant rate, consumption
remains variable over the course of the day.
Now the trade-off is between the cost advantage to run the power plant at the same run
rate across the day and the cost of the reservoir. There is no one answer in the real
world. Depending on your cost structure of man, machine and material, you must define
how smoothly you can run your processes across the day, week or month, versus the
inventory you may need to be able to adjust to customer demand variation. On the other
hand, inventory is evil in the Lean world, but you have to look at total cost versus
individual costs.


About Pankaj Aggarwal
               Pankaj Aggarwal is the Regional Director for telecommunications giant
               Indus Towers. He has nearly two decades of experience working in
               Operations, Operational excellence and Supply Chain Management
               roles.
                Prior to Indus Towers, Pankaj worked for Lufthansa, Delphi Automotive,
General Electric, Suzuki Motors, KPMG Peat Marwick, and Tata Engineering. While
working for these companies he gained experience in the automotive industry, research
and development, manufacturing operations, consultancy, quality management, supplier
development, and auditing. He has worked with more than 300 companies of various
types in various capacities.
Aggarwal is a mechanical engineer and has an MBA in Finance and Marketing. In
addition, he is a certified Six Sigma Master Black Belt, DFSS Master, Shainin
Journeyman, Certified auditor for QS 9000/ ISO 9000 and Lean Leader.
I invite you to join as a member of the PEX Network Group http://tinyurl.com/3hwakem,
you will have access to Key Leaders Globally, Events, Webinars, Presentations, Articles,
Case Studies, Blog Discussions, White Papers, and Tools and Templates. To access
this free content please take 2 minutes for a 1 time FREE registration at
http://tiny.cc/tpkd0
PEX Network, a division of IQPC, facilitates access to a wealth of relevant content for
Process Excellence, Lean, and Six Sigma practitioners. Further enhanced with an online
community of your peers, we will provide you with the tools and resources to help you
perform more effective and efficiently, while enhancing the quality operations within your
organization. As our industry becomes more and more dependent on the Web for
information, PEXNetwork.com has been developed to provide Six Sigma professionals
with instant access to information. Leveraging our strength and foundation in education,
IQPC and the Process Excellence Network are uniquely positioned to provide a
comprehensive library of webcasts gathered from our events, as well as exclusive
content from leaders in the industry.

More Related Content

Viewers also liked

Viewers also liked (14)

Overall Equipment Effectiveness
Overall Equipment EffectivenessOverall Equipment Effectiveness
Overall Equipment Effectiveness
 
NG BB 18 Theory of Constraints
NG BB 18 Theory of ConstraintsNG BB 18 Theory of Constraints
NG BB 18 Theory of Constraints
 
Total Productive Maintenance - TPM
Total Productive Maintenance - TPM Total Productive Maintenance - TPM
Total Productive Maintenance - TPM
 
Tpm Presentation
Tpm PresentationTpm Presentation
Tpm Presentation
 
TPM. DR. K. BARANIDHARAN
TPM. DR. K. BARANIDHARANTPM. DR. K. BARANIDHARAN
TPM. DR. K. BARANIDHARAN
 
Presentation on Total Productive Maintenance
Presentation on Total Productive MaintenancePresentation on Total Productive Maintenance
Presentation on Total Productive Maintenance
 
Total Productive Maintenance
Total Productive MaintenanceTotal Productive Maintenance
Total Productive Maintenance
 
tpm presentation
tpm presentationtpm presentation
tpm presentation
 
Overall Equipment Effectiveness
Overall Equipment EffectivenessOverall Equipment Effectiveness
Overall Equipment Effectiveness
 
Value Stream Mapping: Case Studies
Value Stream Mapping: Case StudiesValue Stream Mapping: Case Studies
Value Stream Mapping: Case Studies
 
Value Stream Mapping Process
Value Stream Mapping ProcessValue Stream Mapping Process
Value Stream Mapping Process
 
Takt Time, Cycle Time & Line Balancing
Takt Time, Cycle Time & Line BalancingTakt Time, Cycle Time & Line Balancing
Takt Time, Cycle Time & Line Balancing
 
Value stream mapping ppt
Value stream mapping pptValue stream mapping ppt
Value stream mapping ppt
 
Value stream mapping training
Value stream mapping trainingValue stream mapping training
Value stream mapping training
 

More from Nat Evans

14th Annual Process Excellence Week 2013
14th Annual Process Excellence Week 201314th Annual Process Excellence Week 2013
14th Annual Process Excellence Week 2013Nat Evans
 
Pex Clb Final 2013
Pex Clb Final 2013Pex Clb Final 2013
Pex Clb Final 2013Nat Evans
 
Pex Orlando 2013 Bdpack Final
Pex Orlando 2013 Bdpack FinalPex Orlando 2013 Bdpack Final
Pex Orlando 2013 Bdpack FinalNat Evans
 
Pex Clb Ibm Final 2013
Pex Clb Ibm Final 2013Pex Clb Ibm Final 2013
Pex Clb Ibm Final 2013Nat Evans
 
B2 B Inbound Marketing Pack
B2 B Inbound Marketing PackB2 B Inbound Marketing Pack
B2 B Inbound Marketing PackNat Evans
 
Process Excellence At Credit Agricole Corporate & Investment Bank Case Study
Process Excellence At Credit Agricole Corporate & Investment Bank Case StudyProcess Excellence At Credit Agricole Corporate & Investment Bank Case Study
Process Excellence At Credit Agricole Corporate & Investment Bank Case StudyNat Evans
 
Outside In Steve Towers
Outside In Steve TowersOutside In Steve Towers
Outside In Steve TowersNat Evans
 
Qaa Paul Nelson
Qaa   Paul NelsonQaa   Paul Nelson
Qaa Paul NelsonNat Evans
 
Scatter Diagrams
Scatter DiagramsScatter Diagrams
Scatter DiagramsNat Evans
 
Pareto Charts
Pareto ChartsPareto Charts
Pareto ChartsNat Evans
 
Cause & Effect Diagrams
Cause & Effect DiagramsCause & Effect Diagrams
Cause & Effect DiagramsNat Evans
 
Affinity Diagrams
Affinity DiagramsAffinity Diagrams
Affinity DiagramsNat Evans
 
Six Sigma Wiife
Six Sigma WiifeSix Sigma Wiife
Six Sigma WiifeNat Evans
 
Project Charter Action Template
Project Charter Action TemplateProject Charter Action Template
Project Charter Action TemplateNat Evans
 
The Path To Operational Excellence 5 Components Of Success
The Path To Operational Excellence   5 Components Of SuccessThe Path To Operational Excellence   5 Components Of Success
The Path To Operational Excellence 5 Components Of SuccessNat Evans
 
Empowering Front Line Managers By Professionalizing Operations Management
Empowering Front Line Managers By Professionalizing Operations ManagementEmpowering Front Line Managers By Professionalizing Operations Management
Empowering Front Line Managers By Professionalizing Operations ManagementNat Evans
 
Leadership Essentials For Process Professionals
Leadership Essentials For Process ProfessionalsLeadership Essentials For Process Professionals
Leadership Essentials For Process ProfessionalsNat Evans
 
Creating Winning Businesses Deming’S System Of Profound Knowledge
Creating Winning Businesses   Deming’S System Of Profound KnowledgeCreating Winning Businesses   Deming’S System Of Profound Knowledge
Creating Winning Businesses Deming’S System Of Profound KnowledgeNat Evans
 

More from Nat Evans (20)

14th Annual Process Excellence Week 2013
14th Annual Process Excellence Week 201314th Annual Process Excellence Week 2013
14th Annual Process Excellence Week 2013
 
Pex Clb Final 2013
Pex Clb Final 2013Pex Clb Final 2013
Pex Clb Final 2013
 
Pex Orlando 2013 Bdpack Final
Pex Orlando 2013 Bdpack FinalPex Orlando 2013 Bdpack Final
Pex Orlando 2013 Bdpack Final
 
Pex Clb Ibm Final 2013
Pex Clb Ibm Final 2013Pex Clb Ibm Final 2013
Pex Clb Ibm Final 2013
 
B2 B Inbound Marketing Pack
B2 B Inbound Marketing PackB2 B Inbound Marketing Pack
B2 B Inbound Marketing Pack
 
Process Excellence At Credit Agricole Corporate & Investment Bank Case Study
Process Excellence At Credit Agricole Corporate & Investment Bank Case StudyProcess Excellence At Credit Agricole Corporate & Investment Bank Case Study
Process Excellence At Credit Agricole Corporate & Investment Bank Case Study
 
Outside In Steve Towers
Outside In Steve TowersOutside In Steve Towers
Outside In Steve Towers
 
Qaa Paul Nelson
Qaa   Paul NelsonQaa   Paul Nelson
Qaa Paul Nelson
 
Scatter Diagrams
Scatter DiagramsScatter Diagrams
Scatter Diagrams
 
Pareto Charts
Pareto ChartsPareto Charts
Pareto Charts
 
Histograms
HistogramsHistograms
Histograms
 
Dot Plots
Dot PlotsDot Plots
Dot Plots
 
Cause & Effect Diagrams
Cause & Effect DiagramsCause & Effect Diagrams
Cause & Effect Diagrams
 
Affinity Diagrams
Affinity DiagramsAffinity Diagrams
Affinity Diagrams
 
Six Sigma Wiife
Six Sigma WiifeSix Sigma Wiife
Six Sigma Wiife
 
Project Charter Action Template
Project Charter Action TemplateProject Charter Action Template
Project Charter Action Template
 
The Path To Operational Excellence 5 Components Of Success
The Path To Operational Excellence   5 Components Of SuccessThe Path To Operational Excellence   5 Components Of Success
The Path To Operational Excellence 5 Components Of Success
 
Empowering Front Line Managers By Professionalizing Operations Management
Empowering Front Line Managers By Professionalizing Operations ManagementEmpowering Front Line Managers By Professionalizing Operations Management
Empowering Front Line Managers By Professionalizing Operations Management
 
Leadership Essentials For Process Professionals
Leadership Essentials For Process ProfessionalsLeadership Essentials For Process Professionals
Leadership Essentials For Process Professionals
 
Creating Winning Businesses Deming’S System Of Profound Knowledge
Creating Winning Businesses   Deming’S System Of Profound KnowledgeCreating Winning Businesses   Deming’S System Of Profound Knowledge
Creating Winning Businesses Deming’S System Of Profound Knowledge
 

What Is Takt Time

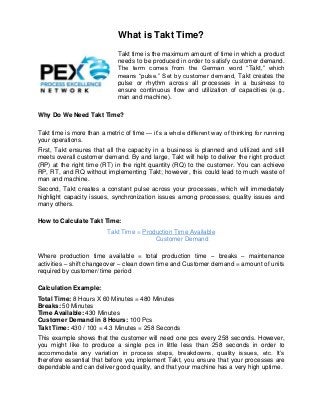
  • 1. What is Takt Time? Takt time is the maximum amount of time in which a product needs to be produced in order to satisfy customer demand. The term comes from the German word “Takt,” which means “pulse.” Set by customer demand, Takt creates the pulse or rhythm across all processes in a business to ensure continuous flow and utilization of capacities (e.g., man and machine). Why Do We Need Takt Time? Takt time is more than a metric of time — it’s a whole different way of thinking for running your operations. First, Takt ensures that all the capacity in a business is planned and utilized and still meets overall customer demand. By and large, Takt will help to deliver the right product (RP) at the right time (RT) in the right quantity (RQ) to the customer. You can achieve RP, RT, and RQ without implementing Takt; however, this could lead to much waste of man and machine. Second, Takt creates a constant pulse across your processes, which will immediately highlight capacity issues, synchronization issues among processes, quality issues and many others. How to Calculate Takt Time: Takt Time = Production Time Available Customer Demand Where production time available = total production time – breaks – maintenance activities – shift changeover – clean down time and Customer demand = amount of units required by customer/ time period Calculation Example: Total Time: 8 Hours X 60 Minutes = 480 Minutes Breaks: 50 Minutes Time Available: 430 Minutes Customer Demand in 8 Hours: 100 Pcs Takt Time: 430 / 100 = 4.3 Minutes = 258 Seconds This example shows that the customer will need one pcs every 258 seconds. However, you might like to produce a single pcs in little less than 258 seconds in order to accommodate any variation in process steps, breakdowns, quality issues, etc. It’s therefore essential that before you implement Takt, you ensure that your processes are dependable and can deliver good quality, and that your machine has a very high uptime.
  • 2. How to Implement Takt Time Takt has an easy formula, but it’s one of the most difficult to implement in the Lean world. You can start implementing Takt time by first measuring individual cycle times. Insert this data into the formula in order to calculate Takt time. To begin aligning your process to the Takt time, start dividing the work that goes into the process into value adding and non-value adding activity. Eliminate the non- value adding time and balance the workload of the operators. Bring the individual cycle times closer to the Takt time. Keep the line balanced. In this case you will need fewer operators.
  • 3. A Real Life Takt Time Consider the process of a water delivery system. The overall demand of water consumption is set by the homes that consume the water over 24 hours. However, the homes’ occupants do not consume the same amount of water across the 24 hours: There is a huge peak in consumption in the morning, afternoon and late evening, but for the rest of the day consumption is very low. However, the city water treatment plant cannot operate only when water consumption peaks, as the plant risks wasting much of its capacity. Therefore, the plant designs its capacity by looking at the consumers’ daily water consumption in liters per hour and also by considering seasonal fluctuations and the potential increase in consumption over the years to come. Based on this data, the plant calculates what the demand is every hour and adds a little buffer to address fluctuations, breakdowns, leakages, etc. The water treatment plant operates based on this demand rate so that each process step must deliver the same amount of water in that period. If some process is not able to deliver at the same rate, then either the plant needs to add more capacity or run that process for a longer time. The reservoir in between the plant and the homes (shown in the figure below) will smooth the impact of demand on the production process. The reservoir will also help with capacity issues related to the fact that as the water treatment plant is delivering water at a constant rate, consumption remains variable over the course of the day.
  • 4. Now the trade-off is between the cost advantage to run the power plant at the same run rate across the day and the cost of the reservoir. There is no one answer in the real world. Depending on your cost structure of man, machine and material, you must define how smoothly you can run your processes across the day, week or month, versus the inventory you may need to be able to adjust to customer demand variation. On the other hand, inventory is evil in the Lean world, but you have to look at total cost versus individual costs. About Pankaj Aggarwal Pankaj Aggarwal is the Regional Director for telecommunications giant Indus Towers. He has nearly two decades of experience working in Operations, Operational excellence and Supply Chain Management roles. Prior to Indus Towers, Pankaj worked for Lufthansa, Delphi Automotive, General Electric, Suzuki Motors, KPMG Peat Marwick, and Tata Engineering. While working for these companies he gained experience in the automotive industry, research and development, manufacturing operations, consultancy, quality management, supplier development, and auditing. He has worked with more than 300 companies of various types in various capacities. Aggarwal is a mechanical engineer and has an MBA in Finance and Marketing. In addition, he is a certified Six Sigma Master Black Belt, DFSS Master, Shainin Journeyman, Certified auditor for QS 9000/ ISO 9000 and Lean Leader. I invite you to join as a member of the PEX Network Group http://tinyurl.com/3hwakem, you will have access to Key Leaders Globally, Events, Webinars, Presentations, Articles, Case Studies, Blog Discussions, White Papers, and Tools and Templates. To access this free content please take 2 minutes for a 1 time FREE registration at http://tiny.cc/tpkd0 PEX Network, a division of IQPC, facilitates access to a wealth of relevant content for Process Excellence, Lean, and Six Sigma practitioners. Further enhanced with an online community of your peers, we will provide you with the tools and resources to help you perform more effective and efficiently, while enhancing the quality operations within your organization. As our industry becomes more and more dependent on the Web for information, PEXNetwork.com has been developed to provide Six Sigma professionals with instant access to information. Leveraging our strength and foundation in education, IQPC and the Process Excellence Network are uniquely positioned to provide a comprehensive library of webcasts gathered from our events, as well as exclusive content from leaders in the industry.