SlideShare a Scribd company logo
1 of 12
Download to read offline
October 2015 Quick Facts
Change in Combined Change in Combined
Closed Sales Avg. Sales Price
2
3
4
5
6
7
8
9
10
11
12
Monthly Indicators
+ 0.5% + 6.1% - 30.6%
Change in Combined
Transitory periods in the market are common this time of year, and after a
persistent period of steady year-over-year climbs in sales metrics, recent low
national numbers have not fulfilled what many predicted. But on a positive
note, jobless claims have also been at low levels, coming in as the lowest
number since 1973. As always, every market and situation is unique, so some
numbers seen in national trends may not always line up with local markets.
Closed Sales increased 0.1 percent for existing homes and 4.3 percent for
new homes. Pending Sales increased 17.9 percent for existing homes and
17.7 percent for new homes. Inventory decreased 27.0 percent for existing
homes and 11.6 percent for new homes.
The Median Sales Price was up 9.2 percent to $158,350 for existing homes
and 2.1 percent to $341,726 for new homes. Days on Market decreased 16.7
percent for existing homes but increased 4.6 percent for new homes. Supply
decreased 33.3 percent for existing homes and 23.2 percent for new homes.
Interest rates are an area to pay attention to as rate hikes are widely expected
before the year ends. The Federal Reserve Bank has skipped two
opportunities to raise rates this fall, but the final meeting in December will
likely include a minor rate hike. Although we are headed into a slower time of
year, as housing activity goes, there are still many nuggets of optimism to
mine from monthly figures.
Supply
Residental real estate activity in Atchison KS, Bates MO, Buchanan MO, Cass MO,
Clay MO, Clinton MO, Douglas KS, Franklin KS, Jackson MO, Jefferson KS, Johnson
KS, Johnson MO, Lafayette MO, Leavenworth KS, Linn KS, Miami KS, Platte MO, Ray
MO and Wyandotte KS counties. Percent changes are calculated using rounded
figures.
Existing Homes Market Overview
Current as of November 7, 2015. Report Provided by the Kansas City Regional Association of REALTORS®. All data from Heartland Multiple Listing Service. Powered by 10K Research and Marketing.
New Homes Market Overview
Pending Sales
Inventory
Supply
New and Existing Homes Combined Activity Overview
Closed Sales
Average Sales Price
Median Sales Price
Days on Market Until Sale
Percentage of Original List Price Received
Existing Homes Market Overview
Key Metrics Historical Sparkbars 10-2014 10-2015 Percent Change YTD 2014 YTD 2015 Percent Change
Key metrics by report month and for year-to-date (YTD) starting from the first of the year.
Closed Sales 2,602 2,604 + 0.1% 28,180 + 11.1%
Average Sales Price $173,129 $184,478 + 6.6% $176,851 $187,340 + 5.9%
25,366
+ 6.7%
Days on Market 78 65 - 16.7% 77 68 - 11.7%
Median Sales Price $145,000 $158,350 + 9.2% $150,000 $160,000
+ 1.2%
Pending Sales 2,166 2,553 + 17.9% 26,127 29,797 + 14.0%
Pct. of Orig. Price Received 93.0% 94.3% + 1.4% 93.6% 94.7%
Current as of November 7, 2015. Report Provided by the Kansas City Regional Association of REALTORS®. All data from Heartland Multiple Listing Service. Powered by 10K Research and Marketing. | 2
--
Supply 4.8 3.2 - 33.3% -- -- --
Inventory 11,682 8,531 - 27.0% -- --
10-2012 10-2013 10-2014 10-2015
10-2012 10-2013 10-2014 10-2015
10-2012 10-2013 10-2014 10-2015
10-2012 10-2013 10-2014 10-2015
10-2012 10-2013 10-2014 10-2015
10-2012 10-2013 10-2014 10-2015
10-2012 10-2013 10-2014 10-2015
10-2012 10-2013 10-2014 10-2015
New Homes Market Overview
Key Metrics Historical Sparkbars 10-2014 10-2015 Percent Change YTD 2014 YTD 2015 Percent Change
Current as of November 7, 2015. Report Provided by the Kansas City Regional Association of REALTORS®. All data from Heartland Multiple Listing Service. Powered by 10K Research and Marketing. | 3
--Supply 6.9 5.3 - 23.2% -- --
+ 24.6%
Inventory 1,576 1,393 - 11.6% -- -- --
Pending Sales 192 226 + 17.7% 2,417 3,012
101.1% - 0.6%
Days on Market 108 113 + 4.6% 128 147
Pct. of Orig. Price Received 101.8% 101.9% + 0.1% 101.7%
$329,900 + 1.8%
+ 14.8%
Median Sales Price $334,846 $341,726 + 2.1% $323,992
2,718 + 17.7%
Average Sales Price $361,591 $368,598 + 1.9% $356,293 $359,719 + 1.0%
2,310
Key metrics by report month and for year-to-date (YTD) starting from the first of the year.
Closed Sales 258 269 + 4.3%
10-2012 10-2013 10-2014 10-2015
10-2012 10-2013 10-2014 10-2015
10-2012 10-2013 10-2014 10-2015
10-2012 10-2013 10-2014 10-2015
10-2012 10-2013 10-2014 10-2015
10-2012 10-2013 10-2014 10-2015
10-2012 10-2013 10-2014 10-2015
10-2012 10-2013 10-2014 10-2015
New and Existing Homes Combined Activity Overview
Key Metrics Historical Sparkbars 10-2014 10-2015 Percent Change YTD 2014 YTD 2015 Percent Change
Current as of November 7, 2015. Report Provided by the Kansas City Regional Association of REALTORS®. All data from Heartland Multiple Listing Service. Powered by 10K Research and Marketing. | 4
--Supply 4.9 3.4 - 30.6% -- --
+ 14.9%
Inventory 13,263 9,925 - 25.2% -- -- --
Pending Sales 2,358 2,779 + 17.9% 28,547 32,812
95.2% + 1.0%
Days on Market 81 70 - 13.6% 81 75
Pct. of Orig. Price Received 93.8% 95.0% + 1.3% 94.3%
$170,000 + 6.3%
- 7.4%
Median Sales Price $155,000 $170,000 + 9.7% $159,900
30,902 + 11.6%
Average Sales Price $190,166 $201,748 + 6.1% $191,856 $202,524 + 5.6%
27,683
Key metrics by report month and for year-to-date (YTD) starting from the first of the year.
Closed Sales 2,860 2,874 + 0.5%
10-2012 10-2013 10-2014 10-2015
10-2012 10-2013 10-2014 10-2015
10-2012 10-2013 10-2014 10-2015
10-2012 10-2013 10-2014 10-2015
10-2012 10-2013 10-2014 10-2015
10-2012 10-2013 10-2014 10-2015
10-2012 10-2013 10-2014 10-2015
10-2012 10-2013 10-2014 10-2015
Closed Sales
Closed Sales Existing Homes
Year-Over-Year
Change New Homes
Year-Over-Year
Change
Nov-2014 1,983 -0.8% 205 -2.4%
Dec-2014 2,155 +3.9% 248 +14.3%
Jan-2015 1,604 +1.8% 146 -8.8%
Feb-2015 1,773 +6.6% 173 +16.9%
Mar-2015 2,581 +21.6% 278 +37.6%
Apr-2015 2,903 +15.2% 300 +33.3%
May-2015 3,462 +9.6% 359 +29.6%
Jun-2015 3,677 +12.0% 329 +19.2%
Jul-2015 3,588 +15.6% 325 +15.7%
Aug-2015 3,054 +7.5% 293 +9.3%
Sep-2015 2,842 +14.0% 244 +13.5%
Oct-2015 2,604 +0.1% 269 +4.3%
12-Month Avg 2,686 +9.8% 264 +15.9%
Historical Closed Sales by Month
Current as of November 7, 2015. Report Provided by the Kansas City Regional Association of REALTORS®. All data from Heartland Multiple Listing Service. Powered by 10K Research and Marketing. | 5
A count of the actual sales that closed in a given month.
2,377
238
2,602
258
2,604
269
Existing Homes New Homes
October
0
1,000
2,000
3,000
4,000
1-2004 1-2005 1-2006 1-2007 1-2008 1-2009 1-2010 1-2011 1-2012 1-2013 1-2014 1-2015
Existing Homes New Homes
25,326
2,235
25,366
2,310
28,180
2,718
Existing Homes New Homes
Year to Date
2013 2014 2015
+ 4.3%+ 8.4%+ 0.1%+ 9.5% + 3.4%+ 11.1%+ 0.2% + 17.7%
2013 2014 2015 2013 2014 2015 2013 2014 2015
+ 2.4% + 10.4% + 15.6%+ 20.8%
Average Sales Price
Avg. Sales Price Existing Homes
Year-Over-Year
Change New Homes
Year-Over-Year
Change
Nov-2014 $176,835 +4.8% $358,575 +0.9%
Dec-2014 $174,116 +1.0% $386,930 +8.9%
Jan-2015 $169,065 +7.8% $371,246 +5.4%
Feb-2015 $166,197 +9.8% $383,869 +12.2%
Mar-2015 $175,567 +9.8% $366,426 +8.0%
Apr-2015 $182,834 +4.3% $346,286 +0.4%
May-2015 $193,914 +6.0% $337,638 -7.2%
Jun-2015 $199,761 +6.2% $355,712 -2.1%
Jul-2015 $197,989 +4.2% $361,576 -0.2%
Aug-2015 $191,860 +3.4% $346,871 -1.6%
Sep-2015 $184,554 +4.0% $382,717 +3.8%
Oct-2015 $184,478 +6.6% $368,598 +1.9%
12-Month Avg* $175,987 +5.6% $356,149 +1.6%
Historical Average Sales Price by Month
Average sales price for all closed sales, not accounting for seller concessions, in a given month.
* Avg. Sales Price for all properties from November 2014 through October 2015. This is not the
average of the individual figures above.
Current as of November 7, 2015. Report Provided by the Kansas City Regional Association of REALTORS®. All data from Heartland Multiple Listing Service. Powered by 10K Research and Marketing. | 6
$166,477
$356,916
$173,129
$361,591
$184,478
$368,598
Existing Homes New Homes
October
$100,000
$150,000
$200,000
$250,000
$300,000
$350,000
$400,000
1-2004 1-2005 1-2006 1-2007 1-2008 1-2009 1-2010 1-2011 1-2012 1-2013 1-2014 1-2015
Existing Homes New Homes
$167,976
$340,953
$176,851
$356,293
$187,340
$359,719
Existing Homes New Homes
Year to Date
2013 2014 2015
+ 1.9%+ 1.3%+ 6.6%+ 4.0% + 4.5%+ 5.9%+ 5.3% + 1.0%
2013 2014 2015 2013 2014 2015 2013 2014 2015
+ 7.1% + 8.4% + 10.1%+ 9.2%
Median Sales Price
Median Sales Price Existing Homes
Year-Over-Year
Change New Homes
Year-Over-Year
Change
Nov-2014 $146,000 +5.0% $328,000 +4.2%
Dec-2014 $147,000 +5.5% $345,712 +8.3%
Jan-2015 $139,000 +5.3% $327,911 +2.2%
Feb-2015 $139,075 +8.7% $344,950 +8.6%
Mar-2015 $150,500 +11.5% $331,000 +4.7%
Apr-2015 $159,900 +8.4% $322,825 +3.4%
May-2015 $169,900 +9.6% $304,850 -3.5%
Jun-2015 $170,000 +6.3% $333,886 -0.2%
Jul-2015 $168,000 +5.0% $329,950 +0.0%
Aug-2015 $165,000 +6.5% $328,516 +1.2%
Sep-2015 $155,000 +3.3% $333,256 +0.4%
Oct-2015 $158,350 +9.2% $341,726 +2.1%
12-Month Avg* $148,500 +6.4% $321,450 +2.7%
Historical Median Sales Price by Month
Point at which half of the sales sold for more and half sold for less, not accounting for seller concessions, in a given month.
* Median Sales Price for all properties from November 2014 through October 2015. This is not the
average of the individual figures above.
Current as of November 7, 2015. Report Provided by the Kansas City Regional Association of REALTORS®. All data from Heartland Multiple Listing Service. Powered by 10K Research and Marketing. | 7
$140,000
$311,987
$145,000
$334,846
$158,350
$341,726
Existing Homes New Homes
October
$100,000
$150,000
$200,000
$250,000
$300,000
$350,000
1-2004 1-2005 1-2006 1-2007 1-2008 1-2009 1-2010 1-2011 1-2012 1-2013 1-2014 1-2015
Existing Homes New Homes
$142,500
$310,000
$150,000
$323,992
$160,000
$329,900
Existing Homes New Homes
Year to Date
2013 2014 2015
+ 2.1%+ 7.3%+ 9.2%+ 3.6% + 4.5%+ 6.7%+ 5.3% + 1.8%
2013 2014 2015 2013 2014 2015 2013 2014 2015
+ 6.1% + 8.0% + 10.7%+ 2.7%
Days on Market Until Sale
Days on Market Existing Homes
Year-Over-Year
Change New Homes
Year-Over-Year
Change
Nov-2014 75 -8.5% 106 +34.2%
Dec-2014 82 0.0% 108 +9.1%
Jan-2015 87 -1.1% 126 +22.3%
Feb-2015 90 -1.1% 149 +30.7%
Mar-2015 82 -6.8% 169 +45.7%
Apr-2015 71 -7.8% 148 +5.0%
May-2015 60 -22.1% 164 +15.5%
Jun-2015 60 -14.3% 153 -1.3%
Jul-2015 60 -13.0% 158 +9.0%
Aug-2015 61 -17.6% 141 +23.7%
Sep-2015 64 -12.3% 125 +6.8%
Oct-2015 65 -16.7% 113 +4.6%
12-Month Avg* 78 -11.1% 122 +16.0%
Historical Days on Market Until Sale by Month
Average number of days between when a property is listed and when an offer is accepted in a given month.
* Days on Market for all properties from November 2014 through October 2015. This is not the
average of the individual figures above.
Current as of November 7, 2015. Report Provided by the Kansas City Regional Association of REALTORS®. All data from Heartland Multiple Listing Service. Powered by 10K Research and Marketing. | 8
76
84
78
108
65
113
Existing Homes New Homes
October
50
75
100
125
150
175
200
225
1-2004 1-2005 1-2006 1-2007 1-2008 1-2009 1-2010 1-2011 1-2012 1-2013 1-2014 1-2015
Existing Homes New Homes
81
120
77
128
68
147
Existing Homes New Homes
Year to Date
2013 2014 2015
+ 4.6%+ 28.6%- 16.7%+ 2.6% + 6.7%- 11.7%- 4.9% + 14.8%
2013 2014 2015 2013 2014 2015 2013 2014 2015
- 14.6% - 13.8% - 16.7%- 35.4%
Percentage of Original List Price Received
Pct. of Orig. Price
Received Existing Homes
Year-Over-Year
Change New Homes
Year-Over-Year
Change
Nov-2014 93.1% +0.5% 102.0% +0.3%
Dec-2014 92.4% +0.5% 101.8% -0.1%
Jan-2015 92.1% +0.3% 100.5% -2.1%
Feb-2015 92.6% +1.5% 100.4% -0.8%
Mar-2015 93.8% +1.2% 100.8% -1.1%
Apr-2015 95.1% +1.1% 101.2% -0.5%
May-2015 95.7% +1.5% 101.3% -0.1%
Jun-2015 95.7% +1.2% 101.1% -1.0%
Jul-2015 95.3% +1.0% 101.3% -0.3%
Aug-2015 95.0% +1.3% 101.6% +0.3%
Sep-2015 94.5% +1.2% 100.7% -1.2%
Oct-2015 94.3% +1.4% 101.9% +0.1%
12-Month Avg* 93.4% +1.1% 101.8% -0.5%
Historical Percentage of Original List Price Received by Month
Percentage found when dividing a property’s sales price by its original list price, then taking the average for all properties sold
in a given month, not accounting for seller concessions.
* Pct. of Orig. Price Received for all properties from November 2014 through October 2015. This
is not the average of the individual figures above.
Current as of November 7, 2015. Report Provided by the Kansas City Regional Association of REALTORS®. All data from Heartland Multiple Listing Service. Powered by 10K Research and Marketing. | 9
92.5%
102.1%
93.0%
101.8%
94.3%
101.9%
Existing Homes New Homes
October
85.0%
90.0%
95.0%
100.0%
105.0%
1-2004 1-2005 1-2006 1-2007 1-2008 1-2009 1-2010 1-2011 1-2012 1-2013 1-2014 1-2015
Existing Homes New Homes
93.1%
101.7%
93.6%
101.7%
94.7%
101.1%
Existing Homes New Homes
Year to Date
2013 2014 2015
+ 0.1%- 0.3%+ 1.4%+ 0.5% 0.0%+ 1.2%+ 0.5% - 0.6%
2013 2014 2015 2013 2014 2015 2013 2014 2015
+ 1.3% + 2.2% + 1.8%+ 1.1%
Pending Sales
Pending Sales Existing Homes
Year-Over-Year
Change New Homes
Year-Over-Year
Change
Nov-2014 1,858 +6.1% 182 +21.3%
Dec-2014 1,654 +14.5% 170 +7.6%
Jan-2015 2,221 +9.6% 268 +31.4%
Feb-2015 2,591 +26.5% 285 +43.9%
Mar-2015 3,327 +15.2% 371 +22.4%
Apr-2015 3,675 +16.9% 416 +35.5%
May-2015 3,385 +4.1% 360 +35.8%
Jun-2015 3,320 +10.4% 293 +3.9%
Jul-2015 3,128 +13.9% 304 +17.4%
Aug-2015 3,013 +17.3% 273 +33.2%
Sep-2015 2,734 +20.1% 204 +1.0%
Oct-2015 2,553 +17.9% 226 +17.7%
12-Month Avg 2,788 +13.6% 279 +23.4%
Historical Pending Sales by Month
A count of the properties on which offers have been accepted in a given month.
Current as of November 7, 2015. Report Provided by the Kansas City Regional Association of REALTORS®. All data from Heartland Multiple Listing Service. Powered by 10K Research and Marketing. | 10
2,152
188
2,166
192
2,553
226
Existing Homes New Homes
October
$0
$1,000
$2,000
$3,000
$4,000
1-2004 1-2005 1-2006 1-2007 1-2008 1-2009 1-2010 1-2011 1-2012 1-2013 1-2014 1-2015
Existing Homes New Homes
25,963
2,400
26,127
2,417
29,797
3,012
Existing Homes New Homes
Year to Date
2013 2014 2015
+ 17.7%+ 2.1%+ 17.9%+ 0.7% + 0.7%+ 14.0%+ 0.6% + 24.6%
2013 2014 2015 2013 2014 2015 2013 2014 2015
- 4.1% + 8.5% + 7.4%- 11.7%
Inventory
Inventory Existing Homes
Year-Over-Year
Change New Homes
Year-Over-Year
Change
Nov-2014 10,705 -13.8% 1,605 +22.2%
Dec-2014 9,415 -14.1% 1,628 +21.1%
Jan-2015 9,184 -14.6% 1,604 +14.9%
Feb-2015 8,999 -16.1% 1,547 +9.8%
Mar-2015 9,262 -17.1% 1,494 +8.6%
Apr-2015 9,694 -18.5% 1,455 +3.0%
May-2015 10,138 -17.7% 1,388 -0.4%
Jun-2015 10,180 -17.3% 1,365 -1.9%
Jul-2015 10,185 -18.5% 1,330 -5.5%
Aug-2015 9,598 -22.2% 1,346 -8.1%
Sep-2015 8,738 -28.0% 1,369 -10.5%
Oct-2015 8,531 -27.0% 1,393 -11.6%
12-Month Avg* 9,552 -18.2% 1,460 +3.2%
Historical Inventory by Month
The number of properties available for sale in active status at the end of a given month.
* Inventory for all properties from November 2014 through October 2015. This is not the average
of the individual figures above.
Current as of November 7, 2015. Report Provided by the Kansas City Regional Association of REALTORS®. All data from Heartland Multiple Listing Service. Powered by 10K Research and Marketing. | 11
13,112
1,267
11,682
1,576
8,531
1,393
Existing Homes New Homes
October
0
5,000
10,000
15,000
20,000
25,000
1-2004 1-2005 1-2006 1-2007 1-2008 1-2009 1-2010 1-2011 1-2012 1-2013 1-2014 1-2015
Existing Homes New Homes
2013 2014 2015
- 11.6%+ 24.4%- 27.0%- 10.9%
2013 2014 2015
- 6.6% + 9.6%
Supply
Supply Existing Homes
Year-Over-Year
Change New Homes
Year-Over-Year
Change
Nov-2014 4.4 -13.7% 7.0 +18.6%
Dec-2014 3.8 -15.6% 7.1 +16.4%
Jan-2015 3.7 -15.9% 7.0 +11.1%
Feb-2015 3.6 -18.2% 6.7 +4.7%
Mar-2015 3.7 -19.6% 6.3 +1.6%
Apr-2015 3.8 -22.4% 6.0 -6.3%
May-2015 4.0 -21.6% 5.5 -12.7%
Jun-2015 3.9 -22.0% 5.4 -12.9%
Jul-2015 3.9 -23.5% 5.1 -19.0%
Aug-2015 3.6 -29.4% 5.2 -20.0%
Sep-2015 3.3 -34.0% 5.2 -23.5%
Oct-2015 3.2 -33.3% 5.3 -23.2%
12-Month Avg* 4.8 -21.8% 6.4 -5.8%
Historical Supply by Month
The inventory of homes for sale at the end of a given month, divided by the average monthly closed sales from the last 12 months.
* Supply for all properties from November 2014 through October 2015. This is not the average of
the individual figures above.
Current as of November 7, 2015. Report Provided by the Kansas City Regional Association of REALTORS®. All data from Heartland Multiple Listing Service. Powered by 10K Research and Marketing. | 12
5.3
5.8
4.8
6.9
3.2
5.3
Existing Homes New Homes
October
2.0
4.0
6.0
8.0
10.0
12.0
14.0
1-2005 1-2006 1-2007 1-2008 1-2009 1-2010 1-2011 1-2012 1-2013 1-2014 1-2015
Existing Homes New Homes
2013 2014 2015
- 23.2%+ 19.0%- 33.3%- 9.4%
2013 2014 2015
- 17.2% - 6.5%

More Related Content

Viewers also liked

Email Sun to Bouman on William Paul Quick Matters 25 November 2010
Email Sun to Bouman on William Paul Quick Matters 25 November 2010Email Sun to Bouman on William Paul Quick Matters 25 November 2010
Email Sun to Bouman on William Paul Quick Matters 25 November 2010Ray L. Sun
 
Análise - dados colectivos defensivos (Jornada 7)
Análise - dados colectivos defensivos (Jornada 7)Análise - dados colectivos defensivos (Jornada 7)
Análise - dados colectivos defensivos (Jornada 7)Filipe Vieira de Sá
 
Carmen Queiroz - Nenhuma Lágrima
Carmen Queiroz - Nenhuma LágrimaCarmen Queiroz - Nenhuma Lágrima
Carmen Queiroz - Nenhuma LágrimaCarmen Queiroz
 
Mexico timeshare scam
Mexico timeshare scamMexico timeshare scam
Mexico timeshare scamPeggyBryant
 
Social CRM am CRM Forum 2014
Social CRM am CRM Forum 2014Social CRM am CRM Forum 2014
Social CRM am CRM Forum 2014Carpathia AG
 
Steinschaler Nachhaltigkeitsbericht
Steinschaler NachhaltigkeitsberichtSteinschaler Nachhaltigkeitsbericht
Steinschaler NachhaltigkeitsberichtJohann Weiss
 

Viewers also liked (9)

Email Sun to Bouman on William Paul Quick Matters 25 November 2010
Email Sun to Bouman on William Paul Quick Matters 25 November 2010Email Sun to Bouman on William Paul Quick Matters 25 November 2010
Email Sun to Bouman on William Paul Quick Matters 25 November 2010
 
Carhartt
CarharttCarhartt
Carhartt
 
Análise - dados colectivos defensivos (Jornada 7)
Análise - dados colectivos defensivos (Jornada 7)Análise - dados colectivos defensivos (Jornada 7)
Análise - dados colectivos defensivos (Jornada 7)
 
Shopping Reinvented: Next Generation Apparel Retailing
Shopping Reinvented: Next Generation Apparel RetailingShopping Reinvented: Next Generation Apparel Retailing
Shopping Reinvented: Next Generation Apparel Retailing
 
Carmen Queiroz - Nenhuma Lágrima
Carmen Queiroz - Nenhuma LágrimaCarmen Queiroz - Nenhuma Lágrima
Carmen Queiroz - Nenhuma Lágrima
 
Mexico timeshare scam
Mexico timeshare scamMexico timeshare scam
Mexico timeshare scam
 
3) rfidmit oct 2016v5 final (lululemon)
3) rfidmit oct 2016v5 final (lululemon)3) rfidmit oct 2016v5 final (lululemon)
3) rfidmit oct 2016v5 final (lululemon)
 
Social CRM am CRM Forum 2014
Social CRM am CRM Forum 2014Social CRM am CRM Forum 2014
Social CRM am CRM Forum 2014
 
Steinschaler Nachhaltigkeitsbericht
Steinschaler NachhaltigkeitsberichtSteinschaler Nachhaltigkeitsbericht
Steinschaler Nachhaltigkeitsbericht
 

KC-Real-Estate-Market-Stats-October-2015

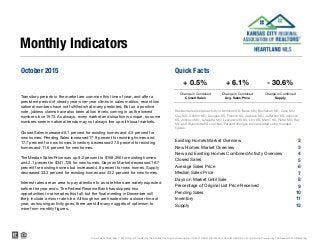
  • 1. October 2015 Quick Facts Change in Combined Change in Combined Closed Sales Avg. Sales Price 2 3 4 5 6 7 8 9 10 11 12 Monthly Indicators + 0.5% + 6.1% - 30.6% Change in Combined Transitory periods in the market are common this time of year, and after a persistent period of steady year-over-year climbs in sales metrics, recent low national numbers have not fulfilled what many predicted. But on a positive note, jobless claims have also been at low levels, coming in as the lowest number since 1973. As always, every market and situation is unique, so some numbers seen in national trends may not always line up with local markets. Closed Sales increased 0.1 percent for existing homes and 4.3 percent for new homes. Pending Sales increased 17.9 percent for existing homes and 17.7 percent for new homes. Inventory decreased 27.0 percent for existing homes and 11.6 percent for new homes. The Median Sales Price was up 9.2 percent to $158,350 for existing homes and 2.1 percent to $341,726 for new homes. Days on Market decreased 16.7 percent for existing homes but increased 4.6 percent for new homes. Supply decreased 33.3 percent for existing homes and 23.2 percent for new homes. Interest rates are an area to pay attention to as rate hikes are widely expected before the year ends. The Federal Reserve Bank has skipped two opportunities to raise rates this fall, but the final meeting in December will likely include a minor rate hike. Although we are headed into a slower time of year, as housing activity goes, there are still many nuggets of optimism to mine from monthly figures. Supply Residental real estate activity in Atchison KS, Bates MO, Buchanan MO, Cass MO, Clay MO, Clinton MO, Douglas KS, Franklin KS, Jackson MO, Jefferson KS, Johnson KS, Johnson MO, Lafayette MO, Leavenworth KS, Linn KS, Miami KS, Platte MO, Ray MO and Wyandotte KS counties. Percent changes are calculated using rounded figures. Existing Homes Market Overview Current as of November 7, 2015. Report Provided by the Kansas City Regional Association of REALTORS®. All data from Heartland Multiple Listing Service. Powered by 10K Research and Marketing. New Homes Market Overview Pending Sales Inventory Supply New and Existing Homes Combined Activity Overview Closed Sales Average Sales Price Median Sales Price Days on Market Until Sale Percentage of Original List Price Received
  • 2. Existing Homes Market Overview Key Metrics Historical Sparkbars 10-2014 10-2015 Percent Change YTD 2014 YTD 2015 Percent Change Key metrics by report month and for year-to-date (YTD) starting from the first of the year. Closed Sales 2,602 2,604 + 0.1% 28,180 + 11.1% Average Sales Price $173,129 $184,478 + 6.6% $176,851 $187,340 + 5.9% 25,366 + 6.7% Days on Market 78 65 - 16.7% 77 68 - 11.7% Median Sales Price $145,000 $158,350 + 9.2% $150,000 $160,000 + 1.2% Pending Sales 2,166 2,553 + 17.9% 26,127 29,797 + 14.0% Pct. of Orig. Price Received 93.0% 94.3% + 1.4% 93.6% 94.7% Current as of November 7, 2015. Report Provided by the Kansas City Regional Association of REALTORS®. All data from Heartland Multiple Listing Service. Powered by 10K Research and Marketing. | 2 -- Supply 4.8 3.2 - 33.3% -- -- -- Inventory 11,682 8,531 - 27.0% -- -- 10-2012 10-2013 10-2014 10-2015 10-2012 10-2013 10-2014 10-2015 10-2012 10-2013 10-2014 10-2015 10-2012 10-2013 10-2014 10-2015 10-2012 10-2013 10-2014 10-2015 10-2012 10-2013 10-2014 10-2015 10-2012 10-2013 10-2014 10-2015 10-2012 10-2013 10-2014 10-2015
  • 3. New Homes Market Overview Key Metrics Historical Sparkbars 10-2014 10-2015 Percent Change YTD 2014 YTD 2015 Percent Change Current as of November 7, 2015. Report Provided by the Kansas City Regional Association of REALTORS®. All data from Heartland Multiple Listing Service. Powered by 10K Research and Marketing. | 3 --Supply 6.9 5.3 - 23.2% -- -- + 24.6% Inventory 1,576 1,393 - 11.6% -- -- -- Pending Sales 192 226 + 17.7% 2,417 3,012 101.1% - 0.6% Days on Market 108 113 + 4.6% 128 147 Pct. of Orig. Price Received 101.8% 101.9% + 0.1% 101.7% $329,900 + 1.8% + 14.8% Median Sales Price $334,846 $341,726 + 2.1% $323,992 2,718 + 17.7% Average Sales Price $361,591 $368,598 + 1.9% $356,293 $359,719 + 1.0% 2,310 Key metrics by report month and for year-to-date (YTD) starting from the first of the year. Closed Sales 258 269 + 4.3% 10-2012 10-2013 10-2014 10-2015 10-2012 10-2013 10-2014 10-2015 10-2012 10-2013 10-2014 10-2015 10-2012 10-2013 10-2014 10-2015 10-2012 10-2013 10-2014 10-2015 10-2012 10-2013 10-2014 10-2015 10-2012 10-2013 10-2014 10-2015 10-2012 10-2013 10-2014 10-2015
  • 4. New and Existing Homes Combined Activity Overview Key Metrics Historical Sparkbars 10-2014 10-2015 Percent Change YTD 2014 YTD 2015 Percent Change Current as of November 7, 2015. Report Provided by the Kansas City Regional Association of REALTORS®. All data from Heartland Multiple Listing Service. Powered by 10K Research and Marketing. | 4 --Supply 4.9 3.4 - 30.6% -- -- + 14.9% Inventory 13,263 9,925 - 25.2% -- -- -- Pending Sales 2,358 2,779 + 17.9% 28,547 32,812 95.2% + 1.0% Days on Market 81 70 - 13.6% 81 75 Pct. of Orig. Price Received 93.8% 95.0% + 1.3% 94.3% $170,000 + 6.3% - 7.4% Median Sales Price $155,000 $170,000 + 9.7% $159,900 30,902 + 11.6% Average Sales Price $190,166 $201,748 + 6.1% $191,856 $202,524 + 5.6% 27,683 Key metrics by report month and for year-to-date (YTD) starting from the first of the year. Closed Sales 2,860 2,874 + 0.5% 10-2012 10-2013 10-2014 10-2015 10-2012 10-2013 10-2014 10-2015 10-2012 10-2013 10-2014 10-2015 10-2012 10-2013 10-2014 10-2015 10-2012 10-2013 10-2014 10-2015 10-2012 10-2013 10-2014 10-2015 10-2012 10-2013 10-2014 10-2015 10-2012 10-2013 10-2014 10-2015
  • 5. Closed Sales Closed Sales Existing Homes Year-Over-Year Change New Homes Year-Over-Year Change Nov-2014 1,983 -0.8% 205 -2.4% Dec-2014 2,155 +3.9% 248 +14.3% Jan-2015 1,604 +1.8% 146 -8.8% Feb-2015 1,773 +6.6% 173 +16.9% Mar-2015 2,581 +21.6% 278 +37.6% Apr-2015 2,903 +15.2% 300 +33.3% May-2015 3,462 +9.6% 359 +29.6% Jun-2015 3,677 +12.0% 329 +19.2% Jul-2015 3,588 +15.6% 325 +15.7% Aug-2015 3,054 +7.5% 293 +9.3% Sep-2015 2,842 +14.0% 244 +13.5% Oct-2015 2,604 +0.1% 269 +4.3% 12-Month Avg 2,686 +9.8% 264 +15.9% Historical Closed Sales by Month Current as of November 7, 2015. Report Provided by the Kansas City Regional Association of REALTORS®. All data from Heartland Multiple Listing Service. Powered by 10K Research and Marketing. | 5 A count of the actual sales that closed in a given month. 2,377 238 2,602 258 2,604 269 Existing Homes New Homes October 0 1,000 2,000 3,000 4,000 1-2004 1-2005 1-2006 1-2007 1-2008 1-2009 1-2010 1-2011 1-2012 1-2013 1-2014 1-2015 Existing Homes New Homes 25,326 2,235 25,366 2,310 28,180 2,718 Existing Homes New Homes Year to Date 2013 2014 2015 + 4.3%+ 8.4%+ 0.1%+ 9.5% + 3.4%+ 11.1%+ 0.2% + 17.7% 2013 2014 2015 2013 2014 2015 2013 2014 2015 + 2.4% + 10.4% + 15.6%+ 20.8%
  • 6. Average Sales Price Avg. Sales Price Existing Homes Year-Over-Year Change New Homes Year-Over-Year Change Nov-2014 $176,835 +4.8% $358,575 +0.9% Dec-2014 $174,116 +1.0% $386,930 +8.9% Jan-2015 $169,065 +7.8% $371,246 +5.4% Feb-2015 $166,197 +9.8% $383,869 +12.2% Mar-2015 $175,567 +9.8% $366,426 +8.0% Apr-2015 $182,834 +4.3% $346,286 +0.4% May-2015 $193,914 +6.0% $337,638 -7.2% Jun-2015 $199,761 +6.2% $355,712 -2.1% Jul-2015 $197,989 +4.2% $361,576 -0.2% Aug-2015 $191,860 +3.4% $346,871 -1.6% Sep-2015 $184,554 +4.0% $382,717 +3.8% Oct-2015 $184,478 +6.6% $368,598 +1.9% 12-Month Avg* $175,987 +5.6% $356,149 +1.6% Historical Average Sales Price by Month Average sales price for all closed sales, not accounting for seller concessions, in a given month. * Avg. Sales Price for all properties from November 2014 through October 2015. This is not the average of the individual figures above. Current as of November 7, 2015. Report Provided by the Kansas City Regional Association of REALTORS®. All data from Heartland Multiple Listing Service. Powered by 10K Research and Marketing. | 6 $166,477 $356,916 $173,129 $361,591 $184,478 $368,598 Existing Homes New Homes October $100,000 $150,000 $200,000 $250,000 $300,000 $350,000 $400,000 1-2004 1-2005 1-2006 1-2007 1-2008 1-2009 1-2010 1-2011 1-2012 1-2013 1-2014 1-2015 Existing Homes New Homes $167,976 $340,953 $176,851 $356,293 $187,340 $359,719 Existing Homes New Homes Year to Date 2013 2014 2015 + 1.9%+ 1.3%+ 6.6%+ 4.0% + 4.5%+ 5.9%+ 5.3% + 1.0% 2013 2014 2015 2013 2014 2015 2013 2014 2015 + 7.1% + 8.4% + 10.1%+ 9.2%
  • 7. Median Sales Price Median Sales Price Existing Homes Year-Over-Year Change New Homes Year-Over-Year Change Nov-2014 $146,000 +5.0% $328,000 +4.2% Dec-2014 $147,000 +5.5% $345,712 +8.3% Jan-2015 $139,000 +5.3% $327,911 +2.2% Feb-2015 $139,075 +8.7% $344,950 +8.6% Mar-2015 $150,500 +11.5% $331,000 +4.7% Apr-2015 $159,900 +8.4% $322,825 +3.4% May-2015 $169,900 +9.6% $304,850 -3.5% Jun-2015 $170,000 +6.3% $333,886 -0.2% Jul-2015 $168,000 +5.0% $329,950 +0.0% Aug-2015 $165,000 +6.5% $328,516 +1.2% Sep-2015 $155,000 +3.3% $333,256 +0.4% Oct-2015 $158,350 +9.2% $341,726 +2.1% 12-Month Avg* $148,500 +6.4% $321,450 +2.7% Historical Median Sales Price by Month Point at which half of the sales sold for more and half sold for less, not accounting for seller concessions, in a given month. * Median Sales Price for all properties from November 2014 through October 2015. This is not the average of the individual figures above. Current as of November 7, 2015. Report Provided by the Kansas City Regional Association of REALTORS®. All data from Heartland Multiple Listing Service. Powered by 10K Research and Marketing. | 7 $140,000 $311,987 $145,000 $334,846 $158,350 $341,726 Existing Homes New Homes October $100,000 $150,000 $200,000 $250,000 $300,000 $350,000 1-2004 1-2005 1-2006 1-2007 1-2008 1-2009 1-2010 1-2011 1-2012 1-2013 1-2014 1-2015 Existing Homes New Homes $142,500 $310,000 $150,000 $323,992 $160,000 $329,900 Existing Homes New Homes Year to Date 2013 2014 2015 + 2.1%+ 7.3%+ 9.2%+ 3.6% + 4.5%+ 6.7%+ 5.3% + 1.8% 2013 2014 2015 2013 2014 2015 2013 2014 2015 + 6.1% + 8.0% + 10.7%+ 2.7%
  • 8. Days on Market Until Sale Days on Market Existing Homes Year-Over-Year Change New Homes Year-Over-Year Change Nov-2014 75 -8.5% 106 +34.2% Dec-2014 82 0.0% 108 +9.1% Jan-2015 87 -1.1% 126 +22.3% Feb-2015 90 -1.1% 149 +30.7% Mar-2015 82 -6.8% 169 +45.7% Apr-2015 71 -7.8% 148 +5.0% May-2015 60 -22.1% 164 +15.5% Jun-2015 60 -14.3% 153 -1.3% Jul-2015 60 -13.0% 158 +9.0% Aug-2015 61 -17.6% 141 +23.7% Sep-2015 64 -12.3% 125 +6.8% Oct-2015 65 -16.7% 113 +4.6% 12-Month Avg* 78 -11.1% 122 +16.0% Historical Days on Market Until Sale by Month Average number of days between when a property is listed and when an offer is accepted in a given month. * Days on Market for all properties from November 2014 through October 2015. This is not the average of the individual figures above. Current as of November 7, 2015. Report Provided by the Kansas City Regional Association of REALTORS®. All data from Heartland Multiple Listing Service. Powered by 10K Research and Marketing. | 8 76 84 78 108 65 113 Existing Homes New Homes October 50 75 100 125 150 175 200 225 1-2004 1-2005 1-2006 1-2007 1-2008 1-2009 1-2010 1-2011 1-2012 1-2013 1-2014 1-2015 Existing Homes New Homes 81 120 77 128 68 147 Existing Homes New Homes Year to Date 2013 2014 2015 + 4.6%+ 28.6%- 16.7%+ 2.6% + 6.7%- 11.7%- 4.9% + 14.8% 2013 2014 2015 2013 2014 2015 2013 2014 2015 - 14.6% - 13.8% - 16.7%- 35.4%
  • 9. Percentage of Original List Price Received Pct. of Orig. Price Received Existing Homes Year-Over-Year Change New Homes Year-Over-Year Change Nov-2014 93.1% +0.5% 102.0% +0.3% Dec-2014 92.4% +0.5% 101.8% -0.1% Jan-2015 92.1% +0.3% 100.5% -2.1% Feb-2015 92.6% +1.5% 100.4% -0.8% Mar-2015 93.8% +1.2% 100.8% -1.1% Apr-2015 95.1% +1.1% 101.2% -0.5% May-2015 95.7% +1.5% 101.3% -0.1% Jun-2015 95.7% +1.2% 101.1% -1.0% Jul-2015 95.3% +1.0% 101.3% -0.3% Aug-2015 95.0% +1.3% 101.6% +0.3% Sep-2015 94.5% +1.2% 100.7% -1.2% Oct-2015 94.3% +1.4% 101.9% +0.1% 12-Month Avg* 93.4% +1.1% 101.8% -0.5% Historical Percentage of Original List Price Received by Month Percentage found when dividing a property’s sales price by its original list price, then taking the average for all properties sold in a given month, not accounting for seller concessions. * Pct. of Orig. Price Received for all properties from November 2014 through October 2015. This is not the average of the individual figures above. Current as of November 7, 2015. Report Provided by the Kansas City Regional Association of REALTORS®. All data from Heartland Multiple Listing Service. Powered by 10K Research and Marketing. | 9 92.5% 102.1% 93.0% 101.8% 94.3% 101.9% Existing Homes New Homes October 85.0% 90.0% 95.0% 100.0% 105.0% 1-2004 1-2005 1-2006 1-2007 1-2008 1-2009 1-2010 1-2011 1-2012 1-2013 1-2014 1-2015 Existing Homes New Homes 93.1% 101.7% 93.6% 101.7% 94.7% 101.1% Existing Homes New Homes Year to Date 2013 2014 2015 + 0.1%- 0.3%+ 1.4%+ 0.5% 0.0%+ 1.2%+ 0.5% - 0.6% 2013 2014 2015 2013 2014 2015 2013 2014 2015 + 1.3% + 2.2% + 1.8%+ 1.1%
  • 10. Pending Sales Pending Sales Existing Homes Year-Over-Year Change New Homes Year-Over-Year Change Nov-2014 1,858 +6.1% 182 +21.3% Dec-2014 1,654 +14.5% 170 +7.6% Jan-2015 2,221 +9.6% 268 +31.4% Feb-2015 2,591 +26.5% 285 +43.9% Mar-2015 3,327 +15.2% 371 +22.4% Apr-2015 3,675 +16.9% 416 +35.5% May-2015 3,385 +4.1% 360 +35.8% Jun-2015 3,320 +10.4% 293 +3.9% Jul-2015 3,128 +13.9% 304 +17.4% Aug-2015 3,013 +17.3% 273 +33.2% Sep-2015 2,734 +20.1% 204 +1.0% Oct-2015 2,553 +17.9% 226 +17.7% 12-Month Avg 2,788 +13.6% 279 +23.4% Historical Pending Sales by Month A count of the properties on which offers have been accepted in a given month. Current as of November 7, 2015. Report Provided by the Kansas City Regional Association of REALTORS®. All data from Heartland Multiple Listing Service. Powered by 10K Research and Marketing. | 10 2,152 188 2,166 192 2,553 226 Existing Homes New Homes October $0 $1,000 $2,000 $3,000 $4,000 1-2004 1-2005 1-2006 1-2007 1-2008 1-2009 1-2010 1-2011 1-2012 1-2013 1-2014 1-2015 Existing Homes New Homes 25,963 2,400 26,127 2,417 29,797 3,012 Existing Homes New Homes Year to Date 2013 2014 2015 + 17.7%+ 2.1%+ 17.9%+ 0.7% + 0.7%+ 14.0%+ 0.6% + 24.6% 2013 2014 2015 2013 2014 2015 2013 2014 2015 - 4.1% + 8.5% + 7.4%- 11.7%
  • 11. Inventory Inventory Existing Homes Year-Over-Year Change New Homes Year-Over-Year Change Nov-2014 10,705 -13.8% 1,605 +22.2% Dec-2014 9,415 -14.1% 1,628 +21.1% Jan-2015 9,184 -14.6% 1,604 +14.9% Feb-2015 8,999 -16.1% 1,547 +9.8% Mar-2015 9,262 -17.1% 1,494 +8.6% Apr-2015 9,694 -18.5% 1,455 +3.0% May-2015 10,138 -17.7% 1,388 -0.4% Jun-2015 10,180 -17.3% 1,365 -1.9% Jul-2015 10,185 -18.5% 1,330 -5.5% Aug-2015 9,598 -22.2% 1,346 -8.1% Sep-2015 8,738 -28.0% 1,369 -10.5% Oct-2015 8,531 -27.0% 1,393 -11.6% 12-Month Avg* 9,552 -18.2% 1,460 +3.2% Historical Inventory by Month The number of properties available for sale in active status at the end of a given month. * Inventory for all properties from November 2014 through October 2015. This is not the average of the individual figures above. Current as of November 7, 2015. Report Provided by the Kansas City Regional Association of REALTORS®. All data from Heartland Multiple Listing Service. Powered by 10K Research and Marketing. | 11 13,112 1,267 11,682 1,576 8,531 1,393 Existing Homes New Homes October 0 5,000 10,000 15,000 20,000 25,000 1-2004 1-2005 1-2006 1-2007 1-2008 1-2009 1-2010 1-2011 1-2012 1-2013 1-2014 1-2015 Existing Homes New Homes 2013 2014 2015 - 11.6%+ 24.4%- 27.0%- 10.9% 2013 2014 2015 - 6.6% + 9.6%
  • 12. Supply Supply Existing Homes Year-Over-Year Change New Homes Year-Over-Year Change Nov-2014 4.4 -13.7% 7.0 +18.6% Dec-2014 3.8 -15.6% 7.1 +16.4% Jan-2015 3.7 -15.9% 7.0 +11.1% Feb-2015 3.6 -18.2% 6.7 +4.7% Mar-2015 3.7 -19.6% 6.3 +1.6% Apr-2015 3.8 -22.4% 6.0 -6.3% May-2015 4.0 -21.6% 5.5 -12.7% Jun-2015 3.9 -22.0% 5.4 -12.9% Jul-2015 3.9 -23.5% 5.1 -19.0% Aug-2015 3.6 -29.4% 5.2 -20.0% Sep-2015 3.3 -34.0% 5.2 -23.5% Oct-2015 3.2 -33.3% 5.3 -23.2% 12-Month Avg* 4.8 -21.8% 6.4 -5.8% Historical Supply by Month The inventory of homes for sale at the end of a given month, divided by the average monthly closed sales from the last 12 months. * Supply for all properties from November 2014 through October 2015. This is not the average of the individual figures above. Current as of November 7, 2015. Report Provided by the Kansas City Regional Association of REALTORS®. All data from Heartland Multiple Listing Service. Powered by 10K Research and Marketing. | 12 5.3 5.8 4.8 6.9 3.2 5.3 Existing Homes New Homes October 2.0 4.0 6.0 8.0 10.0 12.0 14.0 1-2005 1-2006 1-2007 1-2008 1-2009 1-2010 1-2011 1-2012 1-2013 1-2014 1-2015 Existing Homes New Homes 2013 2014 2015 - 23.2%+ 19.0%- 33.3%- 9.4% 2013 2014 2015 - 17.2% - 6.5%