L-USE Key Monitoring Indicators for Spring Apps
•
0 likes•310 views

This document discusses key monitoring indicators for Spring apps, including latency, utilization, saturation, and errors (L-USE). It recommends alerting when indicators reach their maximum and performance tuning to the 99th percentile (P99). Automated canary analysis is done using Kayenta. Latency is often 35-40x worse than P99 in many apps. The demonstration setup involves monitoring memory saturation using GC metrics to keep the promoted memory under 30% of the allocated memory.

Recommended
Recommended
More Related Content
More from VMware Tanzu
More from VMware Tanzu (20)
Recently uploaded
Recently uploaded (20)
L-USE Key Monitoring Indicators for Spring Apps
- 1. Key Monitoring Indicators for Spring Apps Jon Schneider (@jon_k_schneider)
- 2. Goldilocks wouldn’t like our telemetry.
- 3. L-USE: Latency, Utilization, Saturation, Errors
- 4. Alert to max, performance tune to P99
- 5. Automated canary analysis is encapsulated by Kayenta
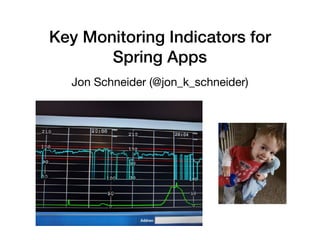
- 6. Max ~35-40x worse than P99 in many apps.
- 7. Latency
- 8. Our demonstration setup involves a few pieces