Improve sustainability through energy insights
•
0 likes•62 views

The Dell OpenManage Enterprise Power Manager 3.0 plug-in provides sustainability insights through automated data collection and reporting. It tracks power usage metrics, identifies idle servers, estimates carbon emissions, and detects devices exceeding power thresholds - helping optimize infrastructure utilization and reduce energy costs and carbon footprint. The plug-in interfaces all functionality through a single console for improved visibility and workload management.

Recommended
Recommended
More Related Content
Similar to Improve sustainability through energy insights
Similar to Improve sustainability through energy insights (20)
More from Principled Technologies
More from Principled Technologies (20)
Recently uploaded
Recently uploaded (20)
Improve sustainability through energy insights
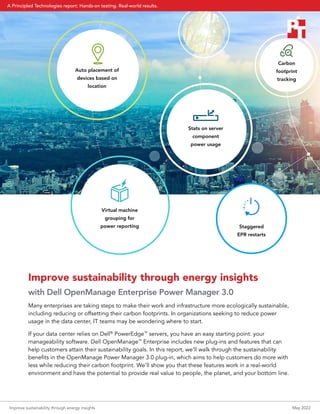
- 1. Staggered EPR restarts Stats on server component power usage Carbon footprint tracking Auto placement of devices based on location Virtual machine grouping for power reporting Improve sustainability through energy insights with Dell OpenManage Enterprise Power Manager 3.0 Many enterprises are taking steps to make their work and infrastructure more ecologically sustainable, including reducing or offsetting their carbon footprints. In organizations seeking to reduce power usage in the data center, IT teams may be wondering where to start. If your data center relies on Dell® PowerEdge™ servers, you have an easy starting point: your manageability software. Dell OpenManage™ Enterprise includes new plug-ins and features that can help customers attain their sustainability goals. In this report, we’ll walk through the sustainability benefits in the OpenManage Power Manager 3.0 plug-in, which aims to help customers do more with less while reducing their carbon footprint. We’ll show you that these features work in a real-world environment and have the potential to provide real value to people, the planet, and your bottom line. Improve sustainability through energy insights May 2022 A Principled Technologies report: Hands-on testing. Real-world results.
- 2. What we evaluated Dell Technologies asked our engineers to try out the new Power Manager 3.0 plug-in and provide feedback on real-world usability. We tested the following features: • Auto placement of devices based on location • Reporting of virtual machines (VMs) associated with a device • Reporting of server utilization metrics • Reporting of server component power metrics • Reporting of greenhouse gas (GHG) emissions (for servers, racks, and groups) • Power policy audit (for devices and groups) For this evaluation, we installed the Power Manager 3.0 plug-in on an OpenManage Enterprise console and actively monitored the power consumption and other metrics on four Dell PowerEdge servers over 14 days. (The servers were a mix of current-gen and previous-gen; see the science behind the report for more details.) On the following pages, you’ll see screenshots from our hands-on evaluation and learn how these sustainability features can help you get the most out of IT and your servers while reducing your carbon footprint. The challenge Many companies are eager to put sustainability actions in place that will aid in the fight against global warming. But for IT, that’s easier said than done. Data centers have significant power needs for normal operations. According to the Climate Neutral Group, “data centers consume about 3 percent of the global electric supply and account for about 2 percent of total GHG emissions. That’s about as much as the entire airline industry.”1 If your organization is working toward sustainability goals, it’s clear that the data center is one area ripe for optimization— but what tools exist to help? Managing a data center is difficult enough already. We found that through Dell OpenManage Enterprise Power Manager 3.0 features, we could collect server utilization metrics (CPU, I/O, memory bandwidth, and system usage) automatically as well as location information and power consumption data that can provide carbon footprint estimates. The plug-in also provided ways to organize this data into reports and dashboards, which IT staff can use to identify physical and virtual resources that consume high amounts of energy or underutilized power resources. Read on to see how the Power Manager 3.0 plug- in has the potential to help companies improve sustainability through energy insights. Dell Technologies’ commitment to sustainability “We have a responsibility to protect and enrich our planet together with our customers, suppliers and communities. It is a core part of our business and we embed sustainability and ethical practices into all that we do, being accountable for our actions while driving improvements wherever and whenever possible.”2 Improve sustainability through energy insights May 2022 | 2
- 3. People: Retain performance The work of reducing data center power consumption typically starts with figuring out how much power you’re consuming currently. In the past, this may have required manually gathering and recording power consumption results on a spreadsheet over a predetermined time— say six months. Only then could IT figure out how to use the data. While data center managers can now figure this out without leaving their desks, it’s a very man-hour intensive process that requires daily data collection from each individual server. The value of performance advisor charts and reports The Power Manager 3.0 landing page allows IT to view, measure, and control server power consumption of devices, racks, and groups. They can also use the zoom feature for a closer look at the power and thermal data points on each device, rack, or group. In one Group Power History (Watt) example (Figure 1), we were able to dial in the power history duration of our test group. We were also able to hover over the timeline for an in-depth look at the maximum, average, and minimum stats for our test group. You can see by the plot points that we set up Power Manager 3.0 to automatically gather information every 15 minutes. Figure 1: Power Manager 3.0 Group Power History screenshot. Source: Principled Technologies. Maximize uptime and control energy use from a single console According to Dell, OpenManage Enterprise Power Manager 3.0 enables data center managers to monitor and budget server power consumption, mitigate risks from power and cooling events, use the full capacity of rack and power infrastructure, and set policy-based controls remotely.3 Improve sustainability through energy insights May 2022 | 3
- 4. It’s worth noting that the energy use, cost, and carbon emissions didn’t change for the group we monitored. We were, however, able to view energy use, costs, and carbon emission metrics by drilling down on an individual device under the Power Management and Monitoring tab. In this Metrics and Monitoring History example (Figure 2), as with all other performance advisor reports and charts we examined, Power Manager allowed us to change the duration of monitoring history. In this example, the duration pull-down menu included 6-hour, 12-hour, 1-day, 7-day, 1-month, 3-month, 6-month, and 1-year monitoring history views. We were also able to hover over the timeline for an in-depth look at the maximum, average, minimum, and power cap stats for our individual device. Figure 2: Metrics and Monitoring History tab screenshot under the Power Manager 3.0 Power Management and Monitoring header. Source: Principled Technologies. This level of at-your-fingertips detail has the potential to help IT balance server loads for the highest level of performance, optimize and plan for capacity, avoid overloads, and accurately allocate power usage—all from a single OpenManage Enterprise console. This automation of time and energy-consuming tasks, in turn, can make room for other sustainability initiatives. Improve sustainability through energy insights May 2022 | 4
- 5. The value of VM grouping for power reporting More and more consumers are seeking sustainably produced goods. Per one 2021 report, “Google searches [in the U.S.] for sustainable products grew by an astounding 450% between 2016 and 2018.”4 Simultaneously, consumers are demanding instant gratification, putting pressure on organizations to keep their data centers running optimally. This makes the balance of sustainability and performance more fraught than ever. A new feature in Power Manager 3.0 is VM grouping for power reporting. This automation gathers the power history for VM groups. We were able to select one of the VMs on the VM group list and view the metrics for that device. This feature provides data center managers with maximum and optimal VM power consumption metrics and allows admins to view idle servers. In this Power History tab (Figure 3), we were able to create, monitor, edit, and delete VM groups. Figure 3: Individual VM power reporting metrics screenshot from the All Virtual Machines list under the Power Manager 3.0 header. Source: Principled Technologies. Another new Power Manager 3.0 feature is the auto placement of devices based on location. With this feature, the data center manager puts a server’s tags into the iDRAC system details and then inventories the system. OpenManage Enterprise pulls in that information and auto-populates the associated rack view. But what happens if you accidentally record two servers in the same rack and slot? We found that the Power Manager 3.0 plug-in will detect this conflict and ask the data center manager to resolve it. Improve sustainability through energy insights May 2022 | 5
- 6. Planet: Reduce carbon emissions You don’t need to raze your existing data center infrastructure to the ground and start from scratch to prioritize sustainability. The automations within the Power Manager 3.0 plug-in make it easier than ever to do your part—however that looks to you and your business. The value of automated carbon footprint tracking We found that Power Manager 3.0 offered several ways to tackle carbon footprint tracking. In our evaluation, we found that organizations could use the Power Manager 3.0 plug-in to view energy, cost, and carbon dioxide emissions associated with an individual data center device, the facility, and even overhead, which is a calculated value of the lighting, cooling, and other energy consumption associated with your facility - based on your power usage effectiveness (PUE). You can find out more about determining your own data center’s PUE by visiting https://datacenters.lbl.gov/. We’ll show you how to change the OME default settings to customize your views based on your own environmental inputs in a later section. Figure 4: Carbon emissions information screenshot from the Metrics and Monitoring History tab under the Power Manager 3.0 Power Management and Monitoring header. Source: Principled Technologies. How carbon emission tracking works within the GUI Power Manager 3.0 provides an Emission Conversion Factor. With this feature, data center managers can use the default values to approximate carbon dioxide emission levels based on energy consumed, or customize values based on local energy models and set a factor to determine the carbon dioxide emission levels per unit of energy consumed. If you’re wondering what electricity usage look like in your area, type in your city and state for electricity information and resources that include your local electricity rates and statistics: https://www.electricitylocal.com/. Improve sustainability through energy insights May 2022 | 6
- 7. The value of automated energy consumption tracking One way to monitor a device’s carbon footprint over time is through energy consumption costs. On April 26, 2022, when we took the screenshot in Figure 5, the local electricity rate in Durham, NC, the site of our test data center, was $0.0796/kWh. Figure 5: Energy Consumption Cost metrics screenshot from the Metrics and Monitoring History tab under the Power Manager 3.0 Power Management and Monitoring header. Source: Principled Technologies. Improve sustainability through energy insights May 2022 | 7
- 8. The value of energy consumption capping Setting power caps is another way to minimize GHG emissions. Power Manager 3.0 empowers data center managers to set up policies within the plug-in. These customized policies generate alerts for devices and groups that approach power cap thresholds (Figure 6). Figure 6: Alert Threshold metrics tab screenshot under the Power Manager 3.0 Power Management and Monitoring header. Source: Principled Technologies. Improve sustainability through energy insights May 2022 | 8
- 9. In this view of rack energy consumption (Figure 7), you’ll notice that one of the devices on the underlying screen is sending an alert. A data center manager can quickly jump to that device’s metrics and determine the best solution. Figure 7: Energy Consumption Cost metrics screenshot from the Metrics and Monitoring History tab under the Power Manager 3.0 Power Management and Monitoring header. Source: Principled Technologies. Improve sustainability through energy insights May 2022 | 9
- 10. The value of staggered emergency responses Another strategy to minimize GHG emissions is to shut down non-mission-critical devices during an emergency power reduction (EPR) and stagger the return of power to these devices when the EPR is disabled. During power emergencies, many companies rely on fossil fuel-powered generators to provide backup power. By automatically shutting down or throttling non-mission-critical devices with a forced EPR, organizations can reduce the amount of fossil fuels they use in emergency situations. Similarly, staggering those devices’ return to service helps minimize the spikes associated with initial return to full service. Figure 8 shows a Temperature-Triggered EPR policy applied (manually). Figure 8: Policies and EPR metrics tab screenshot under the Power Manager 3.0 Power Management and Monitoring header. Source: Principled Technologies. Improve sustainability through energy insights May 2022 | 10
- 11. The value of automated server usage metrics The Power Manager 3.0 plug-in allowed us to view new metrics of PowerEdge servers, easily identify idle servers, and analyze and compare server utilization metrics (CPU, I/O, memory bandwidth, and system usage) of devices (Figure 9). We could also view the Top 10 Power Offenders and the Top 10 Temperature Offenders. Our engineer’s takeaway from this screenshot (Figure 9) was that all of these systems were massively underutilized. The beauty of the Analyze Usage Metric report is that someone could see this and think, “I can probably consolidate these workloads to two servers and still have plenty of room for more.” Figure 9: Analyze Usage Metrics tab screenshot on the Power Manager 3.0 main screen. Source: Principled Technologies. Improve sustainability through energy insights May 2022 | 11
- 12. Profits: Optimize infrastructure How do companies ensure that sustainable actions lead to meaningful outcomes without jeopardizing their bottom lines? In this instance, the answer is visibility, agility, and infrastructure optimization. All of the charts and reports that we highlighted in previous sections serve double duty, displaying data that can assist with workload management, performance optimization, and more. While Dell OME provides default inputs for approximations of your datacenter metrics, you can customize the inputs OME uses to provide a more accurate picture of the power consumption, costs, and emissions for your specific environment. Figure 10: Edit Power Manager Preferences screenshot on the Power Manager 3.0 settings screen. Source: Principled Technologies. Energy cost calculator The Power Manager 3.0 plug-in enables data center managers to input their local energy cost per kilowatt/ hour (kWh), set a power usage effectiveness value, and enter their carbon emission conversion factor to calculate the cost per unit for devices managed and monitored through the OME console. This feature gives organizations the ability to view (by group, server, or specific component) a more accurate energy cost model in their data center environment (Figure 10). When coupled with the Power Manager 3.0 server utilization metrics, these tools can guide consolidation efforts to reduce unused server overhead and allow for the reduction of physical servers, which in turn reduces both energy- and carbon-related costs. Improve sustainability through energy insights May 2022 | 12
- 13. Finding and reassigning power zombies According to CentricsIT, “A server is considered ‘zombie’ or ‘comatose’ after six months of inactivity—meaning that it has not delivered any information or computed services.”5 We found that the Power Manager 3.0 plug-in automatically collected power consumption data as well as CPU, I/O, and power usage metrics. Then, to make tracking power zombies en masse as easy as shooting fish in a barrel, the Power Manager 3.0 plug-in reported “idle servers” (a.k.a. power zombies) on the main screen. Under the Idle Servers pane, we found panes with information on the Top 10 Power Offenders and the Top 10 Temperature Offenders. With this data in hand, data center managers can choose to give these idle servers something useful to do or decommission them. Quickly and easily finding under- performing servers allows companies to better use existing resources, make room for upgrades, and commit valuable employee time to other growth- or sustainability-related projects. Opportunities to reduce energy • Isolate hot and cold aisles • Consolidate or upgrade servers • Switch to high-efficiency power • Monitor power use Improve sustainability through energy insights May 2022 | 13
- 14. Conclusion With the Dell OpenManage Enterprise Power Manager 3.0 plug-in, we found that data center managers are privy to end-to-end data center insights. These automated insights and reports provide useful information that can enable them to respond quickly to power issues, improve overall power usage, and track GHG emissions. 1. Climate Neutral Group, “Carbon emissions of data usage increasing, but what is yours?” accessed April 19, 2022, https://www.climateneutralgroup.com/en/news/carbon-emissions-of-data-centers/. 2. Dell Technologies, “At the heart of everything we do,” accessed April 18, 2022, https://www.dell.com/en-us/dt/corporate/social-impact/advancing-sustainability.htm. 3. Dell Technologies, “Dell EMC OpenManage Enterprise Power Manager,” accessed April 19, 2022, https://www.dell.com/en-ca/dt/solutions/openmanage/power-management.htm. 4. WWF, “The Eco-Wakening,” accessed April 27, 2022, https://explore.panda.org/eco-wakening. 5. CentricsIT, “Gartner Says There are Ghosts and Zombies in Your Data Center!” accessed April 25, 2022, https://www.centricsit.com/gartner-says-there-are-ghosts-and-zombies-in-your-data-center/. Principled Technologies is a registered trademark of Principled Technologies, Inc. All other product names are the trademarks of their respective owners. For additional information, review the science behind this report. Principled Technologies® Facts matter.® Principled Technologies® Facts matter.® This project was commissioned by Dell Technologies. Read the science behind this report at https://facts.pt/2GVsDIv Improve sustainability through energy insights May 2022 | 14