
Recommended
More Related Content
What's hot
What's hot (20)
Similar to Visual field analysis--interpretation
Similar to Visual field analysis--interpretation (20)
Recently uploaded
Recently uploaded (20)
Visual field analysis--interpretation
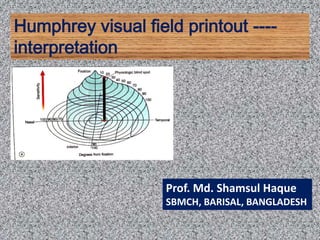
- 1. Humphrey visual field printout ---- interpretation Prof. Md. Shamsul Haque SBMCH, BARISAL, BANGLADESH
- 2. Retinal nerve fibre arrangement Nerve fibres arrangement at optic disc
- 4. What is visual field ?
- 5. Aims of today,s topic Will be able • to identify field defect • to recognize that field defect is due to glaucoma or neurological lesion •to know that field defect is progressive or not
- 6. What is perimetry ? Bjerrum,s screen Lister octopus Humphrey Goldmann
- 7. Types of perimetry a. Kinetic…stimulus moves confrontation, lister, tangen screen, Goldmann b. Static …stimulus does not moves HVFA, OCTOPUS 1970………OCTOPUS, Unpopular 1984………HUMPHREY, Popular
- 8. Advantages of Goldmann perimetry Low vision patient Neurological patient Peripheral field to be evaluated Malinger patients
- 9. Difference between kinetic and static perimetry Static Kinetic 1.VFD detect earlier with 1. Detect when 40% damage 20% defect 2. Area fixed but stimulus 2. Intensity is fixed but varies in intensity stimulus moves from non-seeing to seeing area 3. Three dimensional 3. Two dimensional 4. Computerized 4. Not computerized 5. Threshold type 5. Non threshold type 6. Less error 6. More error 7. Both glaucoma and 7. Good for neurological neurological
- 11. Apostilbs(asb) and Decibels(dB) relationship
- 13. Aposilbs, Decibels , Retinal sensitivity relation
- 14. Humphrey visual field test, Classification Two types– on the basis of strategies 1. Threshold test—using threshold stimulus for diagnosis of glaucoma and neurological lesions 2. Screening test– using suprathreshold stimulus for detection of glaucoma
- 15. 1.Threshold test—is of three types a.Central tests b.Peripheral tests c.Special tests central 30-2 peripheral 60-4 neurological -20 central 24-2 nasal step neurological –30 central 10- 2 macular program
- 16. Central 30- 2 threshold test pattern •No of test points –76 •Point density is 6° (distance between the two points) •Bare area(non-testing area) is 3° from the fixation point •Extension of testing area from the fixation point is 30° NB: one eye is tested at a time, other eye is occluded Fixation should be steady and monitor throughout the test
- 17. Central 24-2 threshold test pattern •No. of test points---54 •Point density is 6° (distance between two points is 6°) •Bare area (non-seeing area) is 3° from the fixation point •Extension of testing area from fixation point is 24°
- 18. Central 10-2 threshold pattern •No. of points----68 •Point density is 2°(distance between two points is 2°) •Bare area(non-seeing area) is 1° from the fixation point •Extension of testing area from the fixation point is 10°
- 19. Macular program •No. of teat point is 16 •Point density is 2°(distance between two points is 2°) •Bare area (non-seeing area) is 1° from the fixation point •Extension of testing area from the fixation point is 5°
- 20. Why we select 30-2/24-2/10-2 central threshold test pattern instead of 30-1/24-1/10-1 -* Central 30-2 •No. of test points is 76 •Testing points are away from vertical and horizontal axes •Bare area is 3° from the fixation point Central 30-1 •No. of test points is 71 •Testing points fall upon the vertical and horizontal axes •Bare area is 6° from the fixation point
- 21. Threshold testing strategies Threshold testing strategies is of two types 1.Old standard strategies – full threshold strategies/standard threshold strategies 2. Newer threshold trategies a. FAST PAC b. SITA standard c. SITA fast SITA– Swedish Interactive Threshold Algorithm
- 22. Humphrey visual field test printout(single field)----interpretation We can divide the printout into 8 zones Zone—1, Patients data and test data Zone—2, Foveal threshold and reliable indices Zone—3, Gray scale Zone—4. Patients raw data Zone—5, Total deviation plot Zone– 6, Pattern deviation plot Zone—7, Global indices Zone—8, Glaucoma hemifield test Zone—9, Eye tracking(±)
- 23. Identify 8 zones of the Humphrey printout
- 24. Zone—1, Patients data and test data
- 25. Zone—2 ,Foveal threshold and reliable indices
- 26. Zone—3, Gray scale •RP •PRP •Peripheral retinal degeneration •Retinoschiasis •Aphakic glass
- 27. Zone—4, Patients raw data
- 28. Zone –5, total deviation plot,has two components A. Total deviation numerical plot(TDNP) B. Total deviation probability plot(TDPP) A B
- 29. Zone –6, pattern deviation plot,has two components A.Pattern deviation numerical plot(PDNP) B. Pattern deviation probability plot(PDPP) A B •Mild to moderate generalized depression are eliminated •Deep focal deviations are height lighted •Machine adjusts these values and the new resultant values are displayed as symbolic form in PDPP Factors influencing the pattern deviation plot are •Hazy media •Miotic pupil
- 30. Zone—7, Global indices MD—mean deviation • Indicate average severity of the field loss • Expressed in decibel(Db) value •Machine analyses and calculates how often these values are seen in general population, if the value is positive it indicates pt,s score is better than normal person of the same age PSD—Pattern Standard Deviation •This is a measure of focal loss or variability within the field •If score is high, damage is more
- 31. Zone—8, Glaucoma hemifield test(GHT) GHT GHT→ Glaucoma Hemifield Test Compare mirror image locations of superior and inferior retina and gives five comments 1. GHT—outside normal limit ,if difference found in 1% population 2. GHT—borderline , if difference found in up to 3% population 3. GHT—abnormally low sensitive, best sensitive part is seen in less than 5% of the population 4. GHT—abnormally high sensitive, best sensitive part is seen is more that found in 99.5% population 5. GHT—within normal limit, when none of the above 4 conditions are seen
- 32. Zone –9, Eye tracking
- 33. SWAP→ Short Wave length Automated Perimetry When and why SWAP strategies is done •Done to detect very early glaucomatous damage •Background colour of the machine bowl is yellow –which desensitize the red and green cones •Colour of the stimulus is blue which activates the blue cones only
- 34. Frequency doubling technology(FDT) •This is a latest machine •It utilizes latest technology •Machine is upto 97% sensitive to detect glaucomatous defect
- 35. Visual field defects •Generalized depression→ both central and peripheral fields are depressed as in cataract •Peripheral depression → only peripheral field is depressed as in RP •Temporal contraction → only temporal field is depressed as in aging people (Depression means reduced sensitivity of the retina) Scotomas → non-seeing area of the visual field Types: •Absolute •Relative •Positive •Negative
- 36. Cont. •Hemifield defect •Altitudinal field defect •Central scotom •Paracentral scotoma •Centro-cecal scotoma •Arcuate scotoma •Nasal step •Ring scotoma •Macular splitting •Bjerrum scotoma/siedel,s sign/siedel scotoma •Baring of the blind spot
- 39. Octopus printout
- 40. Dense superior scotoma originate From BS, joins superior arcuate scotoma and finally joins the superior nasal step
- 41. By examining the gray scale and pattern probability plots of Right eye and Left eye , it is evident that this is a case of POAG . Right eye has tubular vision and Left eye has a bit more central vision than the right eye
- 42. Bitemporal hemianopia : Lesion is situated at the chaisma which damage the crossing nasal fibres of both optic nerves
- 43. Lesion : acute ischaemia in the frontal and parietal lobes affecting the superior fibres of the left optic radiation causing right inferior homonymous quardrantanopia , lesion is confirmed by MRI/MRA Pie in the floor
- 44. Pie in the sky Lesion: in the frontal and parietal lobes affecting the lower fibres of the right optic radiation causing left homonymous superior quadrantanopia –should be confirmed by MRI/MRA
- 45. Field of left eye Superior altitudinal field defect (L/E) Causes •AION • Optic neuritis • Hemiretinal vein occlusion •Hemiretinal artery occlusion •Optic nerve coloboma •Glaucoma
- 46. Left homonymous hemianopia Lesion: in the right temporo-parietal region affecting the right optic radiation MRI shows haematoma of the right temporo-parietal region