Weekly Market Report April 10, 2016
•
0 likes•256 views

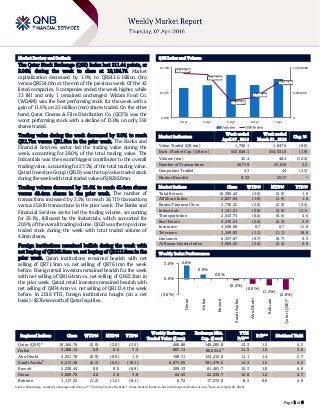
The Qatar Stock Exchange (QSE) Index lost 211.44 points, or 2.04% during the week to close at 10,164.76.

Recommended
Recommended
More Related Content
Viewers also liked
Viewers also liked (9)
More from QNB Group
More from QNB Group (20)
Recently uploaded
Recently uploaded (20)
Weekly Market Report April 10, 2016
- 1. ` Page 1 of 6 Market Review and Outlook QSE Index and Volume The Qatar Stock Exchange (QSE) Index lost 211.44 points, or 2.04% during the week to close at 10,164.76. Market capitalization decreased by 1.9% to QR543.6 billion (bn) versus QR554.0bn at the end of the previous week. Of the 43 listed companies, 9 companies ended the week higher, while 33 fell and only 1 remained unchanged. Widam Food Co. (WDAM) was the best performing stock for the week with a gain of 11.6% on 2.5 million (mn) shares traded. On the other hand, Qatar Cinema & Film Distribution Co. (QCFS) was the worst performing stock with a decline of 13.6% on only 392 shares traded. Trading value during the week decreased by 8.0% to reach QR1.7bn versus QR1.8bn in the prior week. The Banks and Financial Services sector led the trading value during the week, accounting for 28.0% of the total trading value. The Industrials was the second biggest contributor to the overall trading value, accounting for 27.5% of the total trading value. Qatari Investors Group (QIGD) was the top value traded stock during the week with total traded value of QR293.0mn. Trading volume decreased by 12.4% to reach 42.4mn shares versus 48.4mn shares in the prior week. The number of transactions increased by 3.5% to reach 26,719 transactions versus 25,810 transactions in the prior week. The Banks and Financial Services sector led the trading volume, accounting for 29.1%, followed by the Industrials, which accounted for 20.9% of the overall trading volume. QIGD was the top volume traded stock during the week with total traded volume of 4.8mn shares. Foreign institutions remained bullish during the week with net buying of QR162.6mn vs. net buying of QR212.8mn in the prior week. Qatari institutions remained bearish with net selling of QR71.9mn vs. net selling of QR76.1mn the week before. Foreign retail investors remained bearish for the week with net selling of QR16.4mn vs. net selling of QR23.3mn in the prior week. Qatari retail investors remained bearish with net selling of QR74.4mn vs. net selling of QR113.4 the week before. In 2016 YTD, foreign institutions bought (on a net basis) ~$236mn worth of Qatari equities. Market Indicators Week ended April 07 , 2016 Week ended March 31 , 2016 Chg. % Value Traded (QR mn) 1,700.1 1,847.0 (8.0) Exch. Market Cap. (QR mn) 543,648.1 554,031.0 (1.9) Volume (mn) 42.4 48.4 (12.4) Number of Transactions 26,719 25,810 3.5 Companies Traded 43 44 (2.3) Market Breadth 9:33 25:17 – Market Indices Close WTD% MTD% YTD% Total Return 16,380.42 (2.0) (2.0) 1.0 All Share Index 2,827.84 (1.9) (1.9) 1.8 Banks/Financial Svcs. 2,738.22 (2.0) (2.0) (2.4) Industrials 3,121.21 (3.0) (3.0) (2.1) Transportation 2,543.75 (0.6) (0.6) 4.6 Real Estate 2,470.21 (2.2) (2.2) 5.9 Insurance 4,508.68 0.7 0.7 11.8 Telecoms 1,169.83 (1.1) (1.1) 18.6 Consumer 6,557.87 (0.7) (0.7) 9.3 Al Rayan Islamic Index 3,966.25 (2.4) (2.4) 2.9 Market Indices Weekly Index Performance Regional Indices Close WTD% MTD% YTD% Weekly Exchange Traded Value ($ mn) Exchange Mkt. Cap. ($ mn) TTM P/E** P/B** Dividend Yield Qatar (QSE)* 10,164.76 (2.0) (2.0) (2.5) 466.88 149,285.8 12.3 1.5 4.2 Dubai 3,386.14 0.9 0.9 7.5 867.11 88,625.6# 11.5 1.2 3.6 Abu Dhabi 4,351.70 (0.9) (0.9) 1.0 198.11 123,415.6 11.1 1.4 5.7 Saudi Arabia# 6,213.58 (0.2) (0.2) (10.1) 6,071.05 381,579.0 14.3 1.5 4.2 Kuwait 5,230.44 0.0 0.0 (6.9) 209.13 81,481.7 15.3 1.0 4.8 Oman 5,609.70 2.6 2.6 3.8 64.55 22,535.7 12.8 1.2 4.7 Bahrain 1,117.25 (1.2) (1.2) (8.1) 6.72 17,572.0 8.5 0.6 4.9 Source: Bloomberg, country exchanges and Zawya (** Trailing Twelve Months; * Value traded ($ mn) do not include special trades, if any; # Data as of April 06, 2016) 10,251.97 10,234.36 10,008.77 10,031.02 10,164.76 0 6,000,000 12,000,000 9,850 10,075 10,300 3-Apr 4-Apr 5-Apr 6-Apr 7-Apr Volume QSE Index 2.6% 0.9% 0.0% (0.2%) (0.9%) (1.2%) (2.0%)(3.0%) 0.0% 3.0% Oman Dubai Kuwait SaudiArabia AbuDhabi Bahrain Qatar(QSE)*
- 2. Page 2 of 6 News Market News QNBK profit rises 7.1% YoY in 1Q2016 to QR2.9bn – QNB Group (QNBK) reported a net profit of QR2.9bn in 1Q2016, up 7.1% YoY. Net interest income increased by 4.3% YoY in 1Q2016 to reach QR3.3bn. Net fee & commission income and net gain from foreign exchange reached QR0.5bn and QR0.2bn, respectively. Operating income reached QR4.1bn up 1.8%YoY in 1Q2016. Total assets rose to QR550bn at the end of March 31, 2016 (vs. QR502bn at the end of March 31, 2015). Net loans & advances rose to QR402bn in 1Q2016, while customer deposits grew to QR403bn in 1Q2016. Consequently, the bank’s loan-to-deposit ratio (LDR) advanced to 99.7% March 2016 as compared to 98.3% in December 2015. EPS for 1Q2016 amounted to QR3.4 vs. QR3.2 in 1Q2015. The Group’s Capital Adequacy Ratio (CAR) calculated as per the Qatar Central Bank (QCB) and Basel III requirements stood at 15.8% as at March 31, 2016, higher than the regulatory minimum requirements of the QCB and Basel Committee. QNBK recorded an NPL ratio of 1.4%, one of the lowest among banks in the MENA region, while its coverage ratio reached 120%. Total shareholders’ equity increased to QR60bn (from QR54bn as at March 31, 2015). The Group is keen to maintain a strong capitalization in order to support future strategic plans. The Group’s prudent cost control policy and strong revenue generating capability allowed it to maintain an efficiency ratio (cost to income ratio) of 22.7%, which is considered one of the best ratios among financial institutions in the region. (QNB Group Press Release) QNBK mandates banks to arrange €1.5bn loan facility – QNB Group (QNBK) has mandated banks to arrange on its behalf a new €1.5bn three-year senior unsecured term loan facility. Credit Agricole Corporate and Investment Bank and Societe Generale Corporate & Investment Banking are acting as the “initial mandated lead arrangers” and “book-runners” and are joined by ING Bank as “initial mandated lead arranger”. QNBK intends to use the loan facility for general corporate purposes. (QSE) QCB auctions T-bills worth QR1.5bn on April 5 – Qatar Central Bank (QCB) auctioned Treasury bills worth QR1.5bn on April 5, 2016, for which it received bids totaling QR2.05bn. The three- month bills were sold at a yield of 1.31%, down from 1.48% at the last three-month bill sale in December 2016, while the six- month bills were sold at 1.27% against 1.75% and the nine- month bills at 1.38% against 2.00%. (QCB, Reuters) ABQK sets final spread for $500mn debut bond issue – Ahli Bank (ABQK) has set the final spread for a $500mn five-year debut bond issue. ABQK (rated ‘A+’ by Fitch and ‘A2’ by Moody's) has set the final spread at 260 basis points (bps) over midswaps, tighter than initial guidance in the area of 275 bps over the same benchmark given on Tuesday. ABQK drew $1.2bn in orders. Barclays, HSBC, and QNB Capital are acting as arrangers for the bond sale. (Reuters) CBQK to disclose 1Q2016 financial results on April 19 – Commercial Bank (CBQK) will disclose its 1Q2016 financial results on April 19, 2016. (QSE) QGTS to disclose 1Q2016 financial results on April 19 – Qatar Gas Transport Company (QGTS) will disclose its 1Q2016 financial results on April 19, 2016. (QSE) GWCS to disclose 1Q2016 financial results on April 20 – Gulf Warehousing Company (GWCS) will disclose its 1Q2016 financial results on April 20, 2016. (QSE) ERES to disclose 1Q2016 financial results on April 28 – Ezdan Holding Group (ERES) announced to disclose its 1Q2016 financial results on April 28, 2016. (QSE) QIGD to disclose 1Q2016 financial results on April 12 – Qatari Investors Group (QIGD) will disclose its 1Q2016 financial results on April 12, 2016. (QSE) MCGS to disclose 1Q2016 financial results on April 20 – Medicare Group (MCGS) will disclose its 1Q2016 financial results on April 20, 2016. (QSE) Woqod postpones its EGM to May 25 – Qatar Fuel Company (Woqod) announced that its Board of Directors has decided to postpone the extraordinary general assembly meeting (EGM) for the company for lack of the legal quorum. Accordingly, the meeting will be held on May 25, 2016 at Woqod Tower auditorium. (QSE) MCCS to disclose 1Q2016 financial results on April 20 – Mannai Corporation (MCCS) announced to disclose its 1Q2016 financial results on April 20, 2016. (QSE) MARK to disclose 1Q2016 financial results on April 19 – Masraf Al Rayan (MARK) will disclose its 1Q2016 financial results on April 19, 2016. (QSE) MRDS to disclose 1Q2016 financial results on April 19 – Mazaya Qatar Real Estate Development Company (MRDS) will disclose its 1Q2016 financial results on April 19, 2016. (QSE) QOIS to disclose 1Q2016 financial results on April 25 – Qatar Oman Investment Company (QOIS) will disclose its 1Q2016 financial results on April 25, 2016. (QSE) ORDS to disclose 1Q2016 financial results on April 27 – Ooredoo (ORDS) will disclose its 1Q2016 financial results on April 27, 2016. (QSE) DOHI to disclose 1Q2016 financial results on April 20 – Doha Insurance Company (DOHI) will disclose its 1Q2016 financial results on April 20, 2016. (QSE) QIMD to disclose 1Q2016 financial results on April 20 – Qatar Industrial Manufacturing Company (QIMD) will disclose its 1Q2016 financial results on April 20, 2016. (QSE) QEWS to disclose 1Q2016 financial results on April 19 – Qatar Electricity and Water Company (QEWS) will disclose its 1Q2016 financial results on April 19, 2016. (QSE) KCBK to disclose 1Q2016 financial results on April 19 – Al Khalij Commercial Bank (KCBK) will disclose its 1Q2016 financial results on April 19, 2016. (QSE) QIMD to disclose 1Q2016 financial results on April 20 – Qatar Industrial Manufacturing Company (QIMD) will disclose its 1Q2016 financial results on April 20, 2016. (QSE) QATI to disclose 1Q2016 financial results on April 19 – Qatar Insurance Company (QATI) will disclose its 1Q2016 financial results on April 19, 2016. (QSE)
- 3. Page 3 of 6 Qatar Stock Exchange Top Gainers Top Decliners Source: Qatar Stock Exchange (QSE) Source: Qatar Stock Exchange (QSE) Most Active Shares by Value (QR Million) Most Active Shares by Volume (Million) Source: Qatar Stock Exchange (QSE) Source: Qatar Stock Exchange (QSE) Investor Trading Percentage to Total Value Traded Net Traded Value by Nationality (QR Million) Source: Qatar Stock Exchange (QSE) Source: Qatar Stock Exchange (QSE) 11.6% 4.6% 4.1% 3.1% 2.2% 0.0% 4.0% 8.0% 12.0% WidamFood Co. Medicare Group Qatar General Insurance& Reinsurance Gulf Warehousing Al Khaliji -13.5% -8.4% -5.5% -5.0% -4.1% -18.0% -12.0% -6.0% 0.0% Qatar Cinema & Film Distribution Qatari Investors Group Qatar & Oman Investment Barwa Real Estate Commercial Bank of Qatar 293.0 174.3 162.4 142.8 113.1 0.0 100.0 200.0 300.0 Qatari Investors Group Gulf Warehousing MasrafAl Rayan WidamFood Co. Islamic Holding Group 4.8 4.7 3.2 2.9 2.6 0.0 2.0 4.0 6.0 Qatari Investors Group MasrafAl Rayan National Leasing Gulf Warehousing Vodafone Qatar 0% 20% 40% 60% 80% 100% Buy Sell 47.22% 51.60% 15.70% 19.93% 19.82% 20.79% 17.26% 7.69% Qatari Individuals Qatari Institutions Non-Qatari Individuals Non-Qatari Institutions 1,070 630 1,216 484 (146) 146 (400) (200) - 200 400 600 800 1,000 1,200 1,400 Qatari Non-Qatari Net Investment Total Sold Total Bought
- 4. Page 4 of 6 TECHNICAL ANALYSIS OF THE QSE INDEX Source: Bloomberg The resistance level below the 10,500 proved its strength and the Index closed down by 2.04% vs the week before; the Index closed at 10,164.76. Traded volumes were shallower than the previous week, which can be a slightly positive sign. We update our support level to 9,500 points from the 9,000 level and the resistance remains at 10,500 points. DEFINITIONS OF KEY TERMS USED IN TECHNICAL ANALYSIS RSI (Relative Strength Index) indicator – RSI is a momentum oscillator that measures the speed and change of price movements. The RSI oscillates between 0 to 100. The index is deemed to be overbought once the RSI approaches the 70 level, indicating that a correction is likely. On the other hand, if the RSI approaches 30, it is an indication that the index may be getting oversold and therefore likely to bounce back. MACD (Moving Average Convergence Divergence) indicator – The indicator consists of the MACD line and a signal line. The divergence or the convergence of the MACD line with the signal line indicates the strength in the momentum during the uptrend or downtrend, as the case may be. When the MACD crosses the signal line from below and trades above it, it gives a positive indication. The reverse is the situation for a bearish trend. Candlestick chart – A candlestick chart is a price chart that displays the high, low, open, and close for a security. The ‘body’ of the chart is portion between the open and close price, while the high and low intraday movements form the ‘shadow’. The candlestick may represent any time frame. We use a one-day candlestick chart (every candlestick represents one trading day) in our analysis. Doji candlestick pattern – A Doji candlestick is formed when a security's open and close are practically equal. The pattern indicates indecisiveness, and based on preceding price actions and future confirmation, may indicate a bullish or bearish trend reversal. Shooting Star/Inverted Hammer candlestick patterns – These candlestick patterns have a small real body (open price and close price are near to each other), and a long upper shadow (large intraday movement on the upside). The Shooting Star is a bearish reversal pattern that forms after a rally. The Inverted Hammer looks exactly like a Shooting Star, but forms after a downtrend. Inverted Hammers represent a potential bullish trend reversal.
- 5. Page 5 of 6 Source: Bloomberg Company Name Price (April 07) % Change WTD % Change YTD Market Cap. QR Million TTM P/E P/B Div. Yield Qatar National Bank 139.90 (0.64) (4.07) 117,471 10.3 2.0 2.5 Qatar Islamic Bank 100.00 (3.47) (6.28) 23,629 12.2 1.8 4.3 Commercial Bank of Qatar 39.95 (4.08) (12.96) 13,049 10.5 0.9 7.5 Doha Bank 37.20 0.13 (16.40) 9,611 7.7 1.0 8.1 Al Ahli Bank 46.05 (4.06) 5.00 8,786 13.6 1.9 3.3 Qatar International Islamic Bank 65.00 (3.27) 1.09 9,839 12.5 1.8 6.2 Masraf Al Rayan 34.40 (3.64) (8.51) 25,800 12.5 2.1 5.1 Al Khaliji Bank 17.74 2.25 (1.28) 6,386 10.2 1.1 5.6 National Leasing 16.40 (1.20) 16.31 811 N/A 0.8 3.0 Dlala Holding 19.10 0.47 3.30 543 N/A 1.6 N/A Qatar & Oman Investment 11.86 (5.50) (3.58) 374 6.8 1.1 5.1 Islamic Holding Group 73.00 (2.67) (7.24) 413 56.3 4.7 2.1 Banking and Financial Services 216,713 Zad Holding 91.00 (1.94) 7.31 1,190 12.2 1.5 4.4 Qatar German Co. for Medical Devices 12.41 (2.13) (9.55) 143 N/A 1.4 N/A Salam International Investment 12.00 (9.71) 1.52 1,372 12.1 0.8 8.3 Medicare Group 113.00 4.63 (5.28) 3,180 17.6 2.9 1.6 Qatar Cinema & Film Distribution 29.50 (13.62) (13.24) 185 12.9 1.4 5.1 Qatar Fuel 152.00 (2.25) 11.29 13,865 11.1 2.0 5.0 Widam Food Co. 60.50 11.62 14.58 1,089 15.7 4.1 4.1 Al Meera Consumer Goods 203.00 (1.93) (7.73) 4,060 25.6 2.9 4.4 Consumer Goods and Services 25,085 Qatar Industrial Manufacturing 38.00 0.00 (4.64) 1,806 10.7 1.2 7.9 Qatar National Cement 86.50 (0.57) (6.72) 5,139 11.1 1.8 4.2 Industries Qatar 104.70 (3.32) (5.76) 63,344 14.3 1.9 4.8 Qatari Investors Group 54.40 (8.42) 44.30 6,763 26.8 2.8 2.3 Qatar Electricity and Water 208.80 (0.57) (3.51) 22,968 15.3 3.1 3.6 Mannai Corp. 89.50 (2.72) (6.09) 4,083 7.7 1.7 5.6 Aamal 12.46 (2.58) (10.94) 7,850 13.0 1.1 7.6 Gulf International Services 35.00 (3.58) (32.04) 6,504 8.1 1.7 2.9 Mesaieed Petrochemical Holding 18.44 (3.46) -4.9 23,166 21.2 1.6 3.8 Industrials 141,623 Qatar Insurance 82.70 (0.24) 18.95 16,795 17.2 3.1 2.6 Doha Insurance 19.39 1.25 (7.67) 970 8.7 0.9 5.2 Qatar General Insurance & Reinsurance 51.50 4.15 10.86 4,507 4.9 0.7 2.7 Al Khaleej Takaful Insurance 27.00 1.69 (11.48) 689 17.0 1.2 3.7 Qatar Islamic Insurance 69.50 (0.14) (3.47) 1,043 12.7 3.1 5.8 Insurance 24,003 United Development 19.10 (3.00) (7.95) 6,763 9.8 0.6 7.9 Barw a Real Estate 34.40 (4.97) (14.00) 13,386 4.4 0.8 6.4 Ezdan Real Estate 18.00 (1.10) 13.21 47,745 28.1 1.6 2.2 Mazaya Qatar Real Estate Development 13.55 (3.63) 0.19 1,494 13.4 1.1 2.0 Real Estate 69,388 Ooredoo 92.20 (0.86) 22.93 29,534 14.0 1.4 3.3 Vodafone Qatar 12.09 (1.87) (4.80) 10,221 N/A 2.0 1.7 Telecoms 39,754 Qatar Navigation (Milaha) 90.60 (0.98) (4.63) 10,376 9.4 0.8 5.5 Gulf Warehousing 60.50 3.07 6.33 3,545 16.6 2.0 2.5 Qatar Gas Transport (Nakilat) 23.50 (1.26) 0.64 13,160 13.3 2.9 5.3 Transportation 27,081 Qatar Exchange 543,648
- 6. Contacts Saugata Sarkar Shahan Keushgerian Zaid al-Nafoosi , CMT, CFTe Head of Research Senior Research Analyst Senior Research Analyst Tel: (+974) 4476 6534 Tel: (+974) 4476 6509 Tel: (+974) 4476 6535 saugata.sarkar@qnbfs.com.qa shahan.keushgerian@qnbfs.com.qa zaid.alnafoosi@qnbfs.com.qa QNB Financial Services SPC Contact Center: (+974) 4476 6666 PO Box 24025 Doha, Qatar Disclaimer and Copyright Notice: This publication has been prepared by QNB Financial Services SPC (“QNBFS”) a wholly-owned subsidiary of QNB SAQ (“QNB”). QNBFS is regulated by the Qatar Financial Markets Authority and the Qatar Exchange QNB SAQ is regulated by the Qatar Central Bank. This publication expresses the views and opinions of QNBFS at a given time only. It is not an offer, promotion or recommendation to buy or sell securities or other investments, nor is it intended to constitute legal, tax, accounting, or financial advice. QNBFS accepts no liability whatsoever for any direct or indirect losses arising from use of this report. Any investment decision should depend on the individual circumstances of the investor and be based on specifically engaged investment advice. We therefore strongly advise potential investors to seek independent professional advice before making any investment decision. Although the information in this report has been obtained from sources that QNBFS believes to be reliable, we have not independently verified such information and it may not be accurate or complete. QNBFS does not make any representations or warranties as to the accuracy and completeness of the information it may contain, and declines any liability in that respect. For reports dealing with Technical Analysis, expressed opinions and/or recommendations may be different or contrary to the opinions/recommendations of QNBFS Fundamental Research as a result of depending solely on the historical technical data (price and volume). QNBFS reserves the right to amend the views and opinions expressed in this publication at any time. It may also express viewpoints or make investment decisions that differ significantly from, or even contradict, the views and opinions included in this report. This report may not be reproduced in whole or in part without permission from QNBFS COPYRIGHT: No part of this document may be reproduced without the explicit written permission of QNBFS. Page 6 of 6