Risk on the Rise: Counting the Cost of Inland Flooding
•
3 likes•3,174 views

How can you estimate the potential cost of inland flooding? Stay on top of inland flood risks with a deeper understanding of vulnerability and hazard. RMS' Dr. Robert Muir-Wood and Dr. Navin Peiris delve into the challenges of reconstructing inland flood events in real time and modeling the vulnerability of the affected properties.

Recommended
Recommended
More Related Content
Similar to Risk on the Rise: Counting the Cost of Inland Flooding
Similar to Risk on the Rise: Counting the Cost of Inland Flooding (20)
More from RMS
More from RMS (7)
Recently uploaded
Recently uploaded (20)
Risk on the Rise: Counting the Cost of Inland Flooding
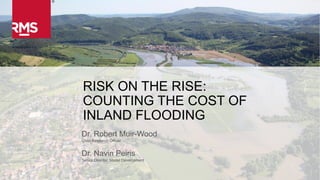
- 1. 1Copyright © 2016 Risk Management Solutions, Inc. All Rights Reserved. January 21, 2016 RISK ON THE RISE: COUNTING THE COST OF INLAND FLOODING Dr. Robert Muir-Wood Chief Research Officer Dr. Navin Peiris Senior Director, Model Development
- 2. 2Copyright © 2016 Risk Management Solutions, Inc. All Rights Reserved. January 21, 2016 MEET THE EXPERTS Dr. Robert Muir-Wood Chief Research Officer Dr. Navin Peiris Senior Director, Model Development
- 3. 3Copyright © 2016 Risk Management Solutions, Inc. All Rights Reserved. January 21, 2016 INLAND FLOOD RISK = HAZARD EXPOSURE VULNERABILITYX X FLOOD LOSSES ARE NOT ONLY DEPENDENT UPON HAZARD
- 4. 4Copyright © 2016 Risk Management Solutions, Inc. All Rights Reserved. January 21, 2016 Inundation Rainfall Runoff Major and Minor Rivers Defenses and Drainage RECAP: HAZARD GENERATION Precipitation PRECIPITATION
- 5. 5Copyright © 2016 Risk Management Solutions, Inc. All Rights Reserved. January 21, 2016 INLAND FLOOD RISK = UNDERSTANDING EXPOSURE HAZARD EXPOSURE VULNERABILITYX X
- 6. THE IMPORTANCE OF UNDERLYING DIGITAL TERRAIN DATA
- 7. 7Copyright © 2016 Risk Management Solutions, Inc. All Rights Reserved. January 21, 2016 COLLECTING FLOOD-RELEVANT EXPOSURE DATA
- 10. 10Copyright © 2016 Risk Management Solutions, Inc. All Rights Reserved. January 21, 2016 1. Where detailed location information is unknown: Exposure Disaggregation 2. Where primary characteristics of a location are unknown: Building Inventory HOW TO HANDLE SITUATIONS WHERE DETAILED EXPOSURE DATA IS NOT AVAILABLE
- 11. 11Copyright © 2016 Risk Management Solutions, Inc. All Rights Reserved. January 21, 2016 INLAND FLOOD RISK = TRANSLATING HAZARD AND EXPOSURE INTO LOSS HAZARD EXPOSURE VULNERABILITYX X
- 12. FLOOD DAMAGE TO BUILDINGS IS PRINCIPALLY NONSTRUCTURAL
- 13. STRUCTURAL DAMAGE CAN OCCUR WHERE HIGH FLOW CONDITIONS EXIST
- 14. THERE IS OFTEN SUBSTANTIAL DAMAGE TO CONTENTS
- 15. 15Copyright © 2016 Risk Management Solutions, Inc. All Rights Reserved. January 21, 2016Copyright © 2015 Risk Management Solutions, Inc.. THE LIKELIHOOD OF FLOODING OF A SPECIFIC PROPERTY IS DEPENDENT UPON A NUMBER OF FACTORS A number of factors in addition to hazard determine if a specific property is flooded
- 16. 16Copyright © 2016 Risk Management Solutions, Inc. All Rights Reserved. January 21, 2016Copyright © 2015 Risk Management Solutions, Inc.. Characterization of flood vulnerability Damage Ra(o Flood Depth Probability of complete loss Probability of no loss Mean Damage Ra(o Central distribu5on
- 17. 17Copyright © 2016 Risk Management Solutions, Inc. All Rights Reserved. January 21, 2016Copyright © 2015 Risk Management Solutions, Inc.. Uncertainty in flood loss data and challenges in vulnerability development Wide distribution of claims data on a flood depth vs. loss ratio plot highlights the level of uncertainty in flood loss estimation and hence challenges faced during development of vulnerability functions 0% 10% 20% 30% 40% 50% 60% 70% 80% 90% 100% 0 50 100 150 200 250 300 350 Loss Ra(o Flood Depth (cm) Ground floor only Cellar and ground floor flooded Cellar only
- 18. 18Copyright © 2016 Risk Management Solutions, Inc. All Rights Reserved. January 21, 2016 CONSTRUCTING AN ADVANCED FLOOD VULNERABILITY CURVE Single- Component, Engineering- Based Approach Country-Specific Damage Functions Validated by Claims Data DamageRatio Flood Depth
- 19. 19Copyright © 2016 Risk Management Solutions, Inc. All Rights Reserved. January 21, 2016 DIFFERENTIATION OF FLOOD VULNERABILITY Property Elevation Threshold Elevation Basement and Basement Occupancies Number of Stories Property Age Construction Type Private Flood Defenses
- 20. 20Copyright © 2016 Risk Management Solutions, Inc. All Rights Reserved. January 21, 2016 IMPACT OF EXPOSURE CHARACTERISTICS UPON LOSSES
- 21. 21Copyright © 2016 Risk Management Solutions, Inc. All Rights Reserved. January 21, 2016 SPECIAL TREATMENT OF INDUSTRIAL FACILITIES PETROCHEMICAL/OIL REFINERY SEMICONDUCTOR FABRICATION FACILITY
- 22. POST-EVENT LOSS AMPLIFICATION (PLA) CAN PROVIDE AN ADDITIONAL SOURCE OF LOSS
- 23. 23Copyright © 2016 Risk Management Solutions, Inc. All Rights Reserved. January 21, 2016 CALIBRATION AND VALIDATION STEPS ENSURE THAT MODELED LOSSES ARE REALISTIC 2007 U.K. Floods • 50% of 2007 U.K. flood losses were off-floodplain • Industry consensus of 30-50 year return period losses U.K. Flood Model • 50% of annual average loss from pluvial flooding • 30-50 year return period aligned to modelled exceedance probability 2013 Central European Floods • 40% of losses in Germany were off- floodplain • Industry consensus of 40-50 year return period losses Continental Europe Flood Models • 20-40% of annual average loss from pluvial flooding • 40-50 year return period a good validation point for the model
- 24. 24Copyright © 2016 Risk Management Solutions, Inc. All Rights Reserved. January 21, 2016 DETERMINING LOSSES IN REAL TIME IN THE AFTERMATH OF FLOOD EVENTS INLAND FLOOD RISK = HAZARD EXPOSURE VULNERABILITYX X
- 25. A STOCHASTIC EVENT THAT MATCHES THE OBSERVED EVENT CLOSELY ENOUGH FOR AN ACCURATE LOSS ESTIMATE IS UNLIKELY TO EXIST
- 26. 26Copyright © 2016 Risk Management Solutions, Inc. All Rights Reserved. January 21, 2016 CHALLENGES IN DEVELOPING FLOOD FOOTPRINT RECONSTRUCTIONS Location of Defense Failures Uncertain Measurements of River Discharge Can Be Unreliable or Nonexistent Inaccuracies in Using Satellite Data Alone
- 27. 27Copyright © 2016 Risk Management Solutions, Inc. All Rights Reserved. January 21, 2016Copyright © 2015 Risk Management Solutions, Inc.. HOW AN EFFECTIVE FLOOD FOOTPRINT IS DEVELOPED 1. Identify which areas have been flooded 2. Understand the return period of flooding and use appropriate flood maps to determine inundation 3. Validate using damage survey measurements RMS-surveyed flood depths (red outlined circles), modeled footprint (blue shading), and PERILS-based accumulation footprint (green outline) for the 2013 central European floods in Meissen, Germany
- 28. 28Copyright © 2016 Risk Management Solutions, Inc. All Rights Reserved. January 21, 2016 2828Copyright © 2015 Risk Management Solutions, Inc. All Rights Reserved. January 21, 2016 LESSONS LEARNED FROM RECENT RECONNAISSANCE
- 29. 29Copyright © 2016 Risk Management Solutions, Inc. All Rights Reserved. January 21, 2016 THE 2013 CENTRAL EUROPEAN FLOODS – HIGHLIGHTED THE NEED FOR GRANULAR EXPOSURE DATA EXTERNAL DAMAGE INTERNAL DAMAGE
- 30. 30Copyright © 2016 Risk Management Solutions, Inc. All Rights Reserved. January 21, 2016 THE 2013 CENTRAL EUROPEAN FLOODS – OIL CONTAMINATION LEADING TO WRITE-OFF § Loss exacerbated by the presence of oil contamination leads to demolition and reconstruction
- 31. 31Copyright © 2016 Risk Management Solutions, Inc. All Rights Reserved. January 21, 2016 DECEMBER 2015, STORM DESMOND FLOODS, U.K. - RESIDENTIAL PROPERTY DAMAGE – DAMAGE TO BASEMENTS
- 32. 32Copyright © 2016 Risk Management Solutions, Inc. All Rights Reserved. January 21, 2016 DECEMBER 2015, STORM DESMOND FLOODS, U.K. - POWER OUTAGES § Flooded electricity substation in Lancaster led to power outages for 55,000 homes and business throughout north Lancashire up to 2 weeks
- 33. 33Copyright © 2016 Risk Management Solutions, Inc. All Rights Reserved. January 21, 2016 DECEMBER 2015, STORM EVA FLOODS, U.K. – CHALLENGES OF FLOOD FOOTPRINT DEVELOPMENT - YORK River Foss River Ouse Flood gates
- 34. 34Copyright © 2016 Risk Management Solutions, Inc. All Rights Reserved. January 21, 2016 DECEMBER 2015, STORM EVA FLOODS, U.K. – ELEVATION, BASEMENTS, FLOOD DEFENCES DRIVING COMMERCIAL LOSSES Damage to commercial properties and contents on Walmgate, York BT building on Garden Place with sandbags and basement being pumped,, Leeds
- 35. 35Copyright © 2016 Risk Management Solutions, Inc. All Rights Reserved. January 21, 2016 MONSOON FLOODING IN CHENNAI, INDIA, NOVEMBER 2015 § Business Interruption loss driven damage to facilities as well as unavailability of man-power due to access difficulties and government announcing 2-day holiday for safety reasons
- 36. 36Copyright © 2016 Risk Management Solutions, Inc. All Rights Reserved. January 21, 2016 Dr. Robert Muir-Wood Chief Research Officer Dr. Navin Peiris Senior Director, Model Development CONCLUSIONS 1. Detailed exposure data is vital for an accurate estimate of losses 2. An engineering based vulnerability approach is most robust for flood 3. Losses from real events can be estimated accurately in real time 4. Lessons learned from reconnaissance feed into model science
- 37. ABOUT RMSRMS is the world’s leading provider of products, services, and expertise for the quantification and management of catastrophe risk. More than 400 leading insurers, reinsurers, trading companies, and other financial institutions rely on RMS models to quantify, manage, and transfer risk. As an established provider of risk modeling to companies across all market segments, RMS provides solutions that can be trusted as reliable benchmarks for strategic pricing, risk management, and risk transfer decisions. ©2014 Risk Management Solutions, Inc. RMS and the RMS logo are registered trademarks of Risk Management Solutions,Inc. All other trademarks are property of their respective owners. 37Copyright © 2015 Risk Management Solutions, Inc. All Rights Reserved. January 21, 2016 ABOUT RMSRMS is the world’s leading provider of products, services, and expertise for the quantification and management of catastrophe risk. More than 400 leading insurers, reinsurers, trading companies, and other financial institutions rely on RMS models to quantify, manage, and transfer risk. As an established provider of risk modeling to companies across all market segments, RMS provides solutions that can be trusted as reliable benchmarks for strategic pricing, risk management, and risk transfer decisions. ©2014 Risk Management Solutions, Inc. RMS and the RMS logo are registered trademarks of Risk Management Solutions,Inc. All other trademarks are property of their respective owners. 37Copyright © 2015 Risk Management Solutions, Inc. All Rights Reserved. January 21, 2016