1. 1
to identify and organize the marketing spend
patterns of startups. We collected data from 41
companies and asked straightforward questions
aiming to discover the scale and activity
allocations of their marketing dollars. In Lean
style, we started small to test a few concepts
and learn. As a result, you’ll see several areas
in which further research opportunities are
called out to explore in subsequent versions.
The results are organized by five core findings.
We advise entrepreneurs to use these findings
for insight, but not for prescriptive conclusions.
In the startup realm, all the data in the world
won’t replace the value of understanding and
defining your company’s unique position and
market opportunity.
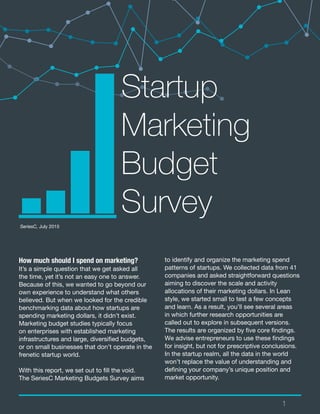
Startup
Marketing
Budget
SurveySeriesC, July 2015
How much should I spend on marketing?
It’s a simple question that we get asked all
the time, yet it’s not an easy one to answer.
Because of this, we wanted to go beyond our
own experience to understand what others
believed. But when we looked for the credible
benchmarking data about how startups are
spending marketing dollars, it didn’t exist.
Marketing budget studies typically focus
on enterprises with established marketing
infrastructures and large, diversified budgets,
or on small businesses that don’t operate in the
frenetic startup world.
With this report, we set out to fill the void.
The SeriesC Marketing Budgets Survey aims
2. 2
On average companies spend approximately
10% of their revenue on marketing. Digging
deeper, 74% of our respondents spent 20%
of revenue or less on marketing, and as Figure
1 suggests, this was skewed toward the 1 to
5% category. On the other side of the chart, a
robust 26% percent of companies are spending
more than 20% of revenue on marketing.
Taken in isolation, these facts aren’t particularly
insightful, but they do provide a sense of scale
of marketing budgets.
On average companies spend
roughly 10% of revenue on
marketing activities. Search, Social,
and Content Marketing lead the
way.
Figure 1: Percentage of annual revenue spent
on marketing. Companies with no revenue or
that responded “didn’t know” were excluded.
n = 38.
We also asked companies to describe their
allocation by activity, as shown in Figure 2.
Search and Social Advertising holds the lion’s
share of budget in our sample. Interestingly,
Content Marketing is not too far behind
accounting for 14% of the budget on average.
This supports the predictions of many experts in
recent years that Content Marketing would see
tremendous growth. As companies look more
and more for ways to develop engaged, loyal
customers, original and useful content is playing
an important role in achieving this goal.
FINDING 1
Percentage of Annual Revenue Spent on Marketing in 2014
3. 3
A few other things are worth noting. First, the
Data Analytics category resides low on the
chart, and we suspect this is a result of where
analytics budgets reside. For example,
companies may choose to roll up their data
capabilities into a single, horizontal group that
supports the entire company, instead of
having these capabilities distributed across
many groups.
Figure 2: Percentage of marketing budget allocated to various activities. n=41.
Search and Social Advertising
0%
Content Marketing
Public Relations
Website
Direct Sales
Email Marketing
Promotions/Sponsorships
Digital Display Advertising
Market Research
Data Analytics
Traditional Advertising
2% 4% 6% 8% 10% 12% 14% 16% 18% 20%
FINDING 1
Secondly, we were curious what the allocation
looked like when separating companies into
two groups: those that met or exceeded
internal revenue expectations vs. those who
underperformed. In both cases, the distribution
of spend was similar to Figure 2.
Percentage of Marketing Budget Spent on
Various Activities in 2014
4. 4
Our survey showed that companies that have
yet to release a full version of their product are
spending under 10% of revenue on marketing
(Figure 3). Meanwhile, companies with more
mature products and/or multiple products have
a wider distribution of spend.
After the Minimum Viable Product
is complete, marketing budgets can
vary widely.
Figure 3: Percentage of annual revenue spent
on marketing by product maturity. n=38. This
only considers those companies that reported
non-zero revenue.
FINDING 2
There is obvious variability in revenue earned
by startups, and in subsequent versions we
plan to examine additional ways to gauge
marketing spend. This includes looking at
spend as a function of venture funding, and of
overall budget. We also believe there is an
opportunity to extract further insights by
refining the definitions of company stages.
NumberofCompanies
8
1% to 5%
of revenue
6% to 10%
of revenue
11% to 15%
of revenue
16% to 20%
of revenue
Greater than
20%of revenue
2
4
2
7
2
4
3
1
2
3
Pre-Product or MVP Released
Full Product Released
Multiple Products Released
Percentage of Annual Revenue Spent on
Marketing in 2014 (by Product Maturity)
5. 5
Figure 4: Percentage of marketing budget allocated to various activities, by product maturity. n=41.
In Figure 4, we drilled in again and asked what
companies were budgeting for, hoping to gain
some insight into how company maturity
influences marketing activity. Some categories,
such as Traditional Advertising, Data Analytics,
and Market Research received low budgets
and were relatively uniform across the maturity
spectrum.
The earliest companies in terms of product
maturity prioritized PR over everything else,
followed by Website and Search and Social
Advertising. We suspect this is to establish
their brand identity, test product/market fit,
and support fundraising goals. Startups in the
first full product stage are spending the largest
portion of their marketing budgets on paid
media, likely to acquire customers and gain
traction.
FINDING 2
Pre-Product or MVP Released Full Product Released Multiple Products Released
Search
and
SocialAdvertising
ContentM
arketingPublicRelations
W
ebsite
DirectSales
Em
ailM
arketing
Prom
otions/Sponsorships
DigitalDisplayAdvertising
M
arketResearch
DataAnalytics
TraditionalAdvertising
0%
5%
10%
15%
20%
25%
30%
Percentage of Marketing Budget Spent on Various
Activities in 2014 (By Product Maturity)
6. 6
B2B and B2C companies spend at
roughly the same rates, but focus
on different activities to achieve
their growth goals.
When we compared the spending patterns of
B2B and B2C companies, we found that there
was a fairly wide distribution of marketing
budgets as a percentage of revenue for each
company type. This was as expected and
shown in Figure 5.
Figure 5: Percentage of annual revenue spent
on marketing type of business. n=38 (B2C =
15, B2B = 23)
FINDING 3
0
2
4
6
8
10
B2B
B2C
Greater than 20%
of revenue
16% to 20%
of revenue
11% to 15%
of revenue
6% to 10%
of revenue
1% to 5%
of revenue
NumberofCompanies
4
10
2
4
3 3
1 1
5 5
Percentage of Annual Revenue Spent on
Marketing in 2014 (B2B vs. B2C)
7. 7
The drill down in Figure 6 shows a difference,
though, in how budget was spent. Search and
Social Advertising accounted for nearly 24% of
B2C marketing spend. B2B marketing budgets
were slightly more uniformly allocated, and in
our survey Content Marketing held the largest
percentage at just over 17%.
We can gain further insight when we group each
marketing activity into paid, earned, and owned
categories. Given the focus on Search and
Social Advertising in B2C companies, it is not
surprising to find that paid media led the way at
42%. B2B companies spent at that exact same
rate, but in a different category: earned media.
Figure 6: Percentage of marketing budget allocated to various activities, by type of business. n=41.
FINDING 3
Percentage of Marketing Budget Spent on
Various Activities in 2014 (B2B vs. B2C)
8. 8
No Budget for Testing
29%
71%
Over half of the respondents set
aside budget explicitly for testing,
and testing showed at least a
moderate correlation with revenue
performance.
56% of all companies in
the survey set aside budget
explicitly for testing. We
suspected going into the
survey that companies who
tested might see better
revenue results. Although
not overwhelming, the data
supports this hypothesis.
Of the 37 companies that
reported their revenue
performance against
expectations, 23 had a testing
budget, and 19 of these (83%)
met or beat expectations. In
the group that did not allocate
budget for testing, only 71%
(10 of 14) met or exceeded
expectations. Figure 7 shows
this breakdown.
Further analysis showed that
testing budgets were more
common among B2C startups
than B2B startups. 82% of
B2C companies said they had
testing budgets, while 42% of
B2B companies said they did.
This difference matched our
team’s experience in the B2B
and B2C sectors, where B2C
investments in market testing
have typically been higher than
B2B.
Figure 7: Companies who set aside a percentage of revenue for testing purposes, organized by whether or not revenue expectations
were met or exceeded. n=37
Met or Exceeded Revenue Expectations
Did Not Meet Revenue Expectations
In your planned 2015 budget, did you set aside a
percentage for testing messaging and content?
FINDING 4
Budget for Testing
17%
83%
23Companies
14Companies
9. 9
Figure 8: Activities that have been outsourced in the last 2 years. n=41.
outsourced PR. While we weren’t surprised
by this result we have seen this function
move in-house among our client base. The
same goes for website, as it has become
easier and cheaper for early stage companies
to use internal resources to build on an
existing platform.
The most outsourced service is PR,
followed by Website. Half of the
companies have outsourced at least
3 services in the last year.
In addition to getting asked “how much should
I spend on marketing” we frequently are asked
if a service should be outsourced or moved in-
house. We asked our survey respondents what
they have outsourced in the last year across six
marketing functions, and the result is shown in
Figure 8. Nearly 71% (29 of 41) of companies
FINDING 5
10 15 20 25 30
Number of Companies
Management/Strategy
Advertising
Digital/Social Media
Branding/Design
Website Development
PR
Which of the following resources have you outsourced in the last 2 years?
50
29
27
22
14
9
6
10. 10
We also looked at how many functions were
outsourced on a per company basis (Figure 9).
Eleven of our respondents (27%) outsourced
exactly 3 of the services we listed, and nearly
half (20 of 41) outsourced 3 or more services.
Separately, when we looked at outsourcing
patterns by product evolution, no concrete
Figure 9: Number of marketing activities outsourced in the last two years. n=41.
pattern emerged. Using product maturity as a
proxy for company size, the outsourcing choice
seems to be independent of the state of the
product. This could have something to do with
the small groupings of our subdivided sample.
It’s worth noting for subsequent studies.
FINDING 5
11. 11
If there was one thing our study showed, it is
that there are many ways to grow a business.
The right marketing mix for one company
isn’t always going to work for the next, and
developing a strategic plan for how to achieve
growth is a critical exercise that should always
be considered in the context of a specific
company and competitive context. It does
seem, however, that there are rules of thumb
to be developed and explored further to make
decision making easier. The research validated
some hypotheses and our own observations and
experience about how startups operate.
We believe subsequent versions of this survey
can do more to categorize spend behaviors
while accounting for nuances. By design,
this survey was meant to first focus on the
conventional wisdom – how the average
startup thinks about their marketing budget.
We think it’s fair (and wise) to ask, what if the
conventional wisdom is wrong? With this line
of thinking we hope to amend future versions
to explore ways of correlating activity with
both marketing and company performance.
We also will likely look for different ways to
categorize companies. One thing we did not
show is the breakdown of budget by company
type: hardware, software, and services. That
categorization is a typical approach used
by larger studies, but it turned out that it
was uninteresting in our results and without
additional context it doesn’t capture the breadth
of how companies describe themselves.
SUMMARY
12. 12
METHODOLOGY
SeriesC surveyed the CEOs and marketing
leaders at 41 startups in Quarter 4, 2014.
Respondents’ companies spanned different
customer orientations (B2B and B2C); product
type (hardware, software, and service); and
lifecycle progression (from early stage to
mature product). All companies were privately
held. Respondents were self-identified CEOs,
CMOs, or senior most marketing leaders for
their respective companies.
For qualification purposes participants
were asked to provide their email address,
name, and company name. The survey was
structured as a “double-blind” study and no
personal or individual company data was
identified by researchers or as a part of this
report. Respondent incentives included a
complimentary advance copy of this report.
Survey responses are not intended to be
representative of the population at large. Unless
other-wise noted, statistical data is intended to
be used for descriptive and not inferential
purposes.
13. 13
Other (non-media) - All types of non-media
channel spend. In this study this includes the
total approximate % of respondent’s 2014
marketing budget spent on data analytics, direct
sales, and market research.
Pre-Full Product Companies - Companies
that answered Pre-product (design and
development) or Minimum Viable Product
released when asked where their company was
in terms of its product evolution
Pre-Product Companies - Companies in the
design and development stage of their product
evolution. These are startups that have yet to
release any form of product into the market.
Minimum Viable Product Companies (MVP) -
Companies post-initial design and development
that have a product version in the market, most
likely in Beta form. This product meets basic
customer needs but does not yet have full
functionality.
Full Product Companies - Startups that have
released a product into the market with full
functionality.
Multiple Product Companies - Startups that
have either release multiple products into
the market or have a single product that has
multiple versions.
Testing Budget - Budget allocated for the
specific purpose of understanding the
performance of messaging or content. This
includes use of services such as Optimizely
and Google AdWords, as well as offline ads and
campaigns.
Met & Exceeded Expectations - Includes all
companies that answered greater than or equal
to 0% when asked “How does your company
expect to perform in relation to fiscal year
revenue targets for 2014?”
Didn’t Meet Expectations - Includes all
companies that answered less than 0% when
asked “How does your company expect to
perform in relation to fiscal year revenue targets
for 2014?”
Paid Media - All types of media that a brand
pays to use the channel. In this study we define
paid media as the total approximate % of
respondent’s 2014 marketing budget spent on
traditional advertising, digital display advertising
(eg. banner ads, flash ads, video, etc.), search
and social advertising (eg. Google Adwords,
Bing, Facebook, Twitter), and promotions/
sponsorships.
Earned Media - All types of media that a brand
earns based on customer or media interest. In
this study we define earned media as the total
approximate % of respondent’s 2014 marketing
budget spent on public relations. These costs
are typically agency fees.
Owned Media - All media channels that a brand
itself controls. In this study we define owned
media as the total approximate % of
respondent’s 2014 marketing budget spent on
content marketing, website, and email
marketing.
DEFINITIONS
14. 14
SeriesC is an innovation-to-market consultancy
that helps companies solve challenges of
traction, transformation and turnaround. We
help earlystage, growth-stage, and enterprise
companies nail their strategies and tell their
stories, and we build world-class launch plans
and go-to-market strategies that pack a punch.
Headquartered in San Francisco, SeriesC was
launched by Andy Cunningham, who led the
marketing strategy for the launch of Apple’s
Macintosh computer with Steve Jobs, and
has spearheaded marketing, branding and
communication strategies for game-changing
technologies and companies ever since. Our
team of veteran technology marketing experts
serve as accountable partners who get things
done.
About SeriesC
Contact us at team@seriesc.net to
discuss your challenges, positioning,
and go-to-market strategy questions.
We love this stuff.